重要
AKS 上的 Azure HDInsight 於 2025 年 1 月 31 日淘汰。 透過此公告 深入瞭解。
您必須將工作負載移轉至 Microsoft Fabric 或對等 Azure 產品,以避免突然終止工作負載。
重要
這項功能目前為預覽狀態。 Microsoft Azure 預覽版的補充使用規定 包含適用於 Beta 版、預覽版或尚未正式發行之 Azure 功能的更合法條款。 如需此特定預覽的相關信息,請參閱 在 AKS 上的 Azure HDInsight 預覽資訊。 如需提出問題或功能建議,請在 AskHDInsight 提交請求,並追蹤我們以獲取 Azure HDInsight 社群 的更多更新。
建立叢集之後,使用者可以使用各種介面來提交和管理作業。
- 使用 Jupyter
- 使用 Zeppelin
- 使用 ssh (執行 Apache Spark 的 spark-submit 命令)
使用 Jupyter
先決條件
AKS 上的 HDInsight 叢集中的 Apache Spark™ 叢集。 如需詳細資訊,請參閱 建立 Apache Spark 叢集。
Jupyter Notebook 是支援各種程式設計語言的互動式筆記本環境。
建立 Jupyter 筆記本
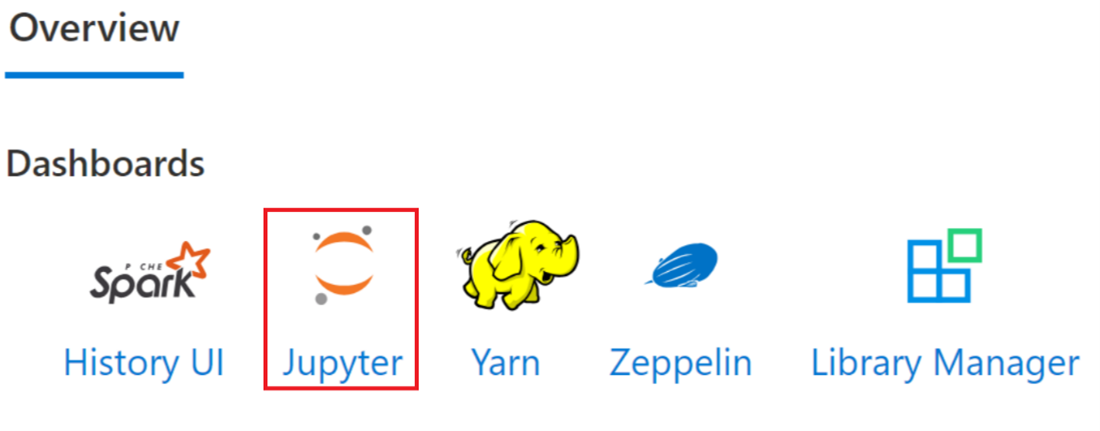
流覽至 [Apache Spark™ 叢集] 頁面,然後開啟 [概觀] 索引卷標。按兩下 Jupyter,它會要求您驗證並開啟 Jupyter 網頁。
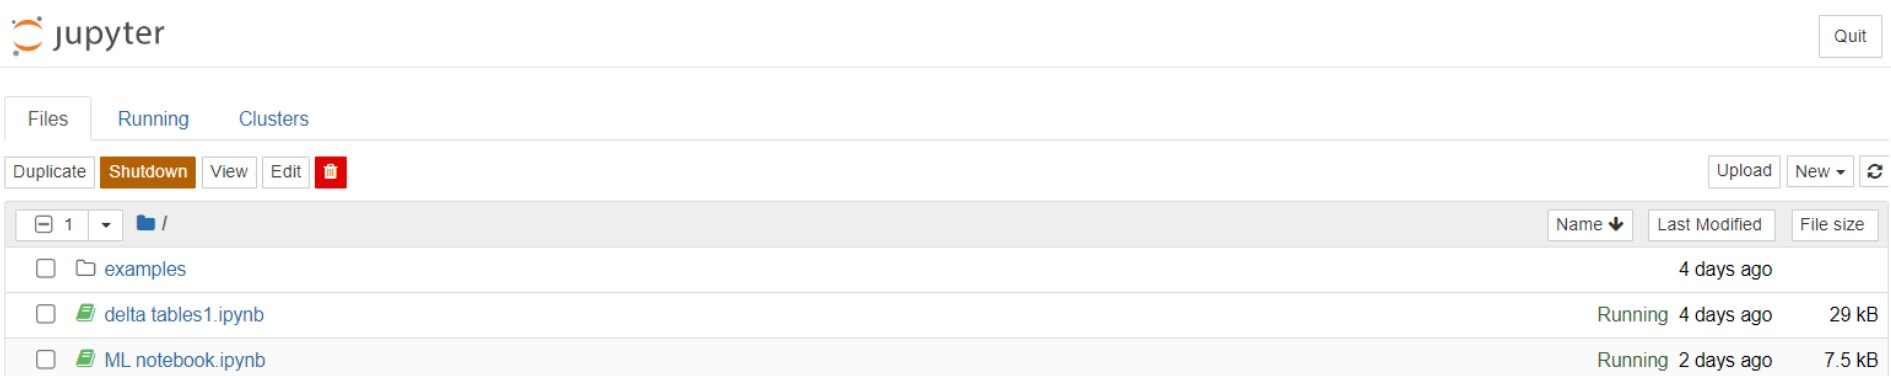
從 Jupyter 網頁,選取 [新增] > PySpark 以建立筆記本。
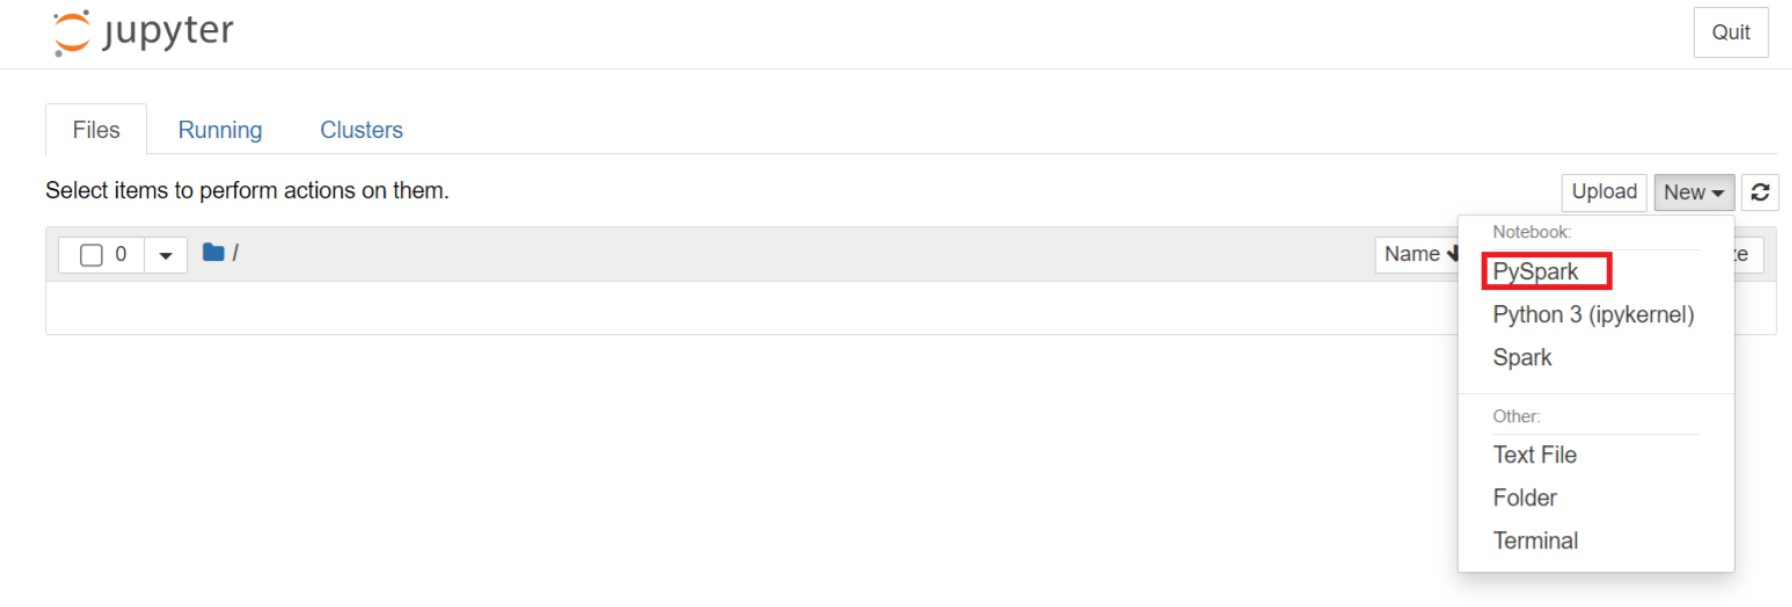
新筆記本以名稱
Untitled(Untitled.ipynb)建立並開啟。注意
藉由使用 PySpark 或 Python 3 核心來建立筆記本,當您執行第一個程式碼區塊時,系統會自動為您建立 Spark 工作階段。 您不需要特意建立會話。
將下列程式代碼貼到 Jupyter Notebook 的空白數據格中,然後按 SHIFT + ENTER 以執行程式碼。 如需更多 Jupyter 控制項的資訊,請在這裡查看 和。
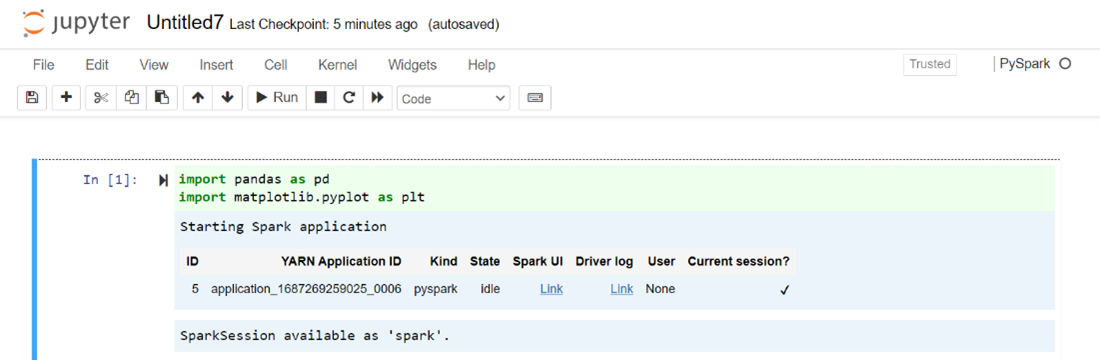
%matplotlib inline
import pandas as pd
import matplotlib.pyplot as plt
data1 = [22,40,10,50,70]
s1 = pd.Series(data1)   #One-dimensional ndarray with axis labels (including time series).

data2 = data1
index = ['John','sam','anna','smith','ben']
s2 = pd.Series(data2,index=index)

data3 = {'John':22, 'sam':40, 'anna':10,'smith':50,'ben':70}
s3 = pd.Series(data3)

s3['jp'] = 32     #insert a new row
s3['John'] = 88

names = ['John','sam','anna','smith','ben']
ages = [10,40,50,48,70]
name_series = pd.Series(names)
age_series = pd.Series(ages)

data_dict = {'name':name_series, 'age':age_series}
dframe = pd.DataFrame(data_dict)
#create a pandas DataFrame from dictionary

dframe['age_plus_five'] = dframe['age'] + 5
#create a new column
dframe.pop('age_plus_five')
#dframe.pop('age')

salary = [1000,6000,4000,8000,10000]
salary_series = pd.Series(salary)
new_data_dict = {'name':name_series, 'age':age_series,'salary':salary_series}
new_dframe = pd.DataFrame(new_data_dict)
new_dframe['average_salary'] = new_dframe['age']*90

new_dframe.index = new_dframe['name']
print(new_dframe.loc['sam'])
繪製圖表,以薪資為 X 軸,年齡為 Y 軸。
在相同的筆記本中,將下列程式代碼貼到 Jupyter Notebook 的空白數據格中,然後按 SHIFT + ENTER 來執行程序代碼。
%matplotlib inline
import pandas as pd
import matplotlib.pyplot as plt

plt.plot(age_series,salary_series)
plt.show()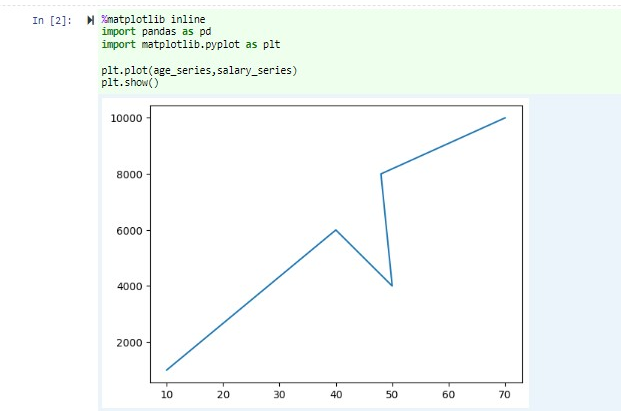


儲存筆記本
從筆記本選單列,導航至 [文件] > [儲存] 和 [檢查點]。
關閉筆記型電腦以釋放叢集資源:從筆記本功能表欄瀏覽至 [檔案] > [關閉並停止]。 您也可以在範例資料夾下執行任何記事本。

使用 Apache Zeppelin 筆記本
AKS 上 HDInsight 中的 Apache Spark 叢集包含 Apache Zeppelin 筆記本。 使用筆記本來執行 Apache Spark 作業。 在本文中,您將瞭解如何在 AKS 叢集上的 HDInsight 上使用 Zeppelin Notebook。
先決條件
AKS 上的 HDInsight 的 Apache Spark 叢集。 如需指示,請參閱 建立 Apache Spark 叢集。
啟動 Apache Zeppelin 筆記本
流覽至 [Apache Spark 叢集概觀] 頁面,然後從 [叢集儀錶板] 中選取 Zeppelin Notebook。 它會提示驗證並開啟 Zeppelin 頁面。

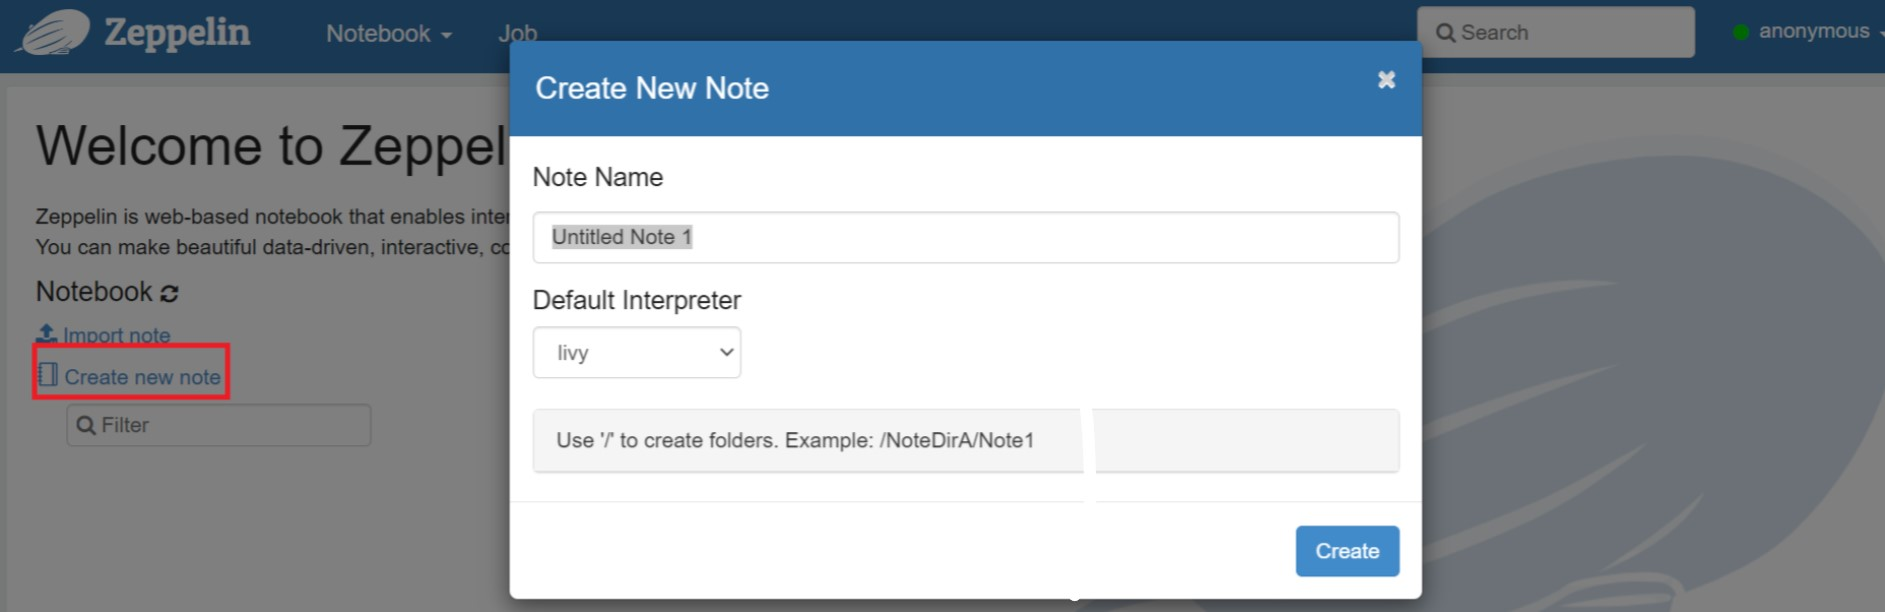
建立新的筆記本。 從頁首窗格中,流覽至 [筆記本] > [建立新記事]。 確定筆記本標頭會顯示連線狀態。 它表示右上角的綠色點。
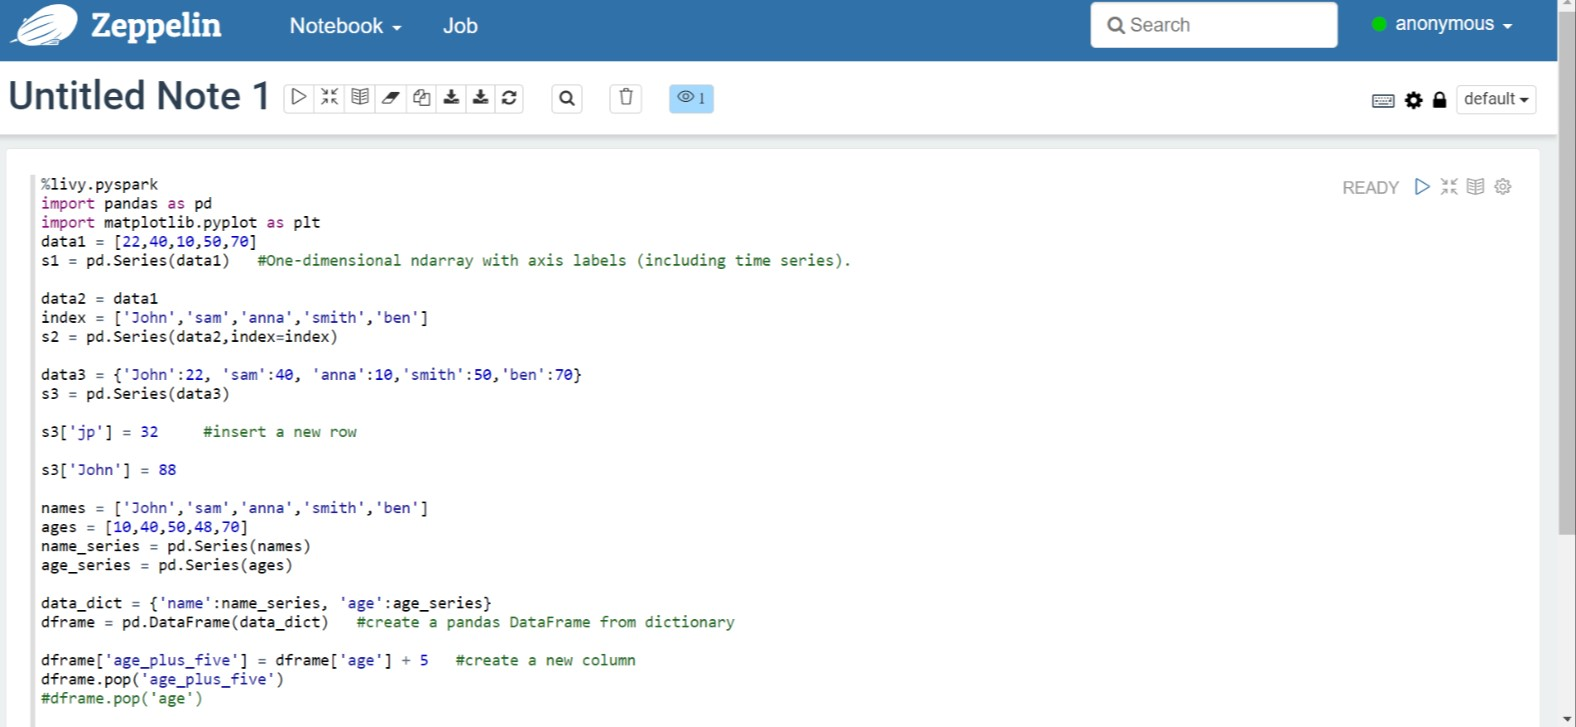
在 Zeppelin Notebook 中執行下列程序代碼:
%livy.pyspark
import pandas as pd
import matplotlib.pyplot as plt
data1 = [22,40,10,50,70]
s1 = pd.Series(data1)   #One-dimensional ndarray with axis labels (including time series).

data2 = data1
index = ['John','sam','anna','smith','ben']
s2 = pd.Series(data2,index=index)

data3 = {'John':22, 'sam':40, 'anna':10,'smith':50,'ben':70}
s3 = pd.Series(data3)

s3['jp'] = 32     #insert a new row

s3['John'] = 88

names = ['John','sam','anna','smith','ben']
ages = [10,40,50,48,70]
name_series = pd.Series(names)
age_series = pd.Series(ages)

data_dict = {'name':name_series, 'age':age_series}
dframe = pd.DataFrame(data_dict)   #create a pandas DataFrame from dictionary

dframe['age_plus_five'] = dframe['age'] + 5   #create a new column
dframe.pop('age_plus_five')
#dframe.pop('age')

salary = [1000,6000,4000,8000,10000]
salary_series = pd.Series(salary)
new_data_dict = {'name':name_series, 'age':age_series,'salary':salary_series}
new_dframe = pd.DataFrame(new_data_dict)
new_dframe['average_salary'] = new_dframe['age']*90

new_dframe.index = new_dframe['name']
print(new_dframe.loc['sam'])
選取 [播放] 按鈕以執行段落的代碼片段。 段落右上角的狀態應該從 READY、PENDING、RUNNING 到 FINISHED 進行。 輸出會顯示在相同段落底部。 螢幕快照看起來像下圖:
輸出:


使用Spark提交作業
使用下列命令 『#vim samplefile.py』 建立檔案
此命令會開啟 vim 檔案
將下列程式代碼貼到 vim 檔案中
import pandas as pd
import matplotlib.pyplot as plt

From pyspark.sql import SparkSession
Spark = SparkSession.builder.master('yarn').appName('SparkSampleCode').getOrCreate()
# Initialize spark context
data1 = [22,40,10,50,70]
s1 = pd.Series(data1)   #One-dimensional ndarray with axis labels (including time series).

data2 = data1
index = ['John','sam','anna','smith','ben']
s2 = pd.Series(data2,index=index)

data3 = {'John':22, 'sam':40, 'anna':10,'smith':50,'ben':70}
 s3 = pd.Series(data3)

s3['jp'] = 32     #insert a new row

s3['John'] = 88

names = ['John','sam','anna','smith','ben']
ages = [10,40,50,48,70]
name_series = pd.Series(names)
age_series = pd.Series(ages)

data_dict = {'name':name_series, 'age':age_series}
dframe = pd.DataFrame(data_dict)   #create a pandas DataFrame from dictionary

dframe['age_plus_five'] = dframe['age'] + 5   #create a new column
dframe.pop('age_plus_five')
#dframe.pop('age')

salary = [1000,6000,4000,8000,10000]
salary_series = pd.Series(salary)
new_data_dict = {'name':name_series, 'age':age_series,'salary':salary_series}
new_dframe = pd.DataFrame(new_data_dict)
new_dframe['average_salary'] = new_dframe['age']*90

new_dframe.index = new_dframe['name']
print(new_dframe.loc['sam'])
用以下方法儲存文件。
- 按 [逸出] 按鈕
- 輸入命令
:wq
執行下列命令以執行作業。
/spark-submit --master yarn --deploy-mode cluster <filepath>/samplefile.py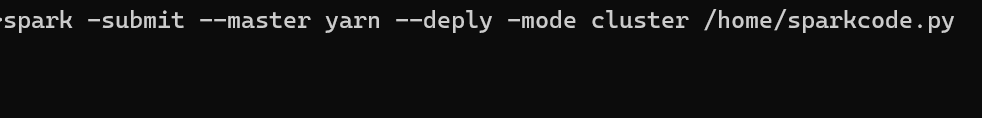

在 AKS 上的 HDInsight 中監視 Apache Spark 叢集上的查詢
Spark 歷程記錄 UI
在總覽標籤中點擊 [Spark 歷程記錄伺服器 UI]。

使用相同的應用程式識別碼,從UI選取最近的執行。
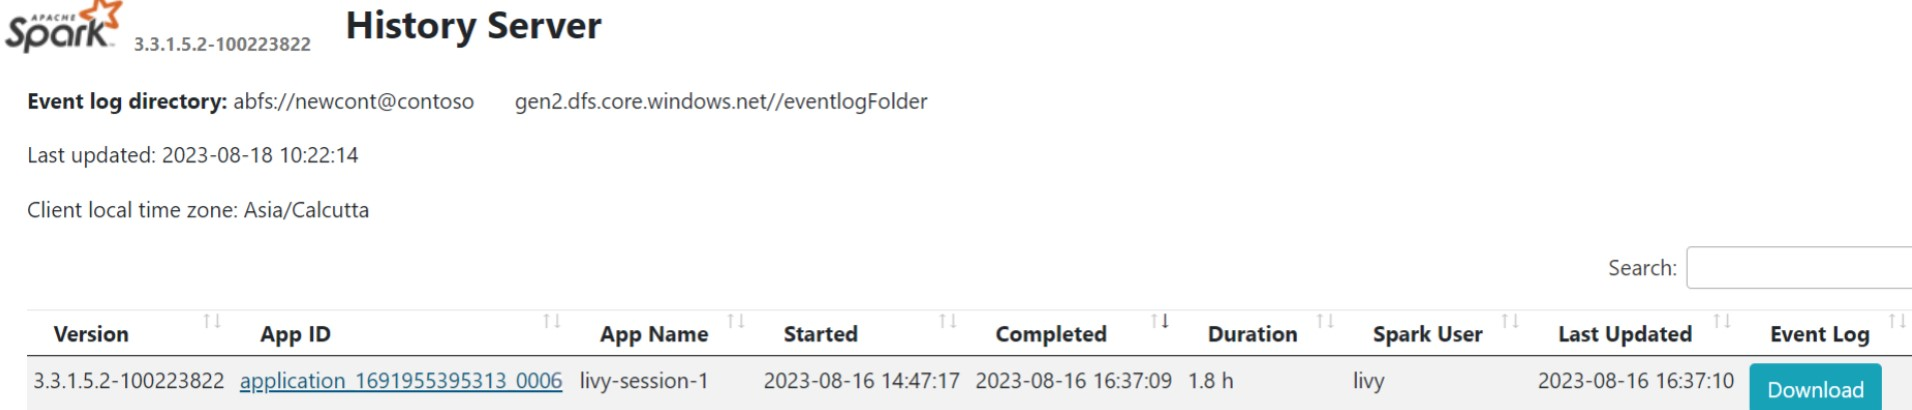
在 Spark 歷程記錄伺服器介面中檢視有向無環圖和作業階段。


Livy 會話 UI
若要開啟 Livy 工作階段 UI,請在瀏覽器中輸入下列命令
https://<CLUSTERNAME>.<CLUSTERPOOLNAME>.<REGION>.projecthilo.net/p/livy/ui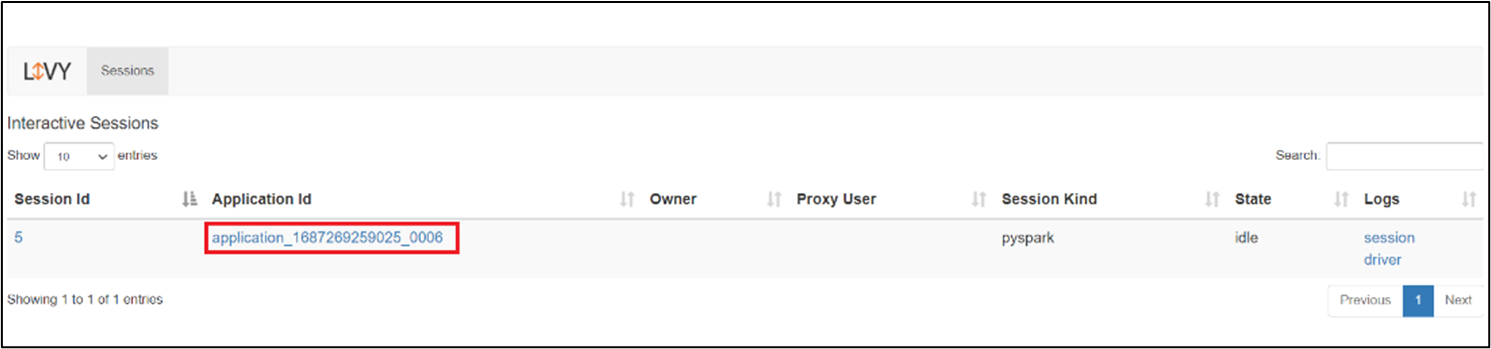
按兩下 [記錄] 底下的 [驅動程式] 選項,以檢視驅動程序記錄。

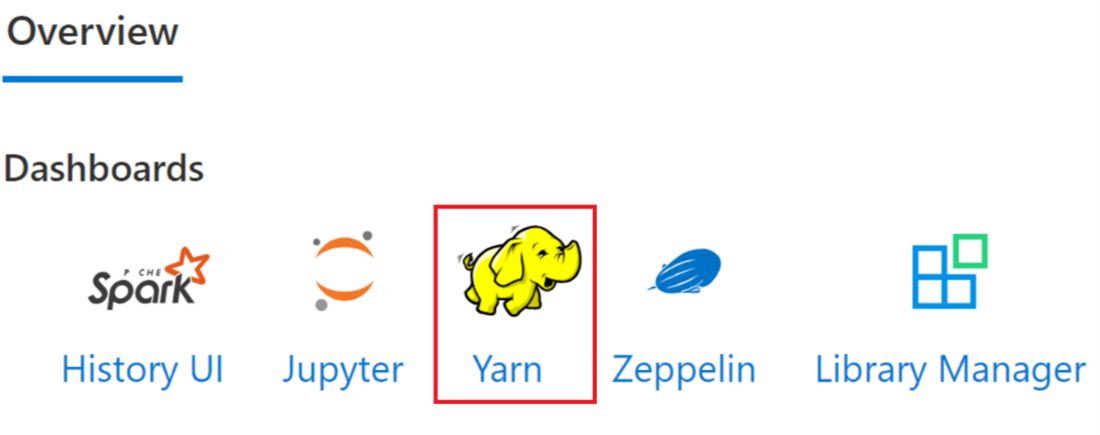
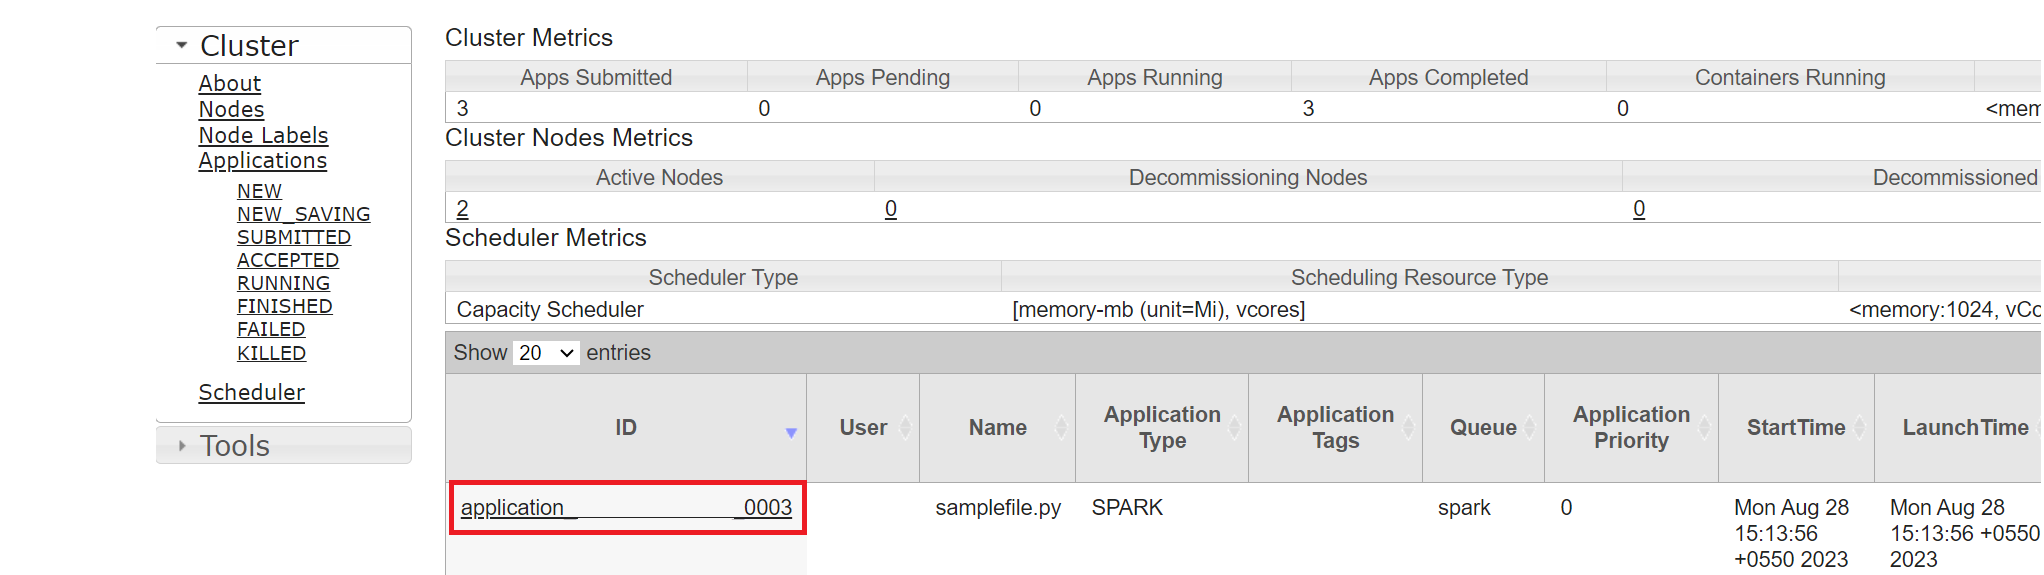
Yarn UI
從 [概觀] 索引標籤按兩下 [Yarn],然後開啟 Yarn UI。
您可以使用相同的應用程式識別碼來追蹤您最近執行的作業。
按兩下Yarn中的應用程式識別碼,以檢視作業的詳細記錄。


參考
- Apache、Apache Spark、Spark 和相關開放原始碼專案名稱 是 Apache Software Foundation (ASF) 商標。