Walkthrough: Debugging Rendering Errors Due to Shading
Applies to: ![]() Visual Studio
Visual Studio ![]() Visual Studio for Mac
Visual Studio for Mac
Note
This article applies to Visual Studio 2017. If you're looking for the latest Visual Studio documentation, see Visual Studio documentation. We recommend upgrading to the latest version of Visual Studio. Download it here
This walkthrough demonstrates how to use Visual Studio Graphics Diagnostics to investigate an object that is colored incorrectly because of a shader bug.
This walkthrough demonstrates how to:
Examine the graphics log document to identify pixels that show the problem.
Use the Graphics Pixel History window to examine the pixel state more closely.
Use the HLSL Debugger to examine the pixel and vertex shaders.
Scenario
Incorrect coloring on objects commonly occurs when a vertex shader passes a pixel shader incorrect or incomplete information.
In this scenario, you recently added an object to your app. You also added a new vertex and pixel shaders to transform the object and give it a unique appearance. When you run the app during a test, the object is rendered in solid black. By using Graphics Diagnostics, you capture the problem to a graphics log so that you can debug the app. The problem looks like this image in the app:

Investigation
By using the Graphics Diagnostics tools, you can load the graphics log document to inspect the frames that were captured during the test.
To examine a frame in a graphics log
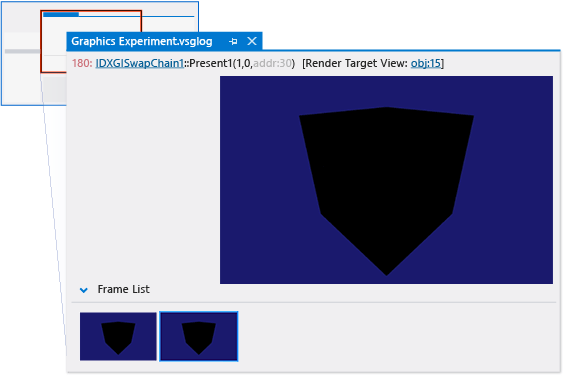
In Visual Studio, load a graphics log that has a frame that shows the missing model. A new graphic log document window appears in Visual Studio. In the top part of this window is the render target output of the selected frame. In the bottom part is the Frame List, which displays each captured frame as a thumbnail image.
In the Frame List, select a frame in which the object doesn't have the correct appearance. The render target is updated to reflect the selected frame. In this scenario, the graphics log document window looks like this image:

After you select a frame that demonstrates the problem, you can use the Graphics Pixel History window to diagnose it. The Graphics Pixel History window shows the primitives that could have had an effect on a specific pixel, their shaders, and what their effects on the render target were, in chronological order.
To examine a pixel
Open the Graphics Pixel History window. On the Graphics Diagnostics toolbar, choose Pixel History.
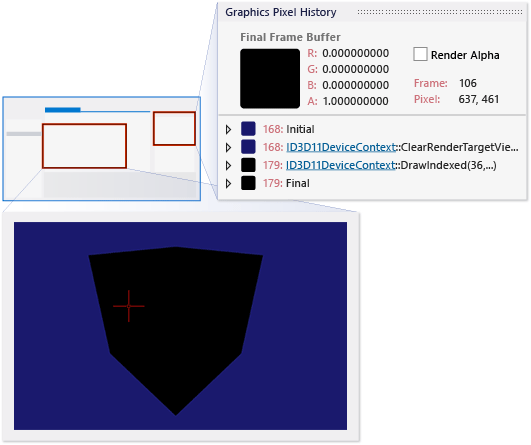
Select a pixel to examine. On the graphics log document window, select one of the pixels on the object that is incorrectly colored:

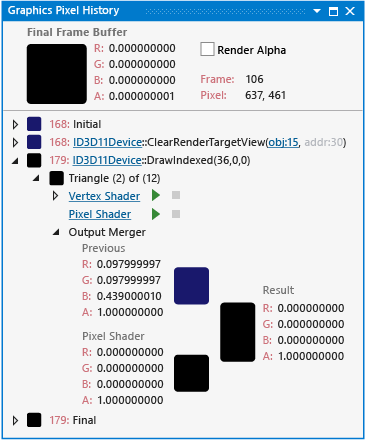
The Graphics Pixel History window is updated to reflect the selected pixel. In this scenario, the Graphics Pixel History window looks like this:

Notice that the pixel shader's result is fully opaque black (0, 0, 0, 1), and that the Output Merger combined this pixel shader with the Previous color of the pixel in such a way that the Result is also fully-opaque black.
After you examine a pixel that is incorrectly colored and discover the pixel shader output is not the expected color, you can use the HLSL Debugger to examine the pixel shader and find out what happened to the object's color. You can use the HLSL Debugger to examine the state of HLSL variables during execution, step through the HLSL code, and set breakpoints to help you diagnose the problem.
To examine the pixel shader
Start debugging the pixel shader. In the Graphics Pixel History window, under the object's primitive, next to Pixel Shader, choose the Start Debugging button.
In this scenario, because the pixel shader just passes the color through from the vertex shader, it's easy to observe that the pixel shader is not the source of the problem.
Rest the pointer on
input.color. Notice that its value is fully-opaque black (0, 0, 0, 1).
In this scenario, the examination reveals that the incorrect color is probably the result of a vertex shader that does not provide the right color information for the pixel shader to operate on.
After you've determined that the vertex shader is probably not providing the right information to the pixel shader, the next step is to examine the vertex shader.
To examine the vertex shader
Start debugging the vertex shader. In the Graphics Pixel History window, under the object's primitive, next to Vertex Shader, choose the Start Debugging button.
Locate the vertex shader's output structure—this is the input to the pixel shader. In this scenario, the name of this structure is
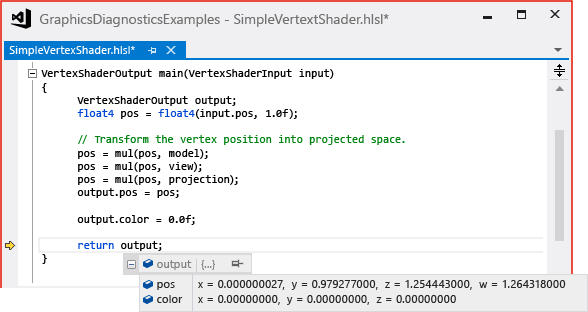
output. Examine the vertex shader code and notice that thecolormember of theoutputstructure has been explicitly set to fully-opaque black, perhaps as a result of someone's debugging efforts.Confirm that the color member is never copied from the input structure. Because the value of
output.coloris set to fully-opaque black just before theoutputstructure is returned, it's a good idea to make sure that the value ofoutputwasn't correctly initialized on a previous line. Step through the vertex shader code until you reach the line that setsoutput.colorto black while you watch the value ofoutput.color. Notice that the value ofoutput.colorisn't initialized until it's set to black. This confirms that the line of code that setsoutput.colorto black should be modified, rather than deleted.
After you determine that the cause of the rendering issue is that the vertex shader does not provide the correct color value to the pixel shader, you can use this information to fix the problem. In this scenario, you can fix it by changing the following code in the vertex shader
output.color = float3(0.0f, 0.0f, 0.0f);
to
output.color = input.color;
This code just passes the vertex color through from the object's vertices unmodified—more complex vertex shaders could modify the color before passing it through. The corrected vertex shader code should resemble this:

After you fix the code, rebuild it and run the app again to discover that the rendering issue is solved.
