這很重要
Azure Data Studio 於 2026 年 2 月 28 日正式退休。 您應該移轉至 Visual Studio Code。 欲了解更多資訊,請參閱 「Azure Data Studio 發生了什麼事」。
Kqlmagic 是可在 Azure Data Studio 筆記本 中擴充 Python 核心功能的命令。 您可結合 Python 和 Kusto 查詢語言 (KQL),使用整合了 render 命令的豐富 Plotly 程式庫來查詢資料,並視覺化資料。 Kqlmagic 可在同一個位置提供筆記本、資料分析和豐富 Python 功能的優點。 Kqlmagic 支援的資料來源包括 Azure 資料總管 、 Application Insights 及 Azure 監視器記錄 。
本文說明如何使用 Azure 資料總管叢集的 Kqlmagic 延伸模組、Application Insights 記錄和 Azure 監視器記錄,以在 Azure Data Studio 中建立並執行筆記本。
先決條件
在筆記本中安裝及設定 Kqlmagic
本節中的步驟都會在 Azure Data Studio 筆記本中執行。
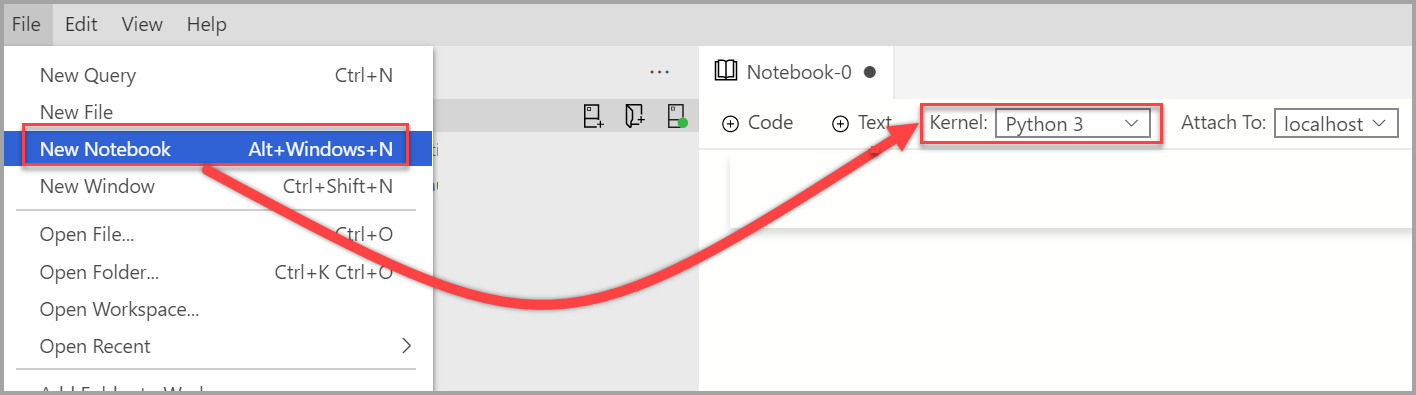
建立新的筆記本,並將核心變更為 Python 3。
當您的 Python 套件需要更新時,系統會提示您升級套件。
![結果 [是] 的螢幕擷取畫面。](media/notebooks-kqlmagic/install-python-yes.png)
安裝 Kqlmagic:
import sys
!{sys.executable} -m pip install Kqlmagic --no-cache-dir --upgrade
確認它是否已安裝:
import sys
!{sys.executable} -m pip list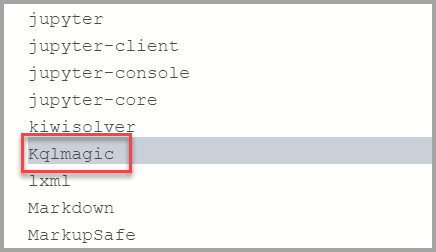
載入 Kqlmagic:
%reload_ext Kqlmagic備註
如果此步驟失敗,請關閉檔案並重新開啟。
![[載入 Kqlmagic 延伸模組] 的螢幕擷取畫面。](media/notebooks-kqlmagic/install-load-kql-magic-ext.png)
您可以瀏覽說明文件或檢查版本來測試Kqlmagic是否正確載入。
%kql --help "help"備註
如果
Samples@help要求輸入密碼,則可將其保留空白,然後按 Enter。![[說明] 的螢幕擷取畫面。](media/notebooks-kqlmagic/install-help.png)
若要查看安裝的 Kqlmagic 版本,請執行下列命令。
%kql --version
搭配 Azure 資料總管叢集的 Kqlmagic
本節說明如何使用 Kqlmagic 搭配 Azure 資料總管叢集執行資料分析。
載入及驗證適用於 Azure 資料總管的 Kqlmagic
備註
當每次在 Azure Data Studio 中建立新筆記本時,都必須載入 Kqlmagic 延伸模組。
驗證核心已設為 Python3。
![[核心變更] 的螢幕擷取畫面。](media/notebooks-kqlmagic/change-kernel.png)
載入 Kqlmagic:
%reload_ext Kqlmagic
連線至叢集並進行驗證:
%kql azureDataExplorer://code;cluster='help';database='Samples'備註
如果您使用自己的 ADX 叢集,則必須在連接字串中包含該區域,如下所示:
%kql azuredataexplorer://code;cluster='mycluster.westus';database='mykustodb'請使用裝置登入來進行驗證。 從輸出複製程式碼,然後選取 [驗證],瀏覽器將會開啟,請在其中貼上程式碼。 成功驗證後,您可回到 Azure Data Studio 以繼續進行指令碼的其餘部分。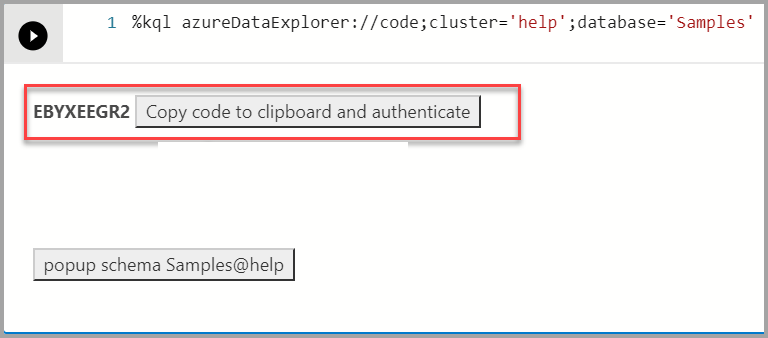
針對 Azure 資料總管進行查詢與視覺化
使用 render 運算子查詢資料,並使用 Plotly 程式庫將資料視覺化。 此查詢與視覺效果會提供使用原生 KQL 的整合式體驗。
依照州和頻率來分析前 10 大風暴事件。
%kql StormEvents | summarize count() by State | sort by count_ | limit 10若熟悉 Kusto 查詢語言 (KQL),則可在
%kql後面鍵入查詢。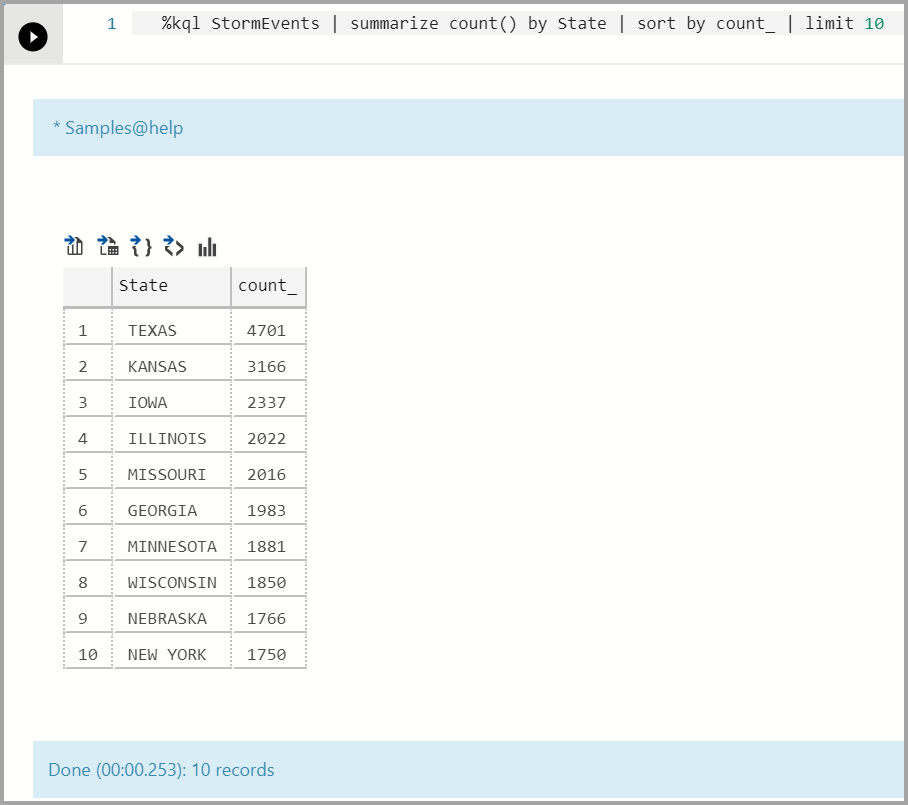
將時間軸圖表視覺化:
%kql StormEvents \
| summarize event_count=count() by bin(StartTime, 1d) \
| render timechart title= 'Daily Storm Events'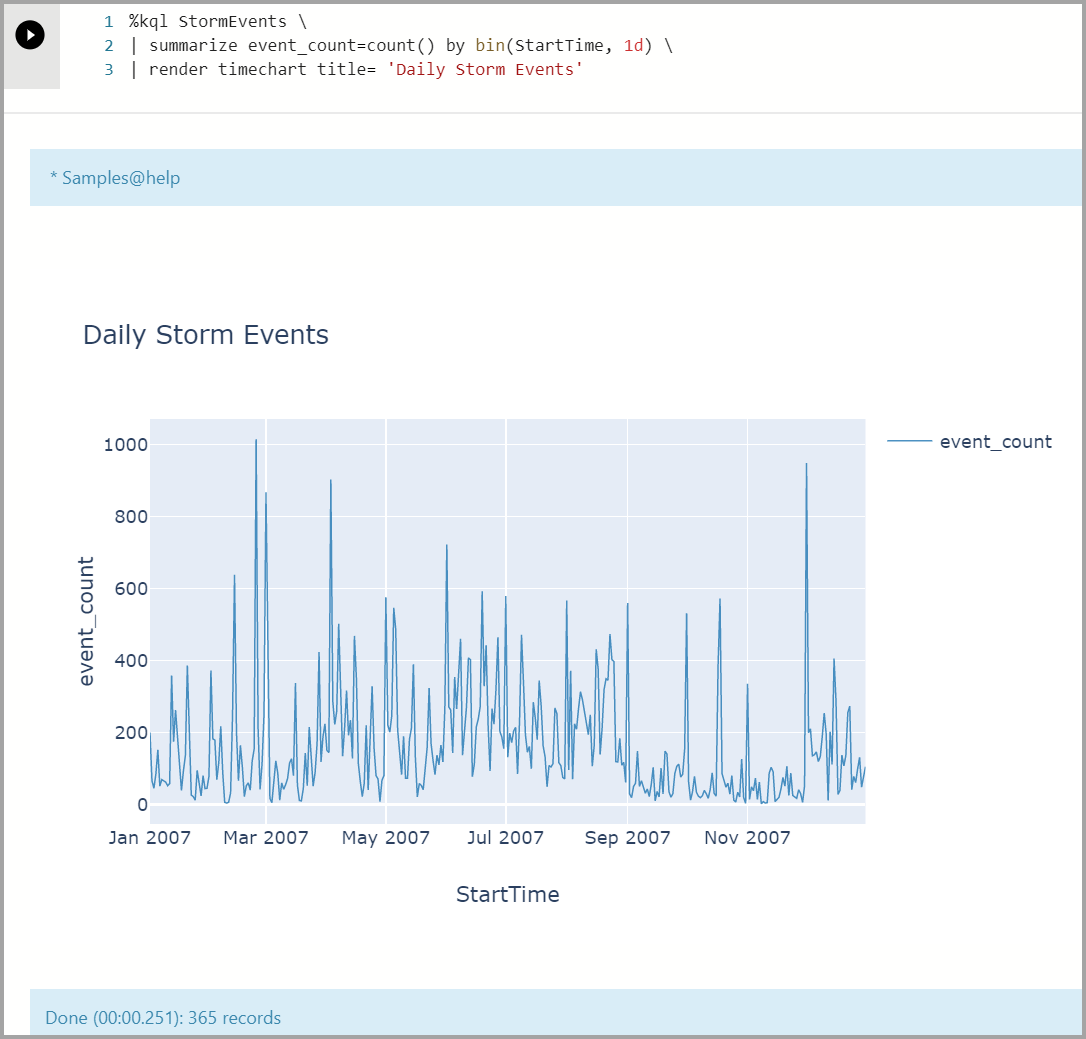
使用
%%kql的多行查詢範例。%%kql StormEvents | summarize count() by State | sort by count_ | limit 10 | render columnchart title='Top 10 States by Storm Event count'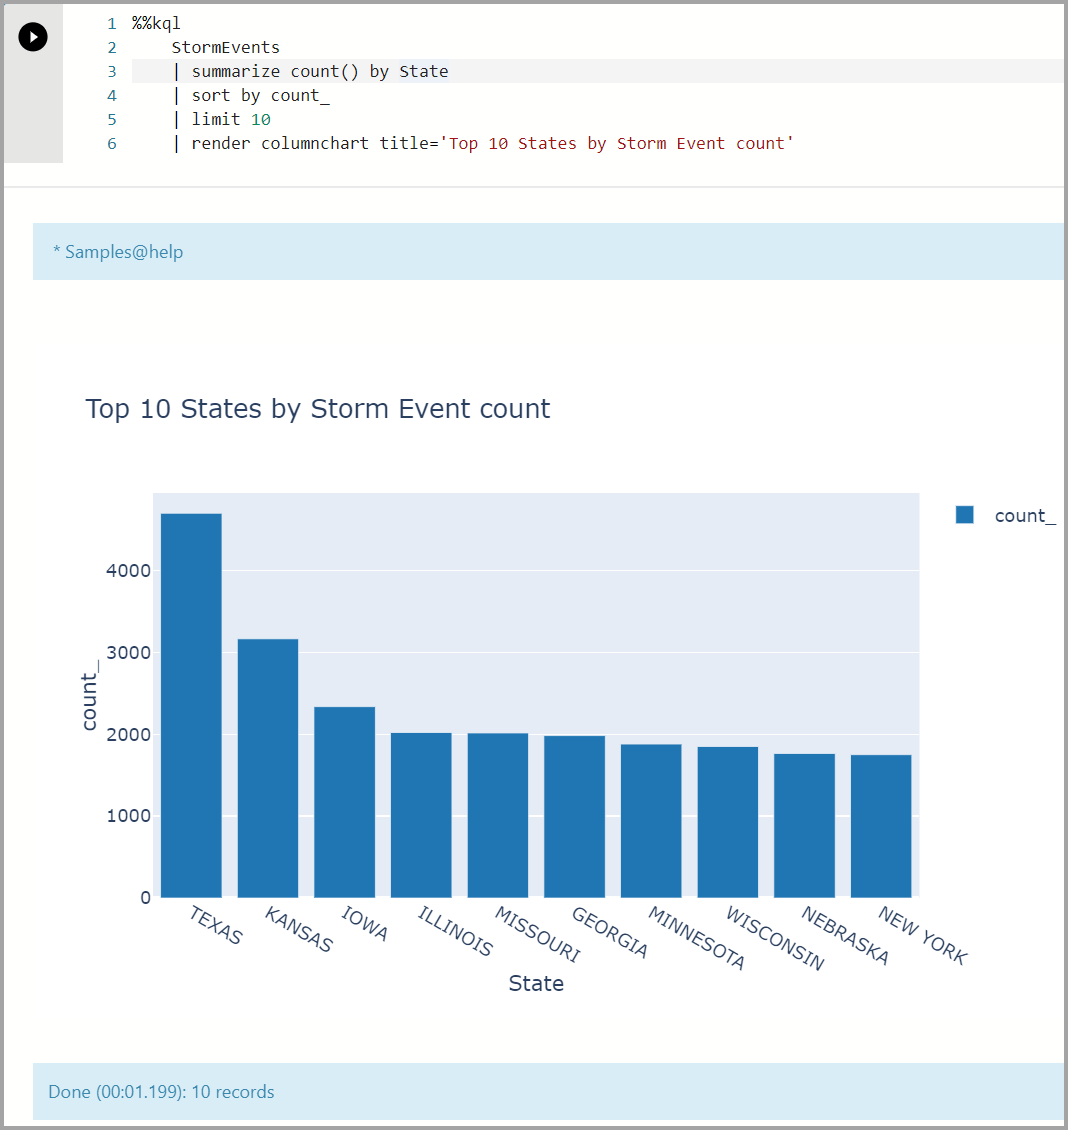
Kqlmagic 搭配 Application Insights
載入及認證用於 Application Insights 的 Kqlmagic
驗證核心已設為 Python3。
載入 Kqlmagic:
%reload_ext Kqlmagic
備註
當每次在 Azure Data Studio 中建立新筆記本時,都必須載入 Kqlmagic 延伸模組。
連線並進行驗證。
首先,您必須為 Application Insights 資源產生 API 金鑰。 然後,使用應用程式識別碼和 API 金鑰來從筆記本連線至 Application Insights。
%kql appinsights://appid='DEMO_APP';appkey='DEMO_KEY'
針對 Application Insights 進行查詢與視覺化
使用 render 運算子查詢資料,並使用 Plotly 程式庫將資料視覺化。 此查詢與視覺效果會提供使用原生 KQL 的整合式體驗。
顯示頁面瀏覽量
%%kql
pageViews
| limit 10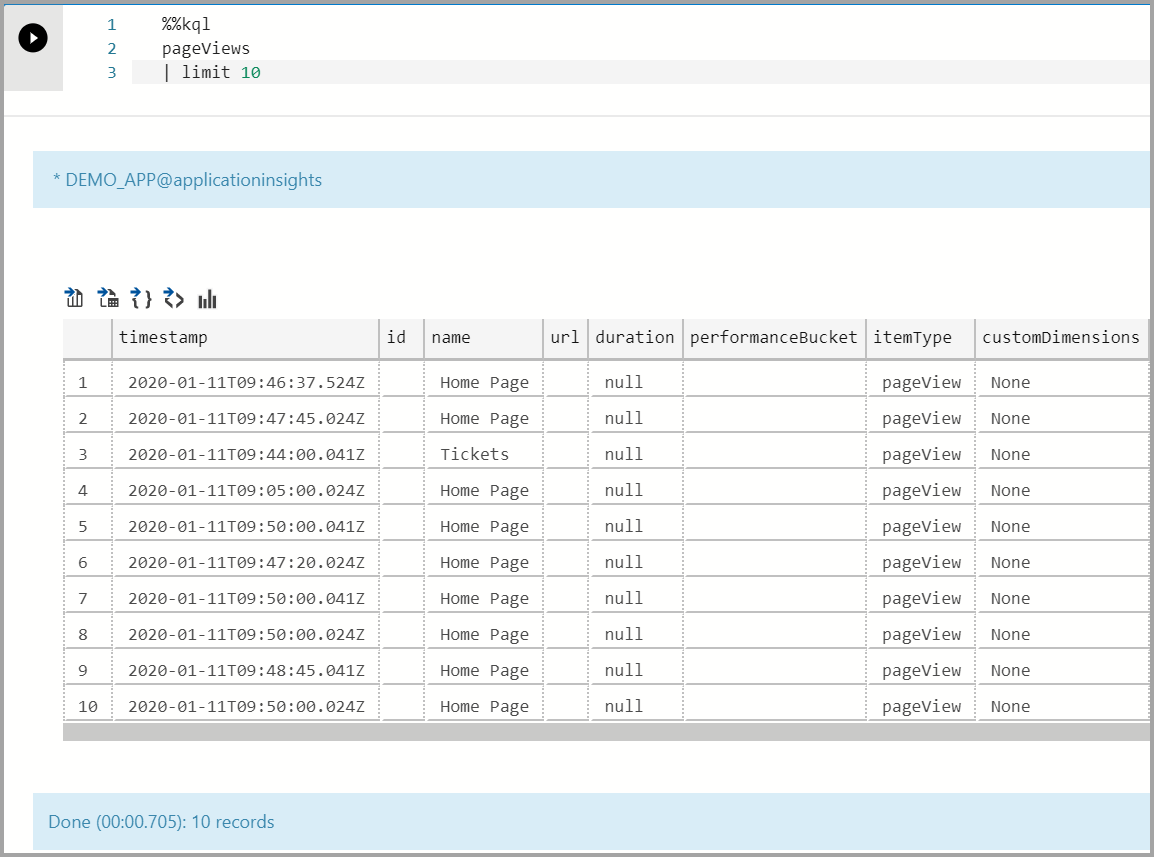
備註
使用滑鼠拖曳圖表的某個區域,以放大特定日期。
在時間軸圖表中顯示頁面檢視:
%%kql
pageViews
| summarize event_count=count() by name, bin(timestamp, 1d)
| render timechart title= 'Daily Page Views'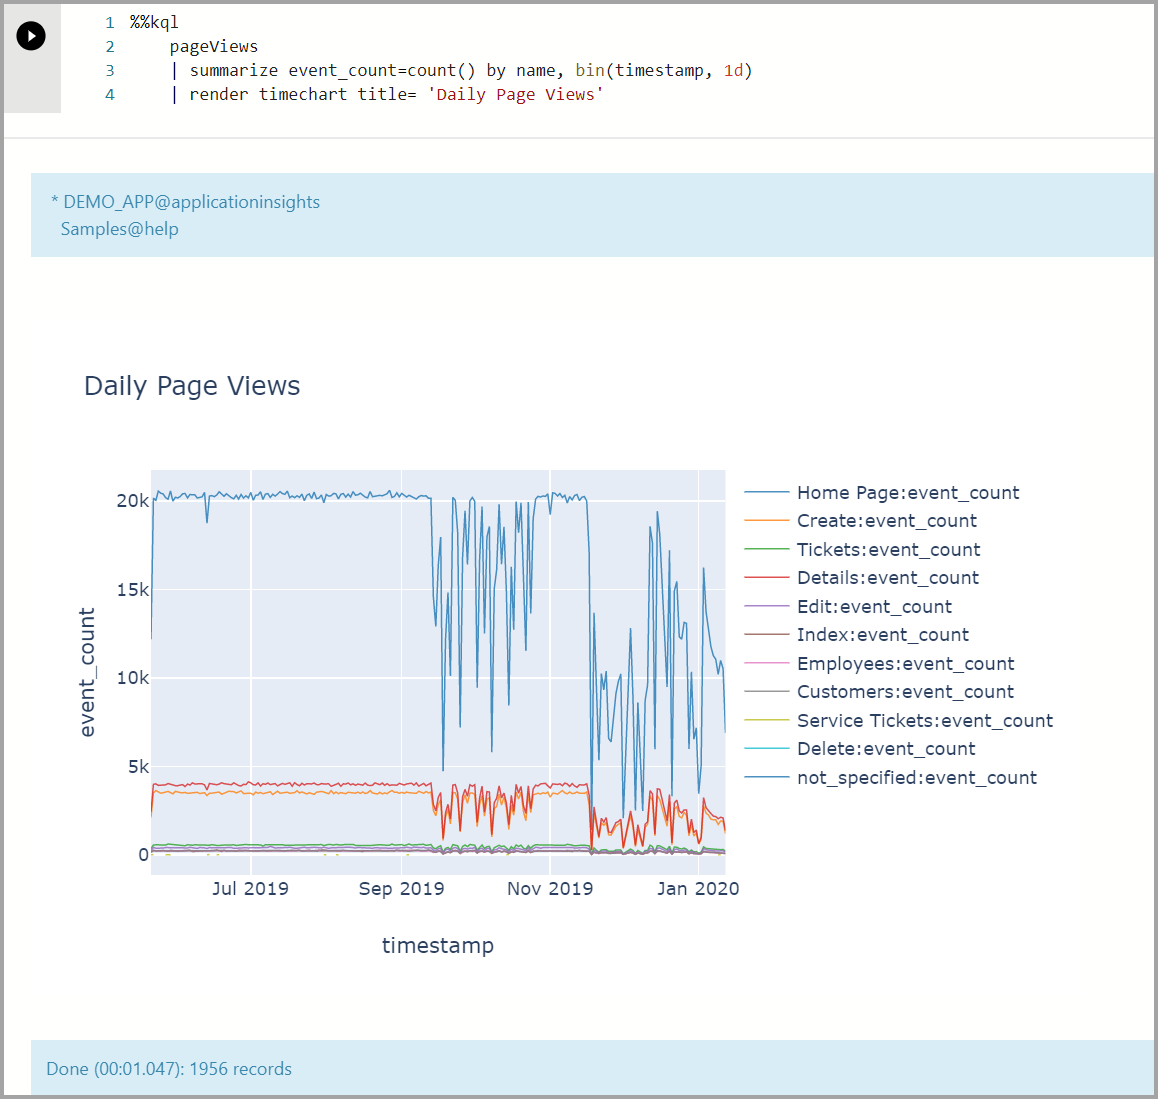
Kqlmagic 搭配 Azure 監視器記錄
載入及驗證適用於 Azure Monitor 日誌的 Kqlmagic
驗證核心已設為 Python3。
載入 Kqlmagic:
%reload_ext Kqlmagic
備註
當每次在 Azure Data Studio 中建立新筆記本時,都必須載入 Kqlmagic 延伸模組。
連線並進行驗證:
%kql loganalytics://workspace='DEMO_WORKSPACE';appkey='DEMO_KEY';alias='myworkspace'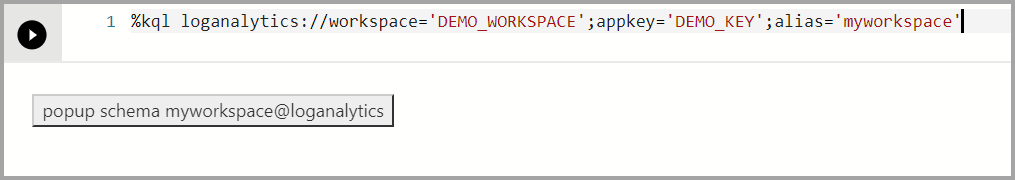
針對 Azure 監視器進行查詢與視覺化
使用 render 運算子查詢資料,並使用 Plotly 程式庫將資料視覺化。 此查詢與視覺效果會提供使用原生 KQL 的整合式體驗。
檢視時間軸圖表:
%%kql
KubeNodeInventory
| summarize event_count=count() by Status, bin(TimeGenerated, 1d)
| render timechart title= 'Daily Kubernetes Nodes'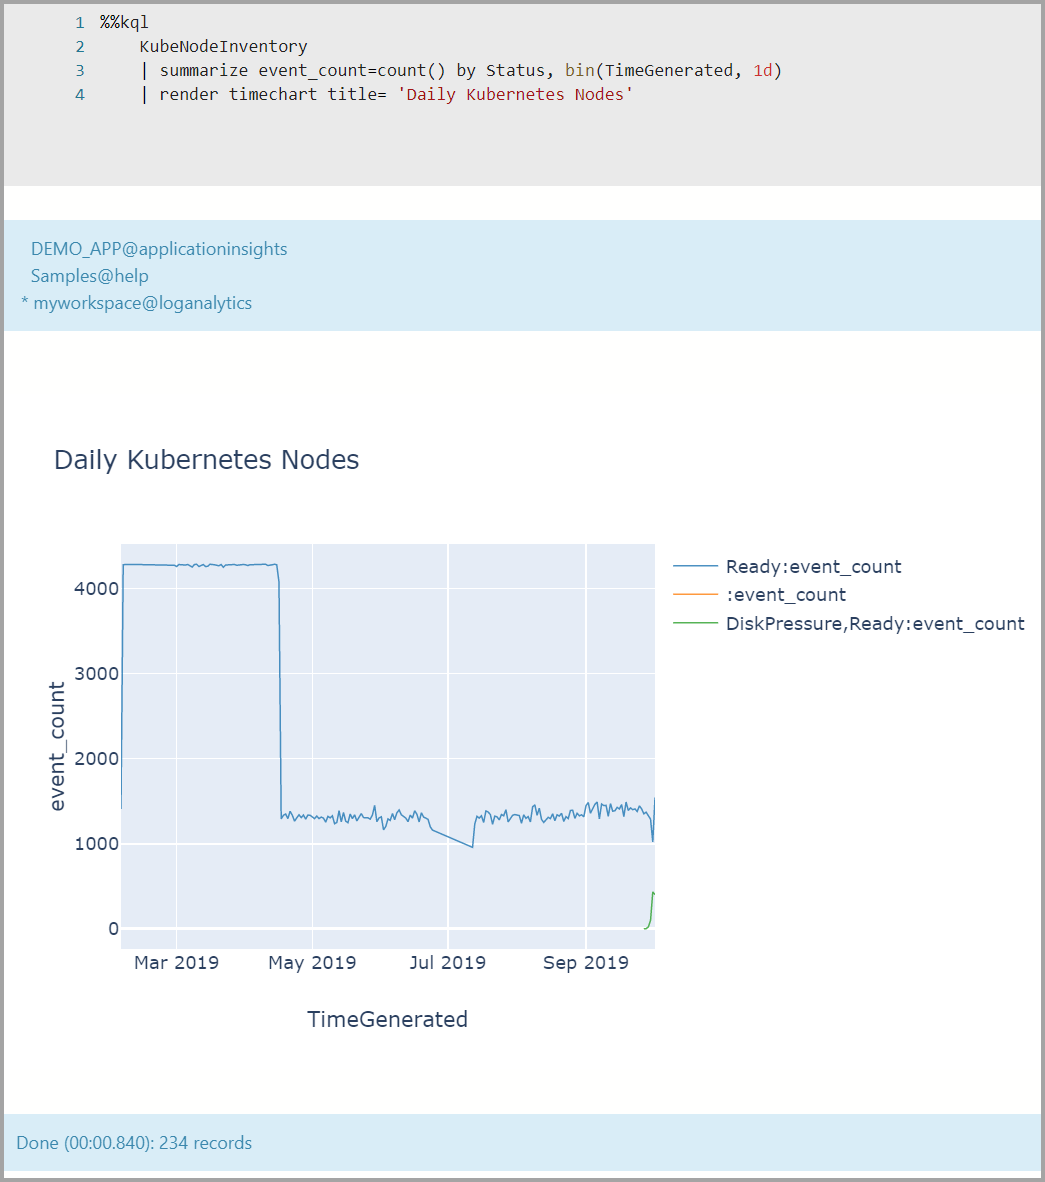
後續步驟
深入了解筆記本和 Kqlmagic:
- 適用於 Azure Data Studio 的 Kusto (KQL) 延伸模組 (預覽)
- 建立與執行 Kusto (KQL) 筆記本 (預覽)
- 使用 Jupyter Notebook 和 Kqlmagic 延伸模組來分析 Azure 資料總管中的資料 (機器翻譯)
- Jupyter Notebook 和 Jupyter 實驗室的延伸模組 (Magic),其可在搭配 Kusto、Application Insights 和 LogAnalytics 資料使用時提供筆記本體驗。
- Kqlmagic
- 如何在 Azure Data Studio 中使用筆記本