適用於:SQL Server
Azure SQL Database
Azure SQL Managed Instance
Microsoft Fabric 中的 SQL 資料庫
本文描述如何使用 Python 套件 pandas'.hist() 來繪製資料。 SQL Server 資料庫是用來可視化具有連續、非重疊值之直方圖數據間隔的來源。
Prerequisites
請參閱 SQL Server Management Studio,以將範例資料庫還原到 Azure SQL 受控執行個體。
Azure Data Studio。 若要安裝,請參閱 Azure Data Studio。
請參閱 還原範例資料庫,以取得本文中所使用的範例資料。
驗證還原的資料庫
您可以藉由查詢 Person.CountryRegion 資料表來確認還原的資料庫是否存在:
USE AdventureWorksDW;
SELECT * FROM Person.CountryRegion;
安裝 Python 套件
安裝下列 Python 套件:
pyodbcpandassqlalchemymatplotlib
若要安裝這些套件:
- 在 Azure Data Studio 筆記本中,選取 [管理套件]。
- 在 [管理套件] 窗格中,選取 [新增] 索引標籤。
- 針對下列每個封裝,輸入封裝名稱,選取 [搜尋],然後選取 [安裝]。
繪製直方圖
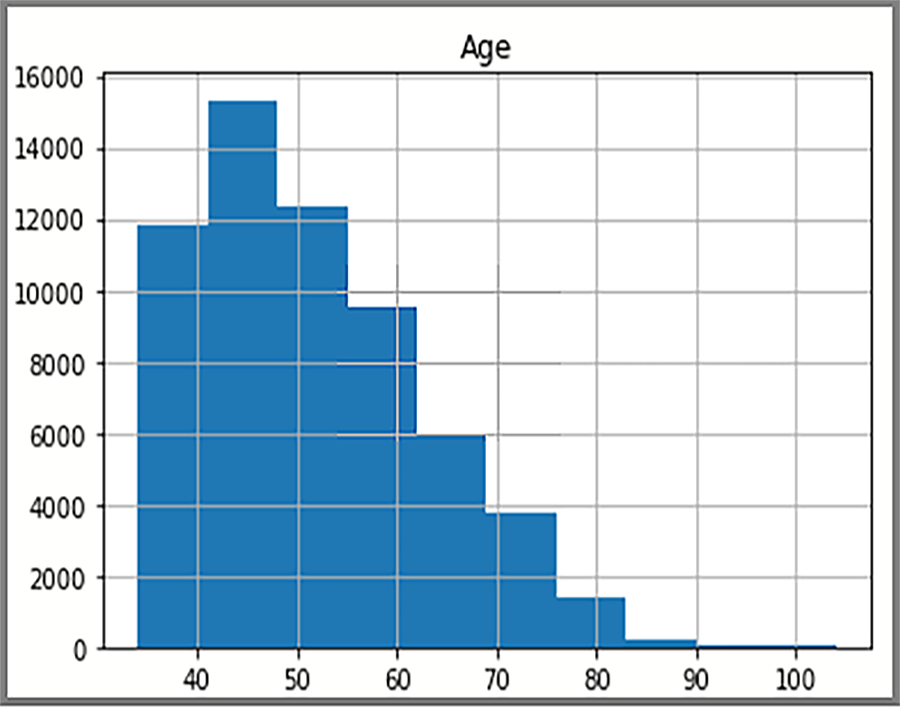
長條圖中顯示的分散式資料是以 AdventureWorksDW2025 的 SQL 查詢為基礎。 長條圖會將資料及資料值的頻率視覺化。
編輯連接字串變數: server、 database、 username和 password ,以連線到 SQL Server 資料庫。
建立新的筆記本:
在 Azure Data Studio 中,選取 [檔案],然後選取 [新增筆記本]。
在筆記本中,選取核心 [Python3],然後選取 [+程式碼]。
將程式代碼貼到筆記本中。 選取 [全部執行]。
import pyodbc
import pandas as pd
import matplotlib
import sqlalchemy

from sqlalchemy import create_engine

matplotlib.use('TkAgg', force=True)
from matplotlib import pyplot as plt

# Some other example server values are
# server = 'localhost\sqlexpress' # for a named instance
# server = 'myserver,port' # to specify an alternate port
server = 'servername'
database = 'AdventureWorksDW2022'
username = 'yourusername'
password = 'databasename'

url = 'mssql+pyodbc://{user}:{passwd}@{host}:{port}/{db}?driver=SQL+Server'.format(user=username, passwd=password, host=server, port=port, db=database)
engine = create_engine(url)

sql = "SELECT DATEDIFF(year, c.BirthDate, GETDATE()) AS Age FROM [dbo].[FactInternetSales] s INNER JOIN dbo.DimCustomer c ON s.CustomerKey = c.CustomerKey"

df = pd.read_sql(sql, engine)
df.hist(bins=50)

plt.show()
顯示畫面會顯示 FactInternetSales 資料表中客戶的年齡分佈。
