教學課程:使用 SQL 機器學習在 R 中建置群集模型
適用於:![]() SQL Server 2016 (13.x) 和更新版本
SQL Server 2016 (13.x) 和更新版本![]() Azure SQL 受控執行個體
Azure SQL 受控執行個體
在這個教學課程系列的第三部分 (總共四個部分) 中,您將在 R 中建立一個 K-Means 模型以執行群集。 在本系列的下一部分中,您將使用 SQL Server 機器學習服務在資料庫中部署此模型,或在巨量資料叢集上進行此部署。
在這個教學課程系列的第三部分 (總共四個部分) 中,您將在 R 中建立一個 K-Means 模型以執行群集。 在本系列的下一部分中,您將使用 SQL Server 機器學習服務在資料庫中部署此模型。
在這個教學課程系列的第三部分 (總共四個部分) 中,您將在 R 中建立一個 K-Means 模型以執行群集。 在本系列的下一部分中,您將使用 SQL Server R Services 在資料庫中部署此模型。
在這個教學課程系列的第三部分 (總共四個部分) 中,您將在 R 中建立一個 K-Means 模型以執行群集。 在本系列的下一部分中,您將使用 Azure SQL 受控執行個體機器學習服務,在資料庫中部署此模型。
在本文中,您將學會如何:
- 為 K-Means 演算法定義叢集數目
- 執行叢集
- 分析結果
在第一部分中,您已安裝必要條件並還原範例資料庫。
在第二部分,您已了解如何準備資料庫中的資料,以執行叢集。
在第四部分中,您將了解如何在資料庫中建立預存程序,以根據新的資料在 R 中執行群集。
Prerequisites
定義叢集數目
若要為您的客戶資料進行叢集化,您將使用 K-Means 叢集演算法,這是對資料進行分組的最簡單、最廣為人知的方法之一。 您可以在 K-means 叢集演算法的完整指南中深入了解 K-Means。
此演算法接受兩個輸入:資料本身,以及預先定義的數字「k」代表要產生的叢集數目。 輸出為 k 個叢集,包含在叢集之間分割的輸入資料。
若要對要使用的演算法判斷其叢集數目,請使用「群組平方和」內的繪圖,並以擷取的叢集數目為依據。 要使用的適當叢集數目是在繪圖的折彎處或「肘線」處。
# Determine number of clusters by using a plot of the within groups sum of squares,
# by number of clusters extracted.
wss <- (nrow(customer_data) - 1) * sum(apply(customer_data, 2, var))
for (i in 2:20)
    wss[i] <- sum(kmeans(customer_data, centers = i)$withinss)
plot(1:20, wss, type = "b", xlab = "Number of Clusters", ylab = "Within groups sum of squares")
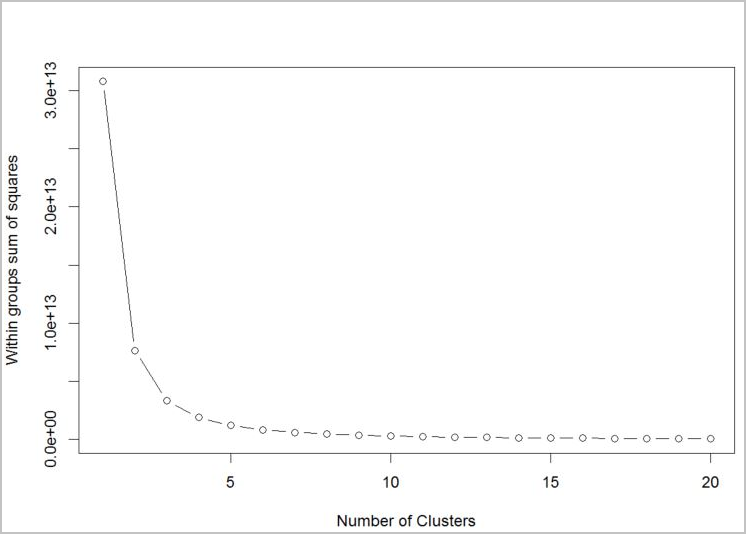
根據圖表,k = 4 看起來是理想的嘗試值。 k 值會將客戶分組成四個叢集。
執行叢集
在下列 R 指令碼中,您將使用函式 kmeans 來執行群集。
# Output table to hold the customer group mappings.
# Generate clusters using Kmeans and output key / cluster to a table
# called return_cluster

## create clustering model
clust <- kmeans(customer_data[,2:5],4)

## create clustering ouput for table
customer_cluster <- data.frame(cluster=clust$cluster,customer=customer_data$customer,orderRatio=customer_data$orderRatio,
        itemsRatio=customer_data$itemsRatio,monetaryRatio=customer_data$monetaryRatio,frequency=customer_data$frequency)

## write cluster output to DB table
sqlSave(ch, customer_cluster, tablename = "return_cluster")

# Read the customer returns cluster table from the database
customer_cluster_check <- sqlFetch(ch, "return_cluster")

head(customer_cluster_check)
分析結果
現在您已使用 K-Means 完成群集,下一個步驟是分析結果,並確認是否可以找到任何可採取動作的資訊。
#Look at the clustering details to analyze results
clust[-1]
$centers
   orderRatio itemsRatio monetaryRatio frequency
1 0.621835791  0.1701519    0.35510836  1.009025
2 0.074074074  0.0000000    0.05886575  2.363248
3 0.004807692  0.0000000    0.04618708  5.050481
4 0.000000000  0.0000000    0.00000000  0.000000

$totss
[1] 40191.83

$withinss
[1] 19867.791   215.714   660.784     0.000

$tot.withinss
[1] 20744.29

$betweenss
[1] 19447.54

$size
[1]  4543   702   416 31675

$iter
[1] 3

$ifault
[1] 0
使用第二部分中定義的變數以提供四種叢集平均值:
- orderRatio = 退貨訂單率 (部分退貨或全部退貨的訂單總數與訂單總數比較)
- itemsRatio = 退貨率 (退貨總數與購買項目數目比較)
- monetaryRatio = 退貨金額率 (退貨的貨幣金額總計與購買金額比較)
- frequency = 退貨頻率
使用 K-Means 的資料採礦經常需要進一步分析結果,並採取更多步驟,以深入了解每個叢集,但可以提供一些良好的潛在客戶。 您可以透過以下幾種方式來解譯這些結果:
- 叢集 1 (最大的叢集) 似乎是不活躍的客戶群組 (所有值皆為零)。
- 叢集 3 似乎是在退貨行為方面比較明顯的群組。
清除資源
如果您不打算繼續進行本教學課程,請刪除 tpcxbb_1gb 資料庫。
後續步驟
在本教學課程系列的第三部分中,您學到了如何:
- 為 K-Means 演算法定義叢集數目
- 執行叢集
- 分析結果
若要部署您已建立的機器學習模型,請遵循本教學課程系列的第四部分:
意見反應
即將登場:在 2024 年,我們將逐步淘汰 GitHub 問題作為內容的意見反應機制,並將它取代為新的意見反應系統。 如需詳細資訊,請參閱:https://aka.ms/ContentUserFeedback。
提交並檢視相關的意見反應