練習 - 在地圖上顯示空氣品質資料
在本單元中,您會從 API 取出空氣品質資料,並將其轉換成 GeoJSON。 然後,您可以使用地圖應用程式中的資料,作為位置資訊的泡泡圖層。
取得空氣品質資料
全球空氣品質指數會彙總全球各地的空氣品質資料。 您可以透過免費 API 取得資料,因為目前的空氣品質指數 (AQI) 會從世界各地的多個記錄站進行讀取。 您可以在您的應用程式中使用資料。
當您要求資料時,您有兩個選項。 您可以:
- 要求單一位置的資料,用來取得某城市或位置的最近讀數。
- 要求矩形 (使用矩形的東北和西南座標所定義) 內所有記錄站的資料。
地圖應根據地圖的可見區域,盡可能繪製最多的資料。 AQI 資料只能針對位於地圖可見區域的記錄站要求。 縮小要求會讓 API 呼叫速度更快,因為只會要求所需的資料。
AQI 資料格式
AQI 資料的 JSON 格式如下:
{
    "status": "ok",
    "data": [
        {
            "lat": 42.290094,
            "lon": -123.2321,
            "uid": 68,
            "aqi": "12",
            "station": {
                "name": "Applegate Valley, Oregon, USA",
                "time": "2020-04-21T17:00:00-07:00"
            }
        },
        ...
    ]
}
data 屬性包含全部所要求測量站的 JSON 物件陣列。 物件具有由經度、緯度和 AQI 量值定義的位置。 資料無法在地圖上以您收到的格式繪製。 您的應用程式必須先將資料轉換成 GeoJSON 特徵集合。
下列步驟概述將 AQI 資料轉換為特徵集合所採取的步驟。 稍後於此單元中,您會在程式碼中實作這些步驟。
若要將 AQI 資料轉換成 GeoJSON 特徵集合:
建立空白的特徵集合。
針對
data陣列中的每個項目,建立新的功能:特徵的幾何是
Point位置,其座標設定為lon經度和lat緯度。您可以更輕鬆地將資料表示為彩色的泡泡,而不是直接繪製 AQI 量測。 請將 AQI 度量轉換成 RGB 十六進位字串的色彩值。 然後,將已轉換的色彩值新增至特徵的
properties陣列。
以下是此範例中資料的 GeoJSON:
{
    "type": "FeatureCollection",
    "features": [{
            "type": "Feature",
            "geometry": {
                "type": "Point",
                "coordinates": [-123.2321, 42.290094]
            },
            "properties": {
                "color": "#009966"
            }
        }
    ]
}
取得 API 權杖
若要使用 WAQI API,請註冊 API 金鑰。 稍後,您會將金鑰新增至應用程式的環境變數。
若要取得 WAQI API 金鑰:
移至 WAQI 網站上的空氣品質開放資料平台權杖要求頁面。
輸入您的電子郵件地址和名稱。
檢閱並同意 API 使用方式服務條款。
選取送出。
檢查電子郵件收件匣中是否有來自 WAQI 網站的確認訊息。 在電子郵件訊息中,選取 [確認您的電子郵件地址] 連結。
確認電子郵件地址之後,系統會將您重新導向至顯示權杖的新網頁。 複製及儲存您的權杖。
權杖是您在稍後步驟中使用的 WAQI API 金鑰值。
更新應用程式以使用 API 權杖
當您擁有 WAQI API 權杖時,請將權杖金鑰值新增至您應用程式的環境變數:
在 Visual Studio Code 中,開啟應用程式程式碼資料夾中的 .env 檔案。
在 .env 檔案的結尾新增下列陳述式:
WAQI_API_KEY=<your waqi key>使用您的 WAQI API 金鑰值取代
<your waqi key>。將變更儲存至 .env 檔案。
在 Visual Studio Code 中,開啟 app.py 檔案。
在 app.py 程式碼中,尋找載入
MAP_KEY值的陳述式。 在該陳述式後面,新增下列陳述式以載入 WAQI API 金鑰。 程式碼會定義 API URL 的WAQI_API_KEY常數:# Load the World Air Quality Index key from the .env file. WAQI_API_KEY = os.environ["WAQI_API_KEY"] WAQI_API_URL = "https://api.waqi.info/map/bounds/?latlng={},{},{},{}&token={}"WAQI_API_URL會定義呼叫,以取得lon和lat座標所定義矩形區域的所有空氣品質讀數。將變更儲存至 app.py 檔案。
將資料來源新增至地圖
最後一個步驟是將資料來源新增至地圖,以呈現 AQI 資料。 Azure 地圖服務會使用資料來源來繪製圖層。 資料來源可以從 GeoJSON 特徵集合取得其資料。
在 Visual Studio Code 中,開啟應用程式的 templates 資料夾中的 home.html 檔案。
在此檔案中,尋找處理地圖
ready事件的陳述式。 此程式碼應該會出現在 46 到 52 行:// When the map is ready, center the map on the user's location. map.events.add('ready', function () { map.setCamera({ center: map_center, zoom: 5 }) })將此程式碼區段取代為下列陳述式,然後儲存檔案:
// When the map is ready, center the map on the user's location.
map.events.add('ready', function () {
    // Declare a data source for the AQI data.
    var datasource = new atlas.source.DataSource();
    map.sources.add(datasource);

    // Declare a function to update the AQI data.
    function updateAQIData(e) {
        // Get the current bounds on the screen.
        bounds = map.getCamera().bounds

        // Set the data source data to results of the AQI call.
        // This is a feature collection that contains the AQI measurements.
        fetch('./aqi?bounds=' + bounds)
            .then(res => {
                return res.json()
            }).then(response => {
                datasource.clear()
                datasource.setShapes(response)
            })
    }

    // Add a bubble layer.
    map.layers.add(new atlas.layer.BubbleLayer(datasource, null, {
        radius: 10,
        opacity: 0.5,
        strokeOpacity: 0,
        // Get the color from the color property.
        color: ['get', 'color']
    }));

    // Handle any events that change the bounds of the map.
    map.events.add('zoomend', updateAQIData)
    map.events.add('dragend', updateAQIData)
    map.events.add('pitchend', updateAQIData)

    map.setCamera({
        center: map_center,
        zoom: 5
    })
})
此資料來源用來建立在地圖上顯示圓形的泡泡圖層。 此圖層會使用幾何上的座標來針對功能集合中每項功能各顯示一個泡泡。 泡泡有固定大小和不透明度,但是色彩未固定。 相反地,
['get', 'color']程式碼會告訴地圖從名為color的特徵屬性載入色彩。updateAQIData函式新增至三個地圖事件,會在地圖縮放或移動或是繞 X 軸旋轉變更時引發。 每次使用者移動地圖時,就會呼叫此函式。 此函式會從地圖服務相機取得目前的界限,也就是說,可以在螢幕上看見地圖片段的西北和東南座標。 接著,函式會將這些界限傳遞給api路由的呼叫,並呼叫 Python 程式碼以載入 AQI 資料。 最後,此特徵集合會新增至資料來源。
載入空氣品質資料
Flask 應用程式將需要呼叫 API,以載入地圖可見部分的資料。
開啟 app.py 檔案。
將下列程式碼新增至檔案的底部:
def get_color(aqi):
    # Convert the AQI value to a color.
    if aqi <= 50: return "#009966"
    if aqi <= 100: return "#ffde33"
    if aqi <= 150: return "#ff9933"
    if aqi <= 200: return "#cc0033"
    if aqi <= 300: return "#660099"
    return "#7e0023"

def load_aqi_data(lon1, lat1, lon2, lat2):
    # Load the air quality data.
    url = WAQI_API_URL.format(lat1, lon1, lat2, lon2, WAQI_API_KEY)
    aqi_data = requests.get(url)

    # Create a GeoJSON feature collection from the data.
    feature_collection = {
        "type" : "FeatureCollection",
        "features" : []
    }

    for value in aqi_data.json()["data"]:
        # Filter out empty values.
        if value["aqi"] != "-":
            feature_collection["features"].append({
                "type" : "Feature",
                "properties" : {
                    "color" : get_color(int(value["aqi"]))
                },
                "geometry" : {
                    "type":"Point",
                    "coordinates":[value['lon'], value['lat']]
                }
                })

    return feature_collection

@app.route("/aqi", methods = ["GET"])
def get_aqi():
    # Get the bounds from the request.
    bounds = request.args["bounds"].split(",")

    # Load the AQI data and create the GeoJSON for the specified bounds.
    return json.dumps(load_aqi_data(bounds[0], bounds[1], bounds[2], bounds[3]))
儲存檔案。
此程式碼會在 Flask 應用程式內實作 API 呼叫,以從 API 針對一組特定的座標載入 AQI 資料。 AQI 資料接著會轉換成特徵集合,並以 JSON 字串傳回。 然後,您可以從網頁呼叫 API。
在地圖上顯示空氣品質資料
從 AQI 資料建立的特徵集合已準備好顯示在地圖上。
在 Visual Studio Code 中,請確定您的 app.py 檔案已開啟。 選取活動列中的 [執行] 圖示,以開啟 [執行] 檢視。 然後,選取綠色箭號以執行 Flask 應用程式,並在瀏覽器中開啟。
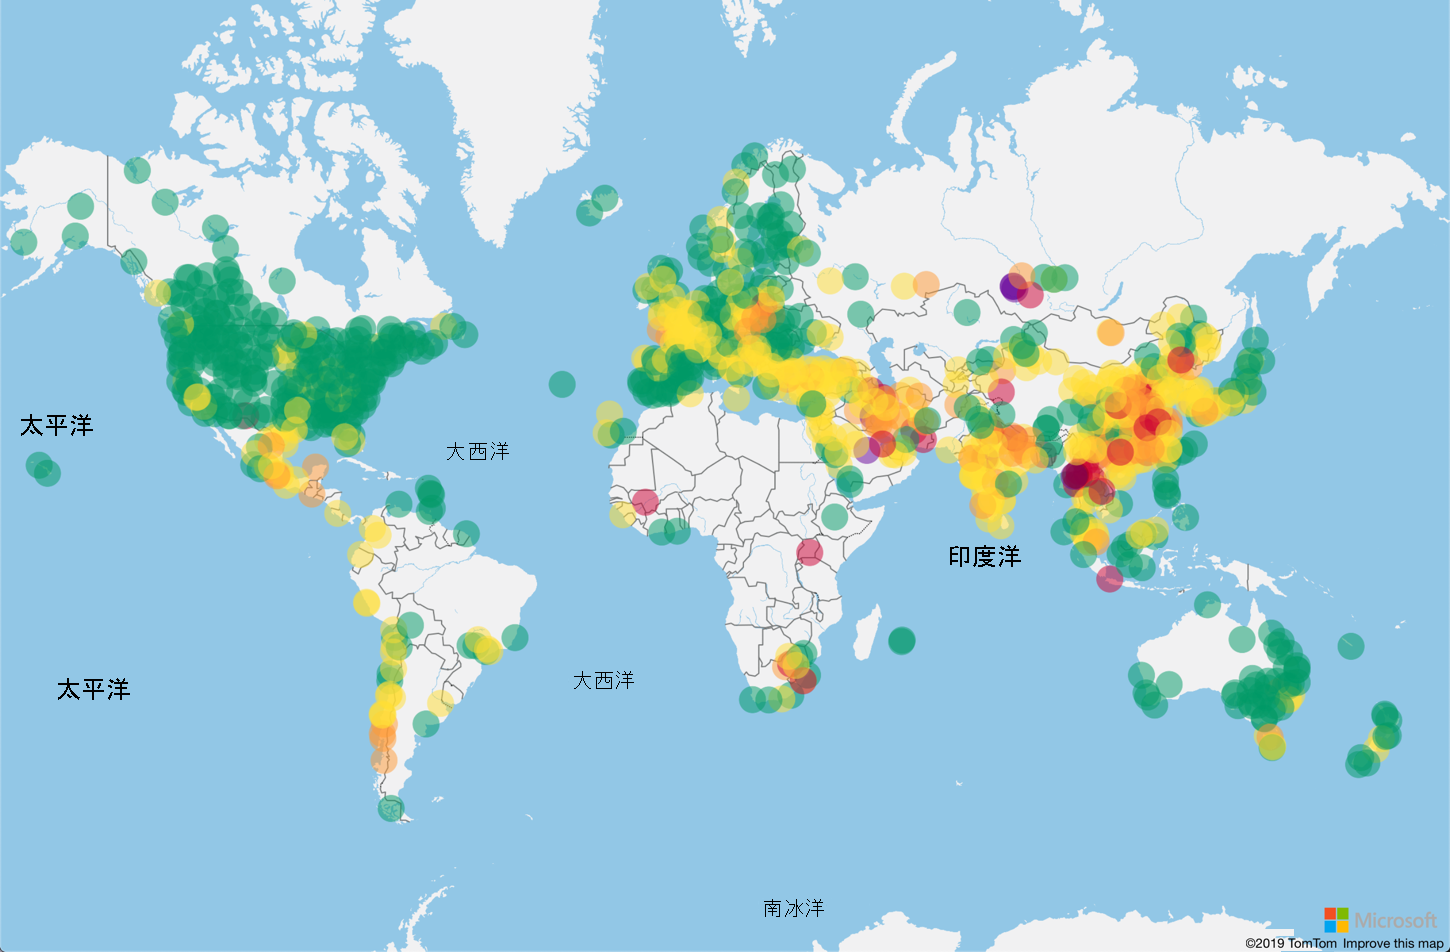
您應該會在顯示 WAQI 資料的地圖上看到彩色圓形 (泡泡):
請移動地圖,並看到泡泡更新以符合所要檢視的區域。
請看看不同的色彩,以查看空氣品質不良或有害的區域。 請想一下這些區域的空氣品質為何如此不良。 某些原因很明顯,例如在具有大量化石燃料燃燒發電廠或工廠的區域中。 有些原因則不明顯。 請尋找您附近的區域,並思考造成污染的原因。
