收集、查詢和視覺化健康狀態
若要精確地表示健康情況模型,您必須從系統收集各種資料集。 資料集包含來自應用程式元件和基礎 Azure 資源的記錄和效能計量。 務必將資料集之間的資料相互關聯,以建置系統健康情況的分層表示法。
檢測程式碼和基礎結構
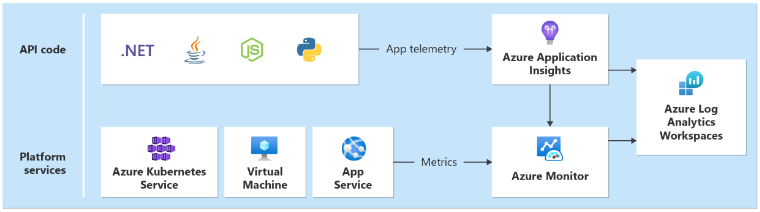
需要「統一的資料接收」,以確保在收集所有遙測的單一位置儲存和取得所有作業資料。 例如,當員工在其網頁瀏覽器中建立註解時,您可追蹤此作業,並查看通過目錄 API 對 Azure 事件中樞的要求。 從該處,背景處理器會挑選批注,並將其儲存在 Azure Cosmos DB 中。
Azure 監視器 Log Analytics 可作為核心的 Azure 原生統一資料接收器,以儲存和分析作業資料:
Application Insights 是所有應用程式元件的建議應用程式效能監視 (APM) 工具,可收集應用程式記錄、計量和追蹤。 Application Insights 會部署在每個區域中的工作區型組態中。
在範例應用程式中,Azure Functions 用於 Microsoft .NET 6 上的後端服務以進行原生整合。 由於後端應用程式已經存在,Contoso Shoes 只會在 Azure 中建立新的 Application Insights 資源,並在這兩個函式應用程式上設定
APPLICATIONINSIGHTS_CONNECTION_STRING設定。 Azure Functions 執行階段會自動註冊 Application Insights 記錄提供者,因此遙測會出現在 Azure 中,而不需額外的心力。 如需更自定義的ILogger記錄,您可以使用 介面。集中式資料集是任務關鍵性工作負載的反面模式。 每個區域都必須有其專用的 Log Analytics 工作區和 Application Insights 執行個體。 針對全域資源,建議使用個別的執行個體。 若要查看核心架構模式,請參閱 Azure 上任務關鍵性工作負載的架構模式。
每一層都應該將資料傳送至相同的 Log Analytics 工作區,讓分析和健康情況計算變得容易。
健康情況監視查詢
Log Analytics、Application Insights 和 Azure Data Explorer 全都會針對其查詢使用 Kusto 查詢語言 (KQL)。 您可使用 KQL 來建置查詢,並使用函式來擷取計量和計算健康情況分數。
如需計算健康狀態的個別服務,請參閱下列範例查詢。
目錄 API
下列範例示範目錄 API 查詢:
let _maxAge = 2d; // Include data only from the last two days
let _timespanStart = ago(_maxAge); // Start time for the time span
let _timespanEnd = now(-2m); // Account for ingestion lag by stripping the last 2m
// For time frame, compare the averages to the following threshold values
let Thresholds=datatable(MetricName: string, YellowThreshold: double, RedThreshold: double) [
    "failureCount", 10, 50, // Failed requests, anything non-200, allow a few more than 0 for user-caused errors like 404s
    "avgProcessingTime", 150, 500 // Average duration of the request, in ms
    ];
// Calculate average processing time for each request
let avgProcessingTime = AppRequests
| where AppRoleName startswith "CatalogService"
| where OperationName != "GET /health/liveness" // Liveness requests don't do any processing, including them would skew the results
| make-series Value = avg(DurationMs) default=0 on TimeGenerated from _timespanStart to _timespanEnd step 1m
| mv-expand TimeGenerated, Value
| extend TimeGenerated = todatetime(TimeGenerated), Value=toreal(Value), MetricName= 'avgProcessingTime';
// Calculate failed requests
let failureCount = AppRequests
| where AppRoleName startswith "CatalogService" // Liveness requests don't do any processing, including them would skew the results
| where OperationName != "GET /health/liveness"
| make-series Value=countif(Success != true) default=0 on TimeGenerated from _timespanStart to _timespanEnd step 1m
| mv-expand TimeGenerated, Value
| extend TimeGenerated = todatetime(TimeGenerated), Value=toreal(Value), MetricName= 'failureCount';
// Union all together and join with the thresholds
avgProcessingTime
| union failureCount
| lookup kind = inner Thresholds on MetricName
| extend IsYellow = iff(todouble(Value) > YellowThreshold and todouble(Value) < RedThreshold, 1, 0)
| extend IsRed = iff(todouble(Value) > RedThreshold, 1, 0)
| project-reorder TimeGenerated, MetricName, Value, IsYellow, IsRed, YellowThreshold, RedThreshold
| extend ComponentName="CatalogService"
Azure Key Vault
下列範例示範 Azure 金鑰保存庫查詢:
let _maxAge = 2d; // Include data only from the last two days
let _timespanStart = ago(_maxAge); // Start time for the time span
let _timespanEnd = now(-2m); // Account for ingestion lag by stripping the last 2m
// For time frame, compare the averages to the following threshold values
let Thresholds = datatable(MetricName: string, YellowThreshold: double, RedThreshold: double) [
    "failureCount", 3, 10 // Failure count on key vault requests
    ];
let failureStats = AzureDiagnostics
| where TimeGenerated > _timespanStart
| where ResourceProvider == "MICROSOFT.KEYVAULT"
// Ignore authentication operations that have a 401. This is normal when using Key Vault SDK. First an unauthenticated request is made, then the response is used for authentication
| where Category=="AuditEvent" and not (OperationName == "Authentication" and httpStatusCode_d == 401)
| where OperationName in ('SecretGet','SecretList','VaultGet') or '*' in ('SecretGet','SecretList','VaultGet')
// Exclude Not Found responses because these happen regularly during 'Terraform plan' operations, when Terraform checks for the existence of secrets
| where ResultSignature != "Not Found"
// Create ResultStatus with all the 'success' results bucketed as 'Success'
// Certain operations like StorageAccountAutoSyncKey have no ResultSignature; for now, also set to 'Success'
| extend ResultStatus = case ( ResultSignature == "", "Success",
                               ResultSignature == "OK", "Success",
                               ResultSignature == "Accepted", "Success",
                               ResultSignature);
failureStats
| make-series Value=countif(ResultStatus != "Success") default=0 on TimeGenerated from _timespanStart to _timespanEnd step 1m
| mv-expand TimeGenerated, Value
| extend TimeGenerated = todatetime(TimeGenerated), Value=toreal(Value), MetricName="failureCount", ComponentName="Keyvault"
| lookup kind = inner Thresholds on MetricName
| extend IsYellow = iff(todouble(Value) > YellowThreshold and todouble(Value) < RedThreshold, 1, 0)
| extend IsRed = iff(todouble(Value) > RedThreshold, 1, 0)
目錄服務健康情況分數
最後,您可以將各種健康「狀態」查詢繫結在一起,以計算元件的健康情況「分數」。 下列範例查詢示範如何計算目錄服務健康情況分數:
CatalogServiceHealthStatus()
| union AksClusterHealthStatus()
| union KeyvaultHealthStatus()
| union EventHubHealthStatus()
| where TimeGenerated < ago(2m)
| summarize YellowScore = max(IsYellow), RedScore = max(IsRed) by bin(TimeGenerated, 2m)
| extend HealthScore = 1 - (YellowScore * 0.25) - (RedScore * 0.5)
| extend ComponentName = "CatalogService", Dependencies="AKSCluster,Keyvault,EventHub" // These values are added to build the dependency visualization
| order by TimeGenerated desc
提示
請參閱 Azure Mission-Critical Online GitHub 存放庫中的更多查詢範例。
設定以查詢為基礎的警示
警示會立即注意反映或影響健康狀態的問題。 每當健康狀態發生變更 (變更為降級 (黃色) 狀態或狀況不良 (紅色)) 時,應該將通知傳送給責任小組。 在健康情況模型的根節點設定警示,可立即察覺解決方案健康狀態的任何商務層級變更。 然後,您可以查看健康情況模型視覺效果,以取得詳細資訊和進行疑難排解。
此範例會使用 Azure 監視器警示來驅動自動化動作,以回應應用程式健康狀態的變更。
使用視覺效果的儀表板
務必將健康情況模型視覺化,以便快速瞭解元件中斷對整個系統的影響。 健康情況模型的最終目標是藉由提供穩定狀態偏差的知情檢視來促進快速診斷。
視覺化系統健康狀況資訊的常見方式是將分層健康情況模型檢視與儀表板中的遙測向下切入功能結合。
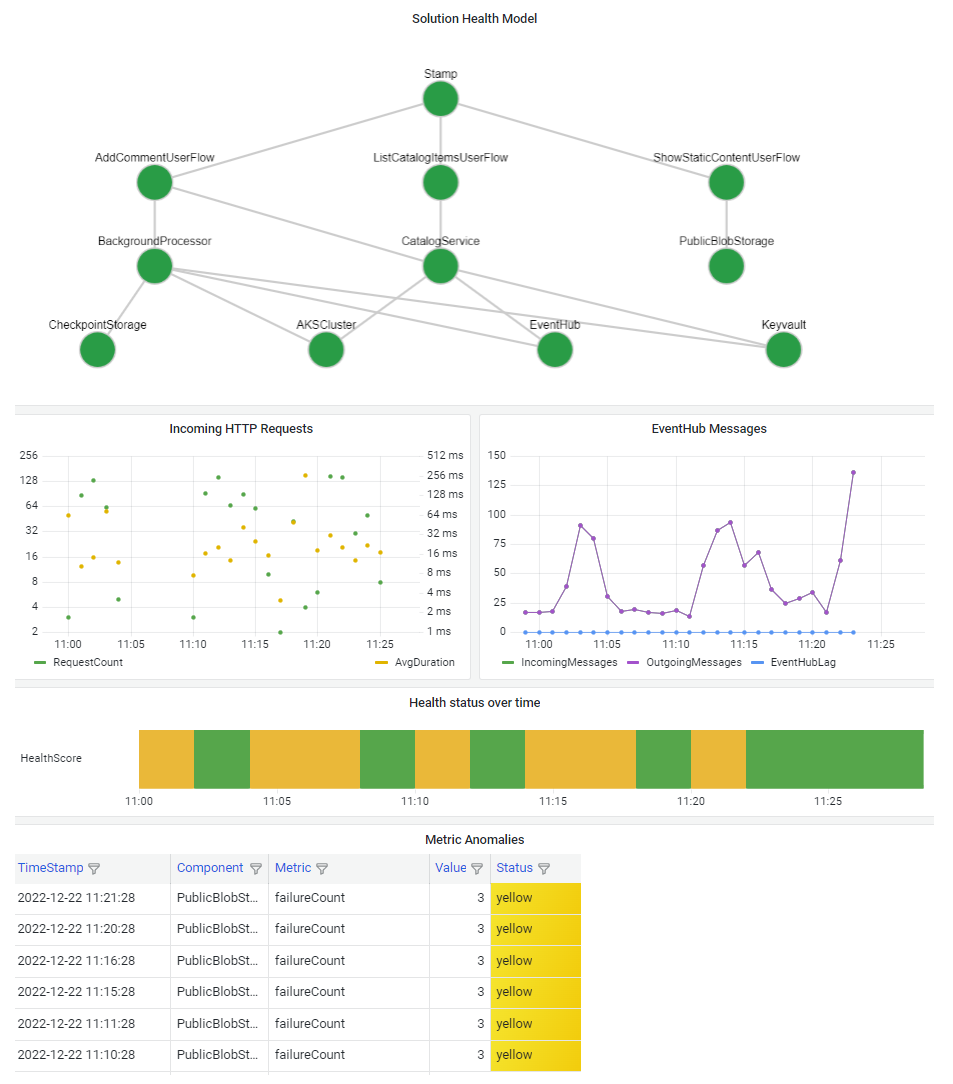
此儀表板技術應該能夠代表健康情況模型。 熱門選項包括 Azure 儀表板、Power BI 和 Azure 受控 Grafana。