練習 - 在入口網站中新增記錄及監視 Azure 函式
在上一個單元中,您已了解將 Application Insights 納入函數應用程式中的一些優點。 您也已了解開發人員小組可用的一些其他記錄功能。
在專案研究的這個階段中,您已使用 Maven 將函數應用程式部署至 Azure,且在生產環境中測試了函數應用程式。 下一個工作,是將追蹤和記錄功能新增至應用程式。
在本練習中,您會更新函式專案設定檔以支援記錄串流和 Application Insights。 您也會了解如何將自訂追蹤和 Application insights 事件觸發程序新增至專案程式碼。
即時串流記錄
現在,函數應用程式已部署並在 Azure 上執行,您可以使用簡單的 Azure CLI 命令進行疑難排解,以從應用程式中取得即時記錄串流。
在 Azure 入口網站的 HttpExample 函式的 [概觀] 頁面上。 使用 [複製到剪貼簿] 圖示來複製 [資源群組] 和 [函數應用程式] 的值。
在 [Azure Cloud Shell] 視窗中,輸入
az webapp log tail -n <functionAppName> -g <resourceGroup>命令來串流記錄。 將<functionAppName>和<resourceGroup>取代為您在上一個步驟中儲存的值。 例如:az webapp log tail -n event-reporting-20240125192009873 -g learn-f0af729c-0493-4b45-a5b8-d6b4783b03da您應該會看到類似下列訊息的輸出。
2024-01-25T20:44:58  Welcome, you are now connected to log-streaming service. The default timeout is 2 hours. Change the timeout with the App Setting SCM_LOGSTREAM_TIMEOUT (in seconds).
2024-01-25T20:45:58  No new trace in the past 1 min(s).
在網頁瀏覽器中開啟新的索引標籤,並貼上上一個練習中完整建構的 URL,從而存取函數應用程式以產生一些記錄。
當您完成測試時,請在 Cloud Shell 中按 Ctrl+C 以關閉記錄串流。
新增 Application Insights 的檢測至您的 Java 專案
現在已為應用程式啟用了 Application Insights,下一個工作是在應用程式中將其啟用。 若要啟用應用程式記錄和 Application Insights,則必須修改設定檔以包含必要的程式庫與其他相依性。
您需要更新兩個組態檔:pom.xml 和 host.json。
修改 pom.xml 檔案
使用 Azure Cloud Shell 將目錄變更為專案的根目錄:
cd ~/event-reporting使用 Cloud Shell 的程式碼編輯器來開啟 pom.xml 檔案:
code pom.xml將下列項目新增至獨立
<dependencies>區段,這會為應用程式啟用 Application Insights:<dependency> <groupId>com.microsoft.azure</groupId> <artifactId>applicationinsights-web-auto</artifactId> <version>2.6.0</version> </dependency>注意
請確定將 Application Instights 的
<dependency>新增至獨立<dependencies>集合,而不是包含在<dependencyManagement>項目內的<dependencies>集合。按 Ctrl+S 以儲存 pom.xml 檔案,然後按 Ctrl+Q 以關閉程式碼編輯器。
修改 host.json 檔案
使用 Cloud Shell 的程式碼編輯器來開啟 host.json 檔案:
code host.json移除現有的 JSON 程式碼,並以下列設定加以取代:
{ "version": "2.0", "extensionBundle": { "id": "Microsoft.Azure.Functions.ExtensionBundle", "version": "[1.*, 2.0.0)" }, "logging": { "fileLoggingMode": "always", "logLevel": { "default": "Information" } }, "applicationInsights": { "samplingSettings": { "isEnabled": true, "maxTelemetryItemsPerSecond" : 5 } } }extensionBundle的設定已定義,但logging和applicationInsights會定義這些功能的各項設定。按 Ctrl+S 以儲存 host.json 檔案,然後按 Ctrl+Q 以關閉程式碼編輯器。
將記錄和 Application Insights 追蹤新增至專案程式碼
若要改善 Application Insights 所收集顯示在記錄檔中資料的實用性,則必須將幾個資料記錄命令新增至應用程式程式碼。
將記錄新增至 Function.java 檔案
若要將一般記錄新增至函式,則可在應用程式程式碼中的重點處新增如下程式碼,您會在其中將 [LOG MESSAGE] 字串取代為想要在應用程式記錄檔中看到的訊息。
context.getLogger().info("[LOG MESSAGE]");
若要將記錄新增至應用程式,請使用下列步驟。
在 Cloud Shell 編輯器中開啟應用程式的 Function.java 檔案:
code ~/event-reporting/src/main/java/com/contoso/functions/Function.java如果您檢查現有程式碼,將會看到現有的
context.getLogger()命令;這是定義run()函式後的第一個指令。找出下列程式碼區段,此程式碼區段會測試空白 GET 查詢字串或空白 POST 要求:
if (name == null) {
    return request.createResponseBuilder(HttpStatus.BAD_REQUEST).body("Please pass a name on the query string or in the request body").build();
} else {
    return request.createResponseBuilder(HttpStatus.OK).body("Hello, " + name).build();
}
修改這段程式碼,使其包含兩個
context.getLogger()命令以將函式狀態輸出至記錄系統:if (name == null) { context.getLogger().info("Execution failure - Incorrect or missing parameter used."); return request.createResponseBuilder(HttpStatus.BAD_REQUEST).body("Please pass a name on the query string or in the request body").build(); } else { context.getLogger().info("Execution success - name parameter = " + name); return request.createResponseBuilder(HttpStatus.OK).body("Hello, " + name).build(); }按 Ctrl+S 以儲存 Function.java 檔案,但不要關閉編輯器;在本練習的下一節中,您會將程式碼新增至應用程式。
將 Application Insights 追蹤新增至 Function.java 檔案
將下列
import陳述式新增至現有的匯入集合;此陳述式會匯入 Application Insights 遙測程式庫:import com.microsoft.applicationinsights.TelemetryClient;在應用程式的
Function()類別中新增下列定義;此陳述式會將TelemetryClient物件具現化:private TelemetryClient telemetry = new TelemetryClient();複製每個
context.getLogger()陳述式並修改程式碼,讓每個重複項目都呼叫telemetry.trackEvent(),而不是context.getLogger():. . . context.getLogger().info("Java HTTP trigger processed a request."); telemetry.trackEvent("Java HTTP trigger processed a request."); // Parse query parameter String query = request.getQueryParameters().get("name"); String name = request.getBody().orElse(query); if (name == null) { context.getLogger().info("Execution failure - Incorrect or missing parameter used."); telemetry.trackEvent("Execution failure - Incorrect or missing parameter used."); return request.createResponseBuilder(HttpStatus.BAD_REQUEST).body("Please pass a name on the query string or in the request body").build(); } else { context.getLogger().info("Execution success - name parameter = " + name); telemetry.trackEvent("Execution success - name parameter = " + name); return request.createResponseBuilder(HttpStatus.OK).body("Hi, " + name).build(); } . . .按 Ctrl+S 以儲存 Function.java 檔案,然後按 Ctrl+Q 以關閉程式碼編輯器。
最後一件事,就是建置、封裝及重新部署函數應用程式。
cd ~/event-reporting
mvn clean package azure-functions:deploy
記錄和 Application Insights 資料收集現在已新增至您的函式。
使用 Application Insights 來監視 Azure 函式
應用程式現已更新,可支援系統記錄器和 Application Insights 的細微記錄。
若要產生一些範例 HTTP 流量,請複製在上一個練習中用來在網頁瀏覽器中測試應用程式的 URL。 使用該 URL 搭配 cURL 在 Azure Cloud Shell 中建立迴圈;例如:
while :; do curl https://event-reporting-20200102030405006.azurewebsites.net/api/HttpExample?name=Bob; sleep 1; done使用啟用沙箱時所用的相同帳戶來登入 Azure 入口網站。
從左側功能表選取 [所有資源]。
從資源清單選取函式;在本練習中,函式名稱會以 event-reporting 開頭。 例如:event-reporting-20200102030405006。
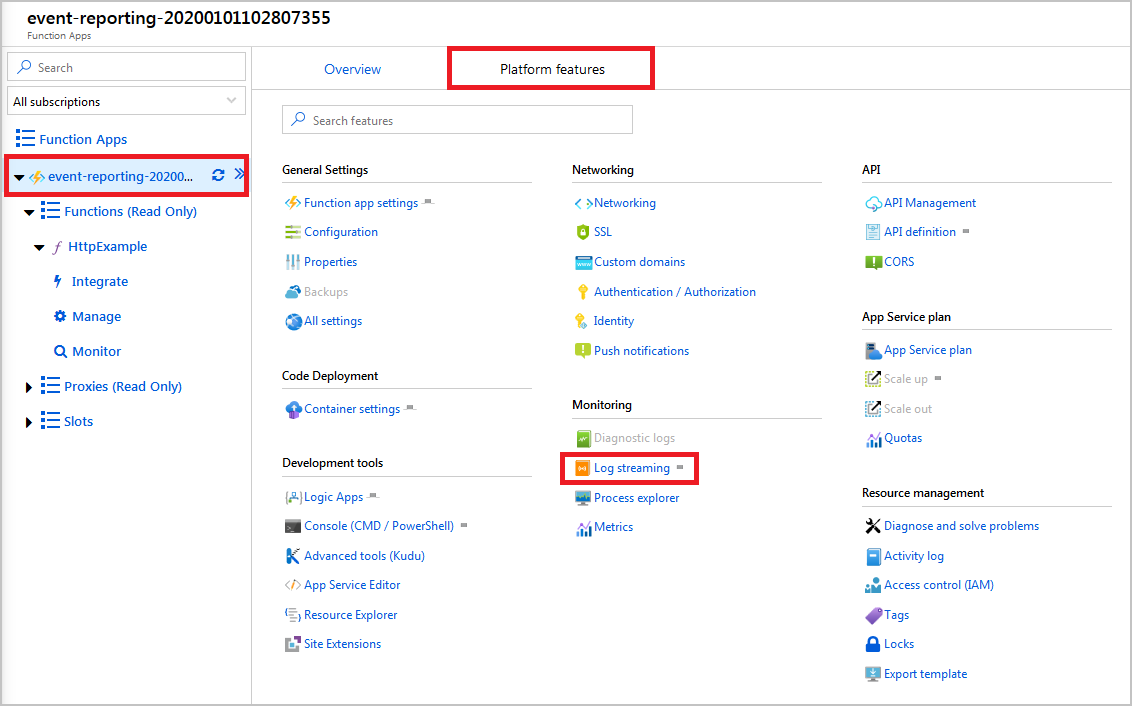
檢視 [記錄串流] 活動:
選取 [函數應用程式] 功能表上的 [記錄串流]。
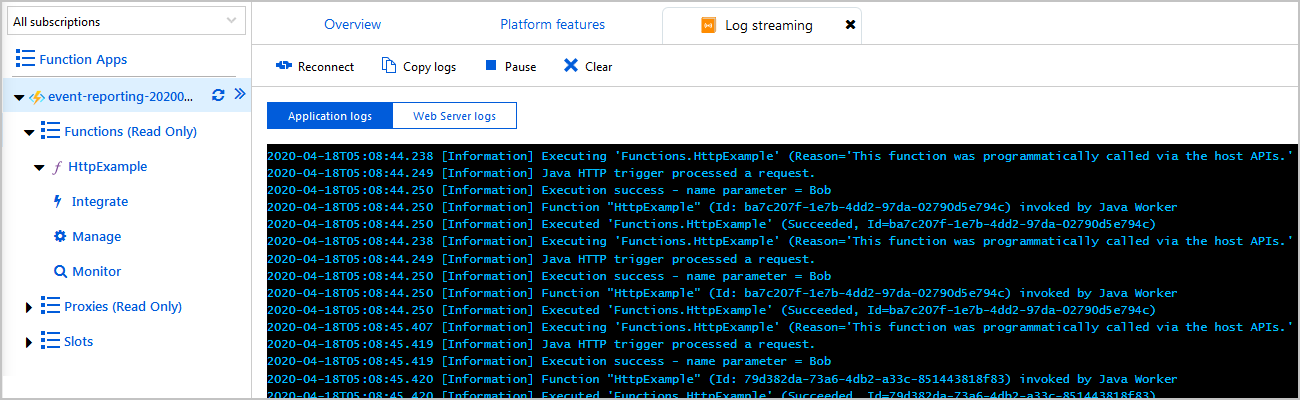
開啟 [App Insights 記錄] 下拉式清單,然後選取 [檔案系統記錄]。
請注意,您的範例流量會產生一系列記錄項目。
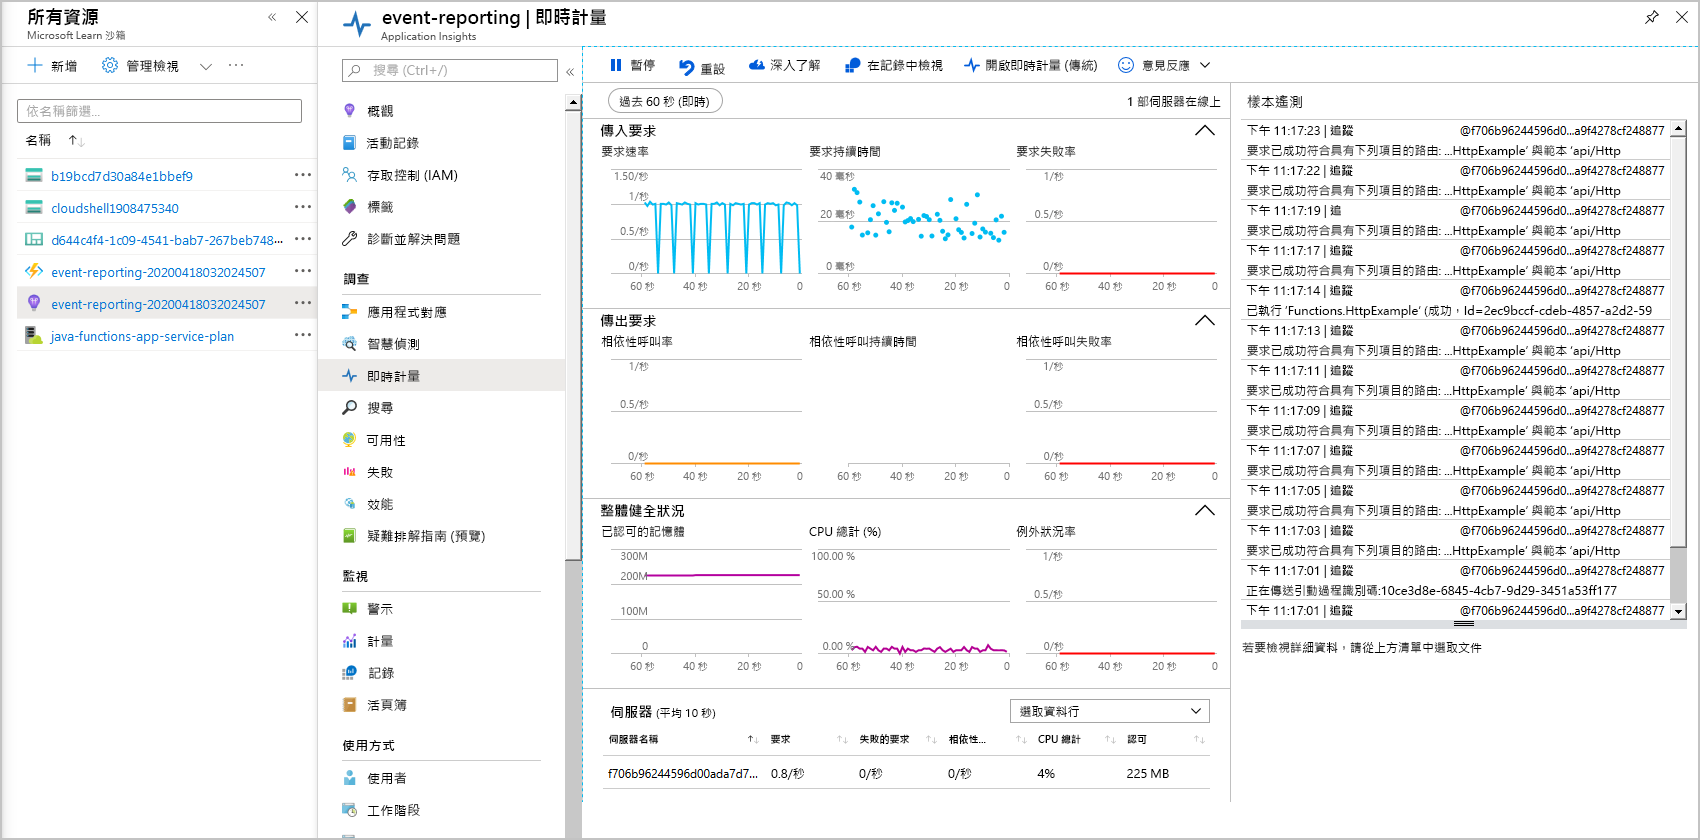
檢視 [即時計量] 活動:
選取 [檔案系統記錄] 下拉式清單,然後選取 [App Insights 記錄]。
選取 [在即時計量中開啟]。 現在您可以看到範例流量會產生 Application Insights 和即時計量結果。
恭喜,您已成功設定 Azure 函式以進行詳細記錄。
在繼續前,請先切換回 Cloud Shell 並按 Ctrl+C 來關閉命令迴圈。