練習 - 在雲端原生應用程式中使用 OpenTelemetry 數據
在此練習中,您會在您的應用程式中更清楚地了解 OpenTelemetry 所產生的所有資料。 您已完成將診斷功能新增至市集服務。 之後,將 Prometheus 和 Grafana 新增至 eShopLite 服務,並查看正在擷取的一些計量。 下一個步驟是新增 Zipkin 並檢視分散式追蹤。 最後,您會將Application Insights新增至您的應用程式,並使用它來檢視數據。
新增 Prometheus 和 Grafana
Prometheus 和 Grafana 提供 Docker 映射,可讓您輕鬆地將映像新增至您的專案。 您會將它們包含在解決方案根目錄中 docker-compose.yml 檔案中。
在 EXPLORER 窗格中,選取 docker-compose.yml 檔案。
將此 YAML 新增至檔案底部:
  prometheus:
    image: prom/prometheus
    container_name: prometheus
    command:
      - '--config.file=/etc/prometheus/prometheus.yml'
    ports:
      - 9090:9090
    restart: unless-stopped
    volumes:
      - ./prometheus:/etc/prometheus

  grafana:
    image: grafana/grafana
    container_name: grafana
    ports:
      - 3000:3000
    restart: unless-stopped
    environment:
      - GF_SECURITY_ADMIN_USER=admin
      - GF_SECURITY_ADMIN_PASSWORD=grafana
    volumes:
      - ./grafana/datasource:/etc/grafana/provisioning/datasources
上述 Docker yaml 新增了兩個新的服務 Prometheus 和 Grafana。 Prometheus 區段會設定容器以回應埠 9090。 會對應預期 prometheus.yml 檔案的 prometheus 資料夾。 Grafana 區段會設定容器以回應埠 3000。 會對應 grafana 資料夾中的三個資料夾。
設定 Prometheus
必須設定 Prometheus,讓它知道要收集計量的位置。 您會將 prometheus.yml 檔案新增至 prometheus 資料夾。
在 EXPLORER 窗格上,右鍵點選 dotnet-observability 資料夾,然後選取 新增資料夾。
在 [名稱] 欄位中,輸入 prometheus。
在 EXPLORER 窗格中,以滑鼠右鍵點擊 prometheus 資料夾,然後選取 新增檔案。
在 [名稱] 欄位中,輸入 prometheus.yml。
在檔案編輯器中,輸入此 YAML:
global:
  scrape_interval: 1s

scrape_configs:
  - job_name: 'products'
    static_configs:
      - targets: ['backend:8080']
  - job_name: 'store'
    static_configs:
      - targets: ['frontend:8080']
上述 YAML 會設定 Prometheus,以從 後端 和 前端 服務擷取計量。 當應用程式在 Docker 中執行時,主機名是服務名稱。
選擇 Ctrl+S 以儲存檔案。
設定 Grafana
Grafana 必須設定以便確認要收集度量指標的位置。
在 [檔案總管] 窗格中,以滑鼠右鍵按一下 dotnet-observability 資料夾,然後選取 [新增資料夾]。
在 [名稱] 欄位中,輸入 grafana。
以滑鼠右鍵按兩下 grafana 資料夾,然後選取[ 新增資料夾]。
在 [名稱] 欄位中,輸入 數據源。
以滑鼠右鍵按兩下 grafana 資料夾,然後選取[ 新增資料夾]。
在 [名稱] 欄位中,輸入 儀錶板。
展開 grafana 資料夾,以滑鼠右鍵按下 數據源 資料夾,然後選取 [ 新增檔案]。
在 [名稱] 欄位中,輸入 datasource.yml。
在 [編輯器] 索引標籤上,輸入此 YAML:
apiVersion: 1

datasources:
- name: Prometheus
  type: prometheus
  url: http://prometheus:9090
  isDefault: true
  access: proxy
  editable: true
上述 YAML 會將 Grafana 設定為使用 Prometheus 作為數據源。
選擇 Ctrl+S 以儲存檔案。
更新您的 ASP.NET Core 應用程式,以公開 Prometheus 的計量
現在,診斷專案只會設定為向控制台公開計量。 您可以更新專案以改為向 Prometheus 公開計量。
在底部的 [終端機 ] 窗格上,移至 [ 診斷] 資料夾。
執行此指令:
cd .\eShopLite\Diagnostics\移除
OpenTelemetry.Exporter.Console套件:dotnet remove package OpenTelemetry.Exporter.Console新增
OpenTelemetry.Exporter.Prometheus.AspNetCore套件:dotnet add package OpenTelemetry.Exporter.Prometheus.AspNetCore --prerelease在 [檔案總管] 窗格中,展開 [診斷] 資料夾,然後選取 DiagnosticServiceCollectionExtensions.cs。
以下列程式代碼取代主控台匯出工具
.AddConsoleExporter();:.AddPrometheusExporter();在檔案底部的最後一個
}之前,新增下列程序代碼:public static void MapObservability(this IEndpointRouteBuilder routes) { routes.MapPrometheusScrapingEndpoint(); }此程式碼會將 Prometheus 抓取端點新增至應用程式中有包含在其中的每個服務。 這可讓 Prometheus 從
http://service/metrics擷取計量。選擇 Ctrl+S 以儲存檔案。
公開商店服務中的計量
應用程式目前僅設定為公開 產品 服務的計量。 您也會更新應用程式以公開 市集 服務的計量。
在 [檔案總管] 窗格的 [方案總管] 下,以滑鼠右鍵按一下 [商店] 專案,然後選取 [新增專案參考]。
選取診斷。
在 [檢視器] 窗格上,展開 [市集] 資料夾,然後選取 [Program.cs]。
在程序代碼批註
// Add observability code here下,新增對 Diagnostics 方法的呼叫:builder.Services.AddObservability("Store", builder.Configuration);在
app.Run()方法之前,新增下列程序代碼:app.MapObservability();此方法會將 Prometheus 擷取端點新增至 市集 服務。
選擇 Ctrl+S 以儲存檔案。
在 [檔案總管] 窗格中,展開 [產品] 資料夾,然後選取 [Program.cs]。
在
app.Run()方法之前,新增下列程序代碼:app.MapObservability();這個方法會將 Prometheus 抓取端點新增至 Products 服務。
選擇 Ctrl+S 以儲存檔案。
測試新的可觀察性特徵
您現在會測試新增至應用程式的新可檢視性功能。
在底部的 [終端機 ] 窗格中,移至 dotnet-observability/eShopLite 資料夾。
cd ..更新應用程式容器。
dotnet publish /p:PublishProfile=DefaultContainer移至 dotnet-observability 資料夾,並使用 Docker 啟動應用程式:
cd ..
docker compose up
在 [連接埠] 分頁上,針對 [Prometheus (9090)] 選取 [在瀏覽器中開啟]。 如果您是在本機的 Visual Studio Code 上執行,請開啟瀏覽器,然後在新的分頁中前往 Prometheus 應用程式
http://localhost:9090。在頂端功能表上,選取 [ 狀態 ],然後選取 [ 目標]。

您應該看到 [產品] 與 [商店] 服務列為 [UP]。
在 [連接埠] 分頁上,針對 [Grafana (3000)] 選取 [在瀏覽器中開啟]。 如果您在 Visual Studio Code 中本機執行,請開啟瀏覽器,並且在新的分頁上前往 Grafana 應用程式
http://localhost:3000。輸入使用者名稱 管理員。
輸入密碼 grafana。
選取 [建立您的第一個儀表板]。
選取 [匯入儀表板]。
在新的索引標籤上,移至 GitHub ,然後開啟 ASP.NET Core 儀錶板 json 檔案。
複製 [原始] 檔案。
將 JSON 貼到 [ 透過儀錶板 JSON 模型匯入] 文字框中。
選擇 載入。
在 [Prometheus 數據源] 下拉式清單中,選取 [Prometheus]。
選擇 匯入。
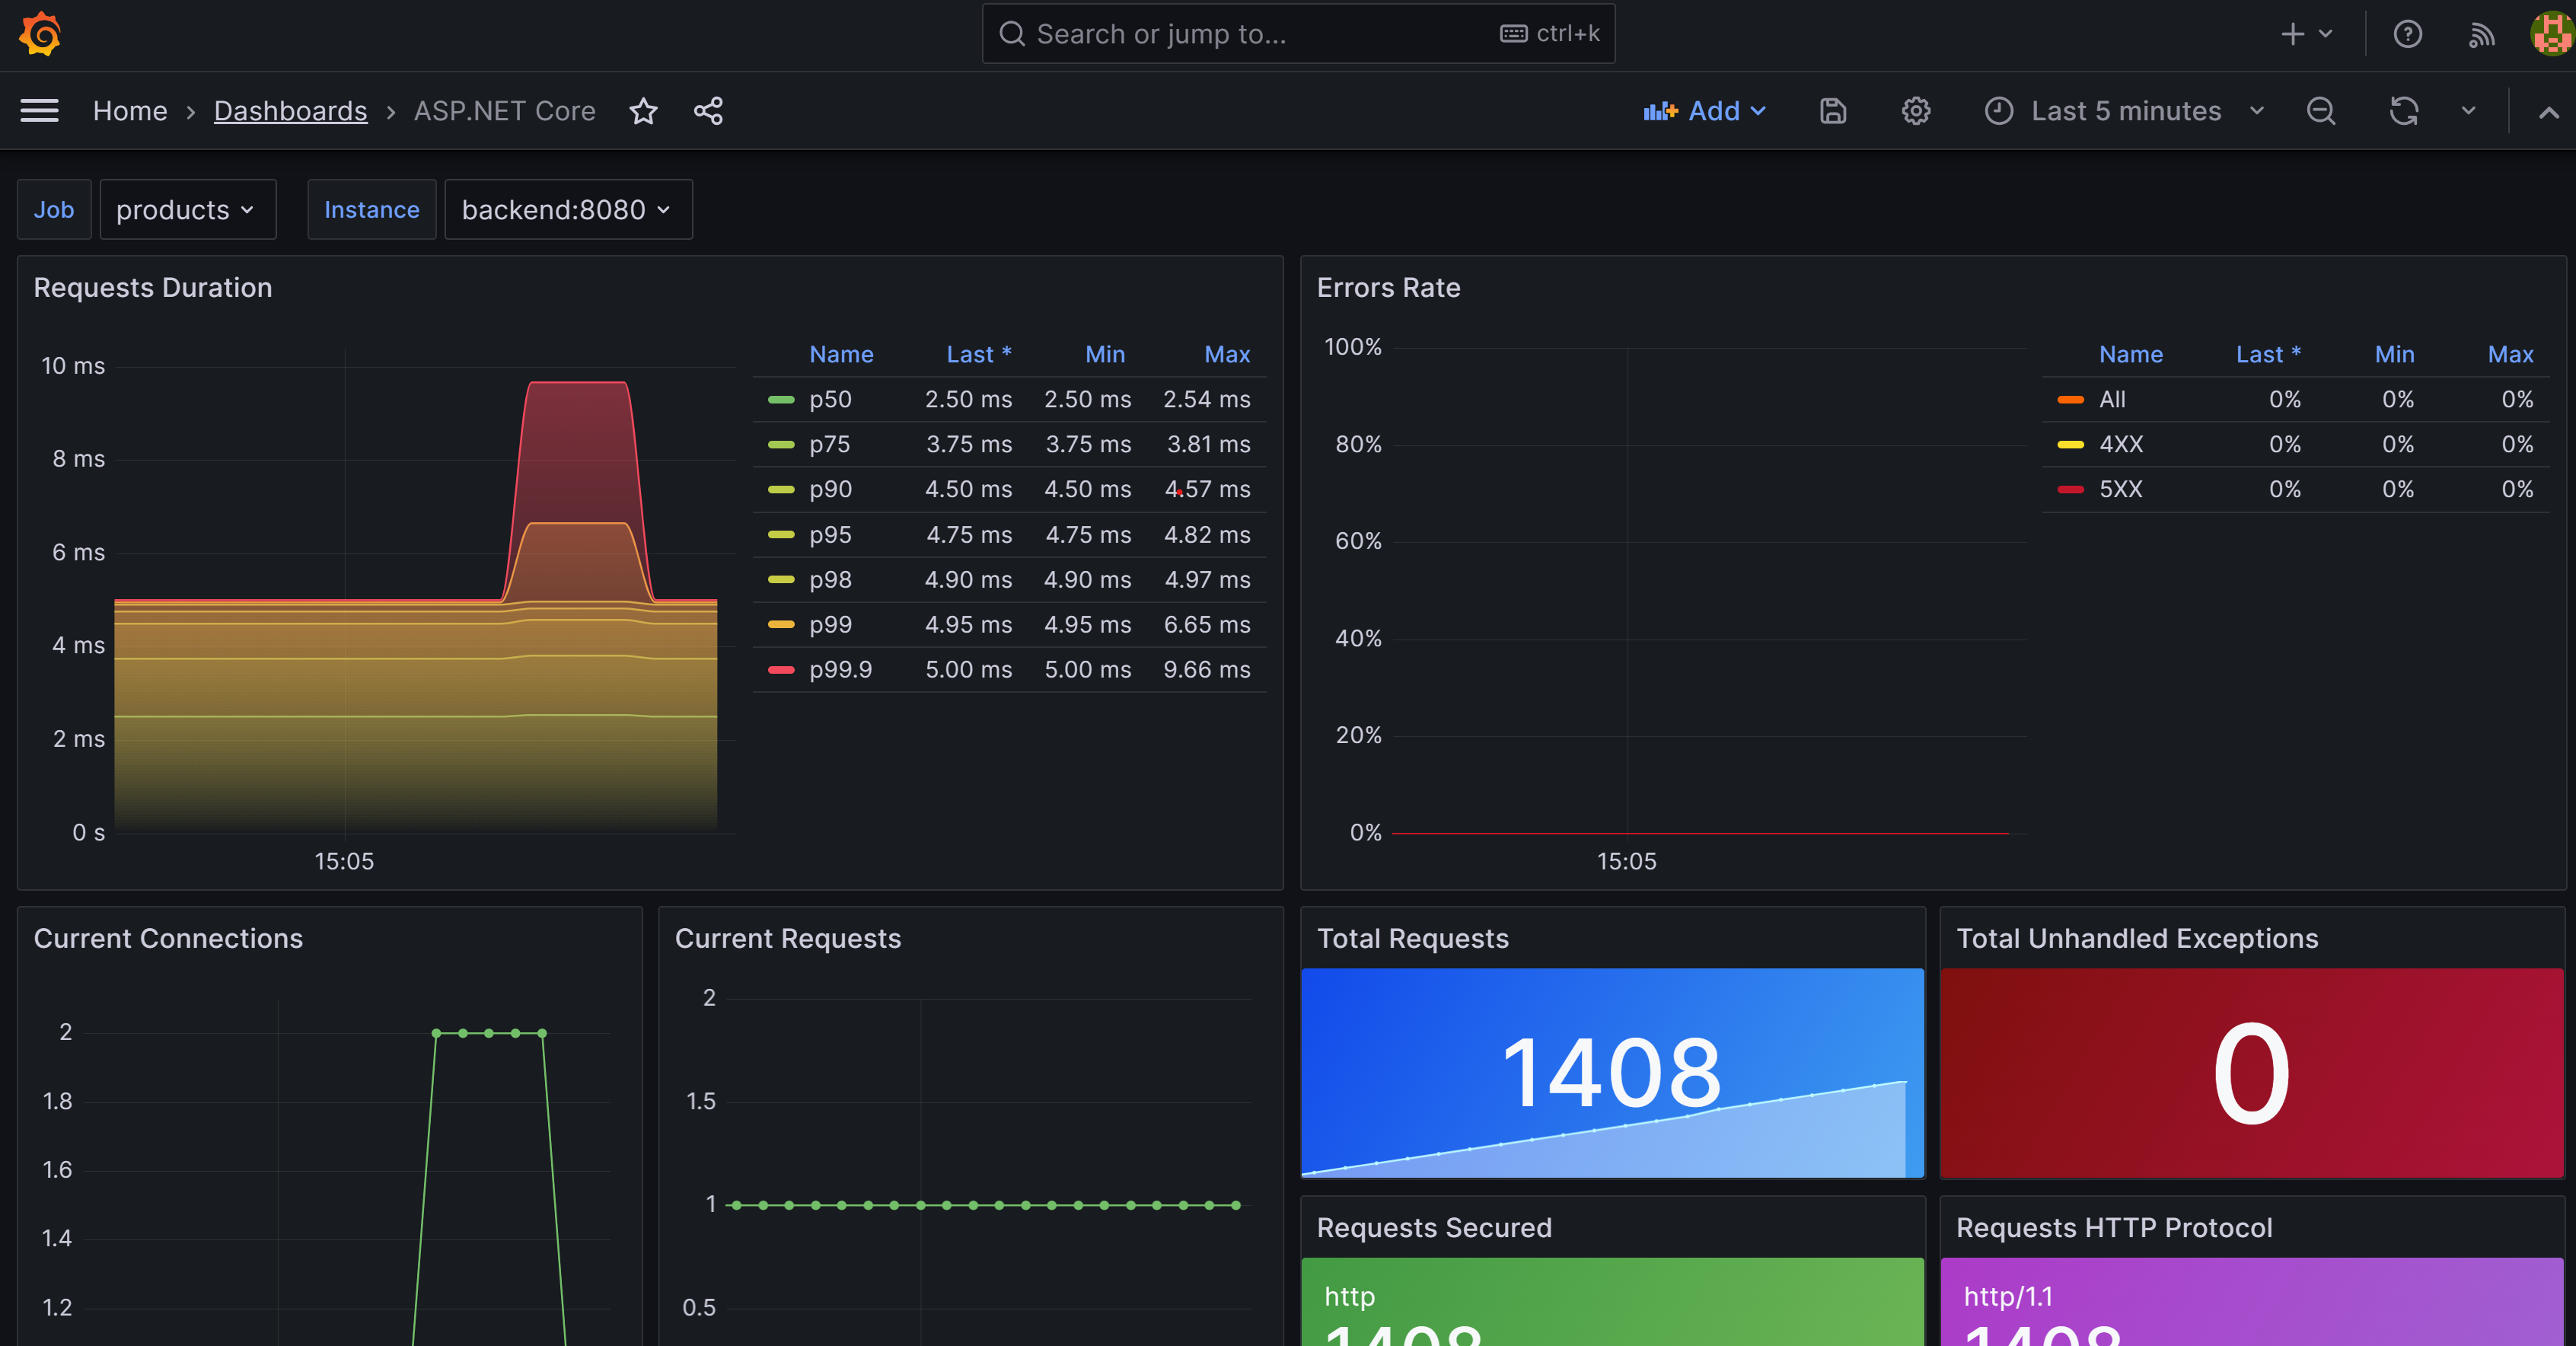
您應該會看到儀錶板,其中顯示產品和市集服務的計量。 選取 [作業],以在兩個服務之間變更。
在 [終端機 ] 窗格中,選取 Ctrl+C 以停止應用程式。


新增 Zipkin
您現在新增 Zipkin 來擴充應用程式的追蹤功能。 如同您先前所做的,您會將 Zipkin 容器新增至您的應用程式,並將其設定為連線到 OpenTelemetry 收集器。 然後將 OpenTelemetry Zipkin 匯出工具新增至您的應用程式。
在 檢視器 窗格中,選取 dotnet-observability 資料夾內的 docker-compose.yml 檔案。
在
prometheus的zipkin中加入depends_on和frontend。depends_on: - backend - prometheus - zipkin在
backend的depends_on中新增prometheus。depends_on: - prometheus將 Zipkin 的環境變數新增至 BOTH
frontend和backend:environment: - ZIPKIN_URL=http://zipkin:9411這兩個服務看起來應該像這樣:
frontend:
  image: storeimage
  build:
    context: .
    dockerfile: ./eShopLite/Store/Dockerfile
  environment:
    - ProductEndpoint=http://backend:8080
    - ZIPKIN_URL=http://zipkin:9411
  ports:
    - "32000:8080"
  depends_on:
    - backend
    - prometheus
    - zipkin

backend:
  image: productservice
  build:
    context: .
    dockerfile: ./eShopLite/Products/Dockerfile
  environment:
    - ZIPKIN_URL=http://zipkin:9411

  ports:
    - "32001:8080"
  depends_on:
    - prometheus
將此 YAML 新增至檔案底部:
  zipkin:
    image: openzipkin/zipkin
    ports:
      - 9411:9411
上述 YAML 會將 Zipkin 容器新增至應用程式。 它會設定 Zipkin 容器以回應埠 9411。
選擇 Ctrl+S 以儲存檔案。
在 [終端機 ] 窗格上,移至 [ 診斷] 資料夾。
cd ./eShopLite/Diagnostics/新增 Zipkin 匯出套件。
dotnet add package OpenTelemetry.Exporter.Zipkin --prerelease在 [檔案總管] 窗格中,展開 [診斷] 資料夾,然後選取 DiagnosticServiceCollectionExtensions.cs。
在追蹤服務提供者的最下方,新增 Zipkin:
// add the tracing providers
.WithTracing(tracing =>
{
  tracing.SetResourceBuilder(resource)
              .AddAspNetCoreInstrumentation()
              .AddHttpClientInstrumentation()
              .AddSqlClientInstrumentation()
              .AddZipkinExporter(zipkin =>
              {
                var zipkinUrl = configuration["ZIPKIN_URL"] ?? "http://zipkin:9411";
                zipkin.Endpoint = new Uri($"{zipkinUrl}/api/v2/spans");
              });
});
選擇 Ctrl+S 以儲存檔案。
在底部的 [終端機 ] 窗格中,移至 dotnet-observability/eShopLite 資料夾。
cd ..更新應用程式容器。
dotnet publish /p:PublishProfile=DefaultContainer移至 dotnet-observability 資料夾,並使用 Docker 啟動應用程式:
cd ..
docker compose up
在 [連接埠] 分頁上,針對 [Prometheus (9090)] 選取 [在瀏覽器中開啟]。 如果您在 Visual Studio Code 中本機執行,請開啟新瀏覽器分頁,並且前往 Zipkin 應用程式
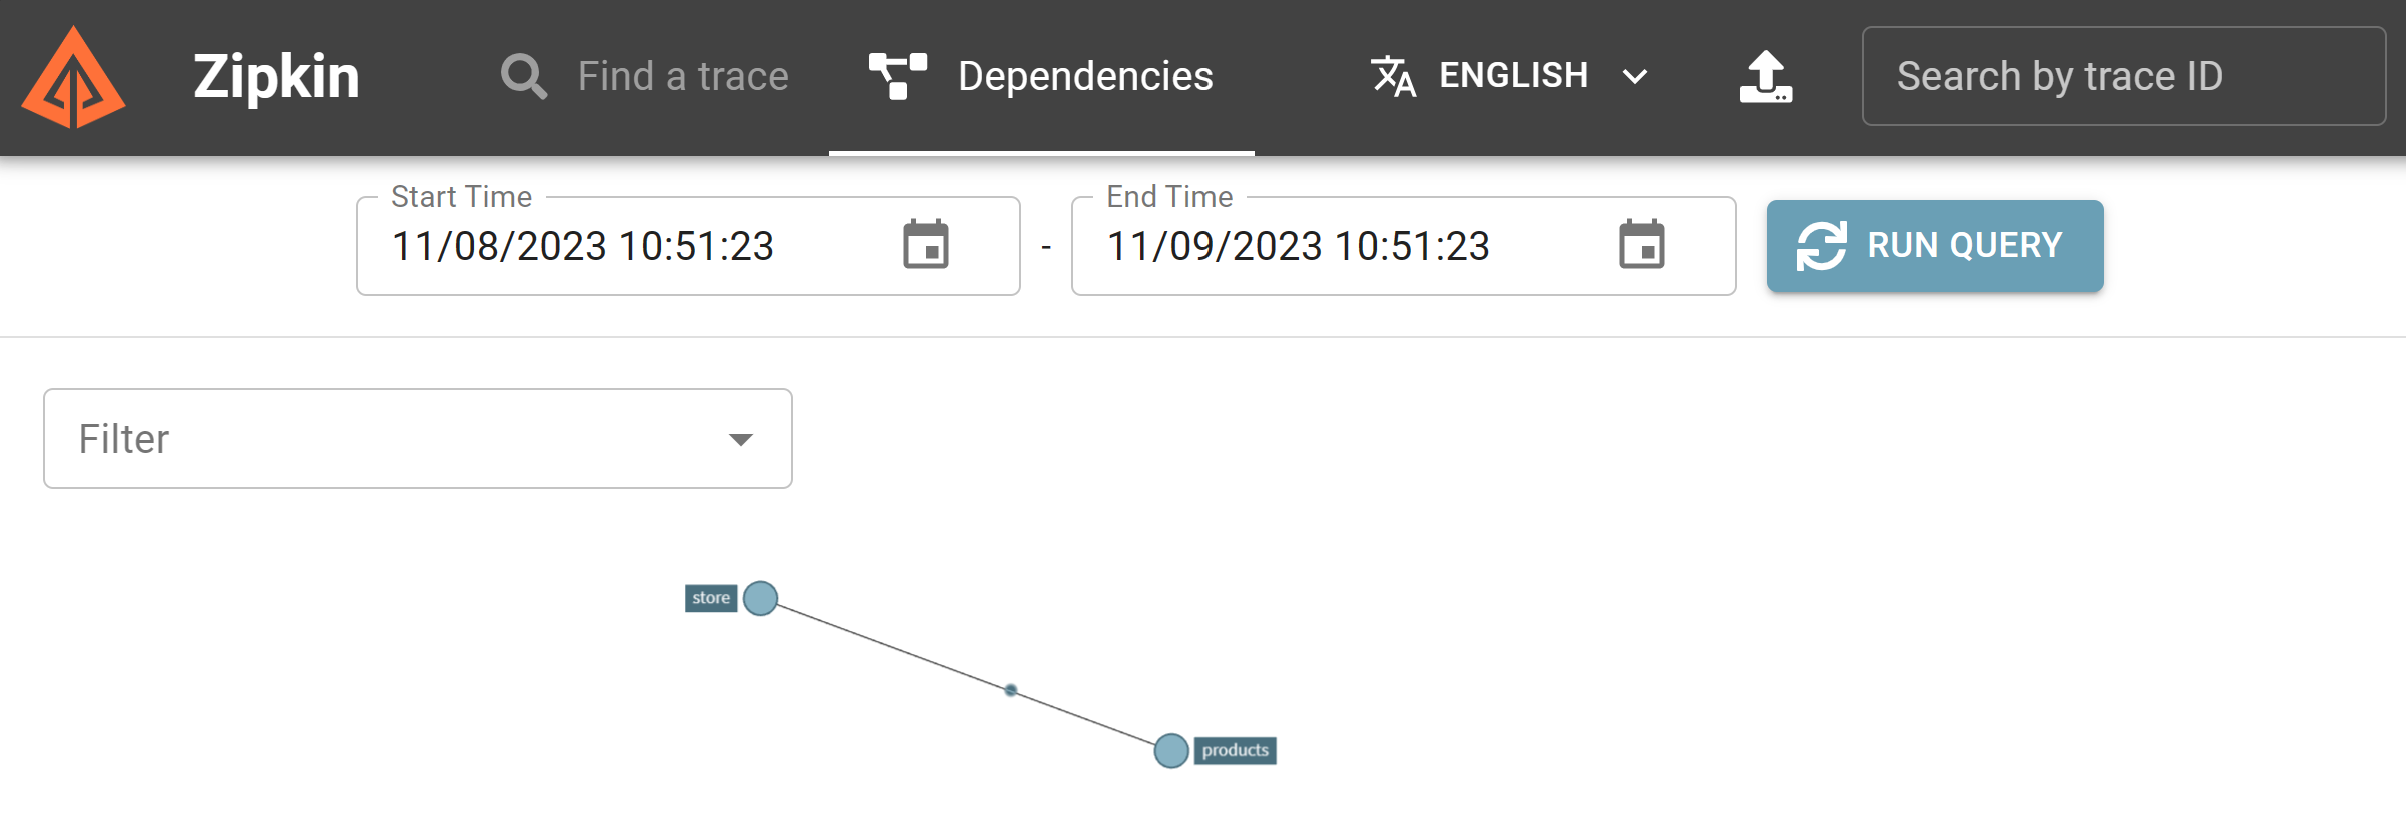
http://localhost:9411。在功能表上,選取 [ 相依性]。
在 [終端機 ] 窗格中,選取 Ctrl+C 以停止應用程式。
新增 Application Insights
最後一個步驟是將ApplicationInsights新增至您的應用程式。
在 Azure 中建立 Application Insights 資源
在 [終端機 ] 窗格中,登入 Azure。
az login --use-device-code檢視您選取的 Azure 訂用帳戶。
az account show -o table如果選取錯誤的訂用帳戶,請使用 az account set 命令選取正確的訂用帳戶。
新增 Application Insights 的擴充功能。
az extension add -n application-insights建立 Application Insights 資源。
az monitor app-insights component create --app eShopLiteInsights --location eastus --kind web -g eShopLite您應該會看見下列輸出:
{
  "appId": "00001111-aaaa-2222-bbbb-3333cccc4444",
  "applicationId": "eShopLiteInsights",
  "applicationType": "web",
  "connectionString": "InstrumentationKey=00000000-0000-0000-0000-000000000000;IngestionEndpoint=https://eastus-2.in.applicationinsights.azure.com/;LiveEndpoint=https://eastus.livediagnostics.monitor.azure.com/",
  "creationDate": "2023-11-10T16:50:00.950726+00:00",
  "disableIpMasking": null,
  "etag": "\"3a02952a-0000-0100-0000-654e5f380000\"",
  "flowType": "Bluefield",
  "hockeyAppId": null,
  "hockeyAppToken": null,
  "id": "/subscriptions/aaaa0a0a-bb1b-cc2c-dd3d-eeeeee4e4e4e/resourceGroups/eShopLite/providers/microsoft.insights/components/eShopLiteInsights",
  "immediatePurgeDataOn30Days": null,
  "ingestionMode": "ApplicationInsights",
  "instrumentationKey": "00000000-0000-0000-0000-000000000000",
  "kind": "web",
  "location": "eastus",
  "name": "eShopLiteInsights",
  "privateLinkScopedResources": null,
  "provisioningState": "Succeeded",
  "publicNetworkAccessForIngestion": "Enabled",
  "publicNetworkAccessForQuery": "Enabled",
  "requestSource": "rest",
  "resourceGroup": "eShopLite",
  "retentionInDays": 90,
  "samplingPercentage": null,
  "tags": {},
  "tenantId": "aaaabbbb-0000-cccc-1111-dddd2222eeee",
  "type": "microsoft.insights/components"
}
從上述傳回的 JSON 複製
connectionString,但不包括 "。 例如:InstrumentationKey=b851fa75-85a2-42f7-bb6f-413725d9d8ba;IngestionEndpoint=https://eastus-2.in.applicationinsights.azure.com/;LiveEndpoint=https://eastus.livediagnostics.monitor.azure.com/在 EXPLORER 窗格中,選取 docker-compose.yml 檔案。
新增診斷專案用來連線到 Application Insights 的環境變數。 將此 YAML 新增至 市集 服務:
environment:
  - APPLICATIONINSIGHTS_CONNECTION_STRING=InstrumentationKey=b851fa75-85a2-42f7-bb6f-413725d9d8ba;IngestionEndpoint=https://eastus-2.in.applicationinsights.azure.com/;LiveEndpoint=https://eastus.livediagnostics.monitor.azure.com/
將上述連接字串取代為您從 Azure CLI 複製的字串。
針對 產品 服務重複這些步驟。 最後的 YAML 看起來應該像這樣:
  frontend:
    image: storeimage
    build:
      context: .
      dockerfile: ./eShopLite/Store/Dockerfile
    environment:
      - ProductEndpoint=http://backend:8080
      - ZIPKIN_URL=http://zipkin:9411
      - APPLICATIONINSIGHTS_CONNECTION_STRING=InstrumentationKey=b851fa75-85a2-42f7-bb6f-413725d9d8ba;IngestionEndpoint=https://eastus-2.in.applicationinsights.azure.com/;LiveEndpoint=https://eastus.livediagnostics.monitor.azure.com/
    ports:
      - "32000:8080"
    depends_on:
      - backend
      - prometheus
      - zipkin

  backend:
    image: productservice
    build:
      context: .
      dockerfile: ./eShopLite/Products/Dockerfile
    environment:
      - ZIPKIN_URL=http://zipkin:9411
      - APPLICATIONINSIGHTS_CONNECTION_STRING=InstrumentationKey=b851fa75-85a2-42f7-bb6f-413725d9d8ba;IngestionEndpoint=https://eastus-2.in.applicationinsights.azure.com/;LiveEndpoint=https://eastus.livediagnostics.monitor.azure.com/
選擇 Ctrl+S 以儲存檔案。
在 [終端機 ] 窗格上,移至 [ 診斷] 資料夾。
cd .\eShopLite\Diagnostics\新增 Application Insights 導出工具套件。
dotnet add package Azure.Monitor.OpenTelemetry.AspNetCore --prerelease在 [ 探索] 窗格中,選取 [ 診斷] 資料夾,然後選取 [DiagnosticServiceCollectionExtensions.cs]。
在檔案頂端,新增此
using語句:using Azure.Monitor.OpenTelemetry.AspNetCore;在
var otelBuilder = services.AddOpenTelemetry();後,新增此程式碼:if (!string.IsNullOrEmpty(configuration["APPLICATIONINSIGHTS_CONNECTION_STRING"])) { otelBuilder.UseAzureMonitor(); }選擇 Ctrl+S 以儲存檔案。
在底部的 [終端機 ] 窗格中,移至 dotnet-observability/eShopLite 資料夾。
cd ..更新應用程式容器。
dotnet publish /p:PublishProfile=DefaultContainer移至 dotnet-observability 資料夾,並使用 Docker 啟動應用程式:
cd ..
docker compose up
使用您用來登入 Azure CLI 的相同認證登入 Azure 入口網站。
在 Azure 入口網站中,選取 [資源群組]。
選取 eShopLite 資源群組。
選取 eShopLiteInsights Application Insights 資源。
選取 [應用程式儀錶板]。
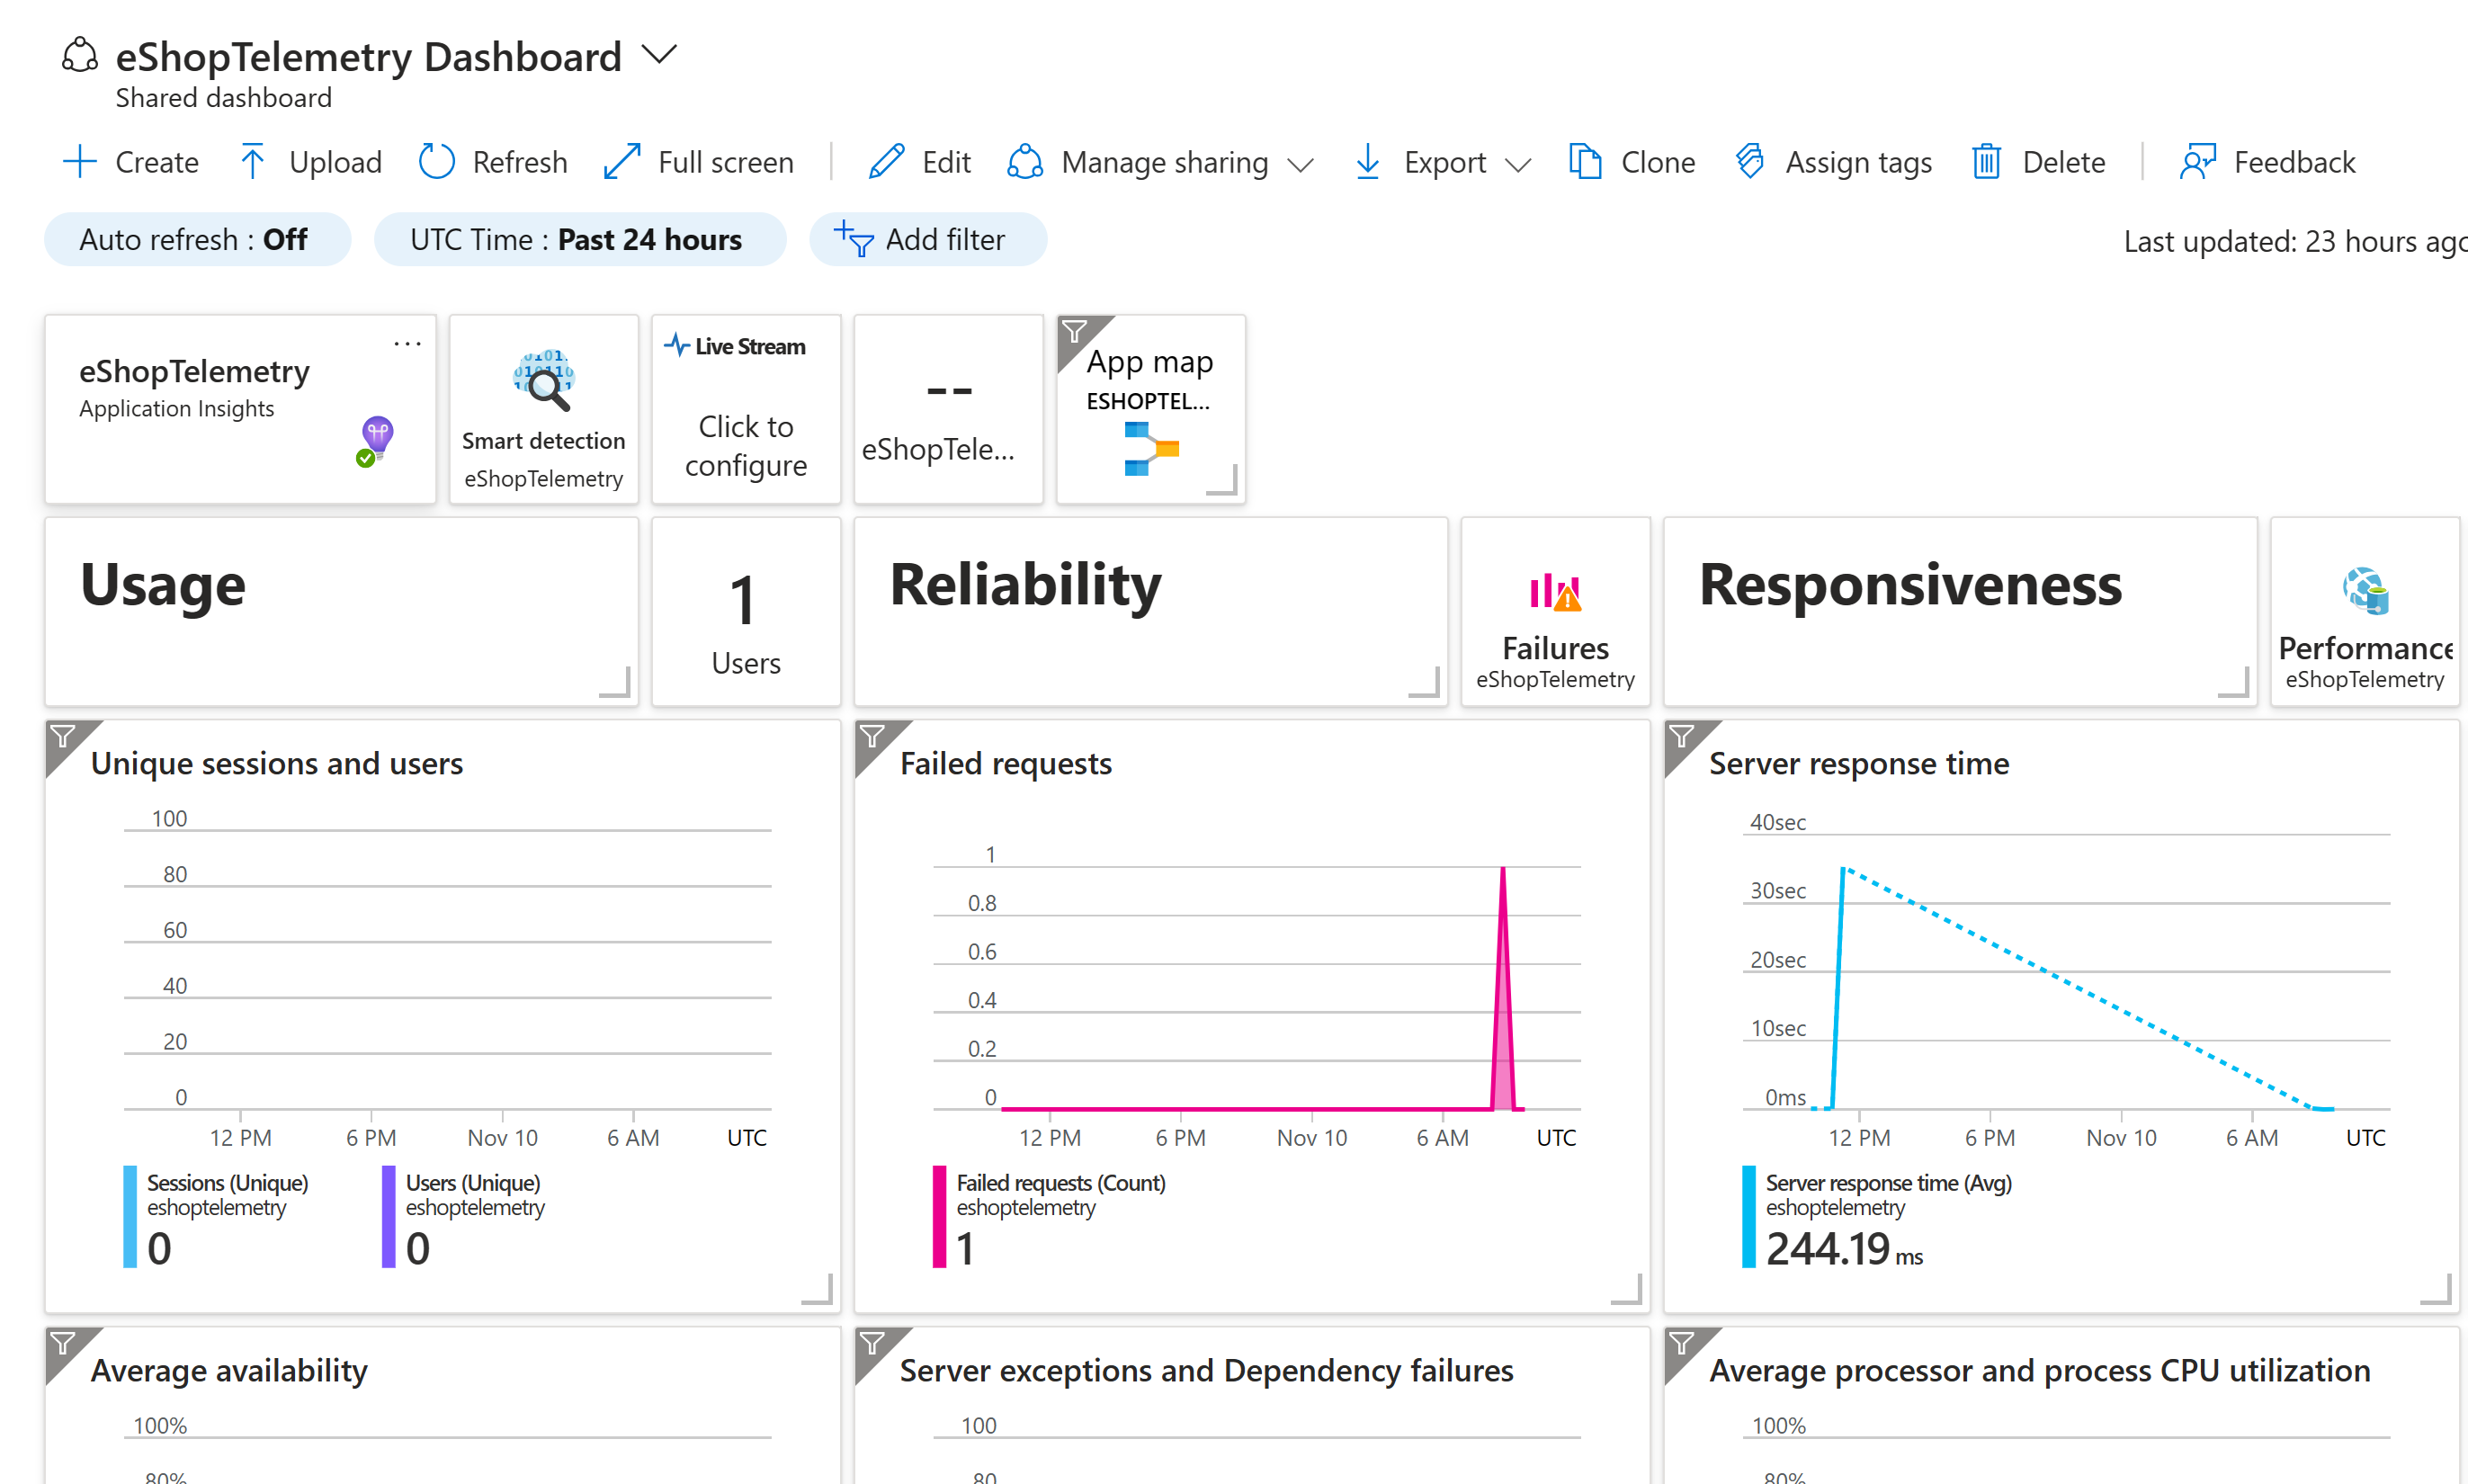
若要查看計量的變更,請移至 eShopLite 應用程式並變更庫存。 然後重新整理 Application Insights 儀表板。
在 [終端機 ] 窗格中,按 Ctrl+C 以停止應用程式。
