Get started with prompt flow
This article walks you through the main user journey of using prompt flow in Azure Machine Learning studio. You'll learn how to enable prompt flow in your Azure Machine Learning workspace, create and develop your first prompt flow, test and evaluate it, then deploy it to production.
Prerequisites
Make sure the default data store in your workspace is blob type.
If you secure prompt flow with virtual network, please follow Network isolation in prompt flow to learn more detail.
Set up connection
First you need to set up connection.
Connection helps securely store and manage secret keys or other sensitive credentials required for interacting with LLM (Large Language Models) and other external tools, for example, Azure Content Safety.
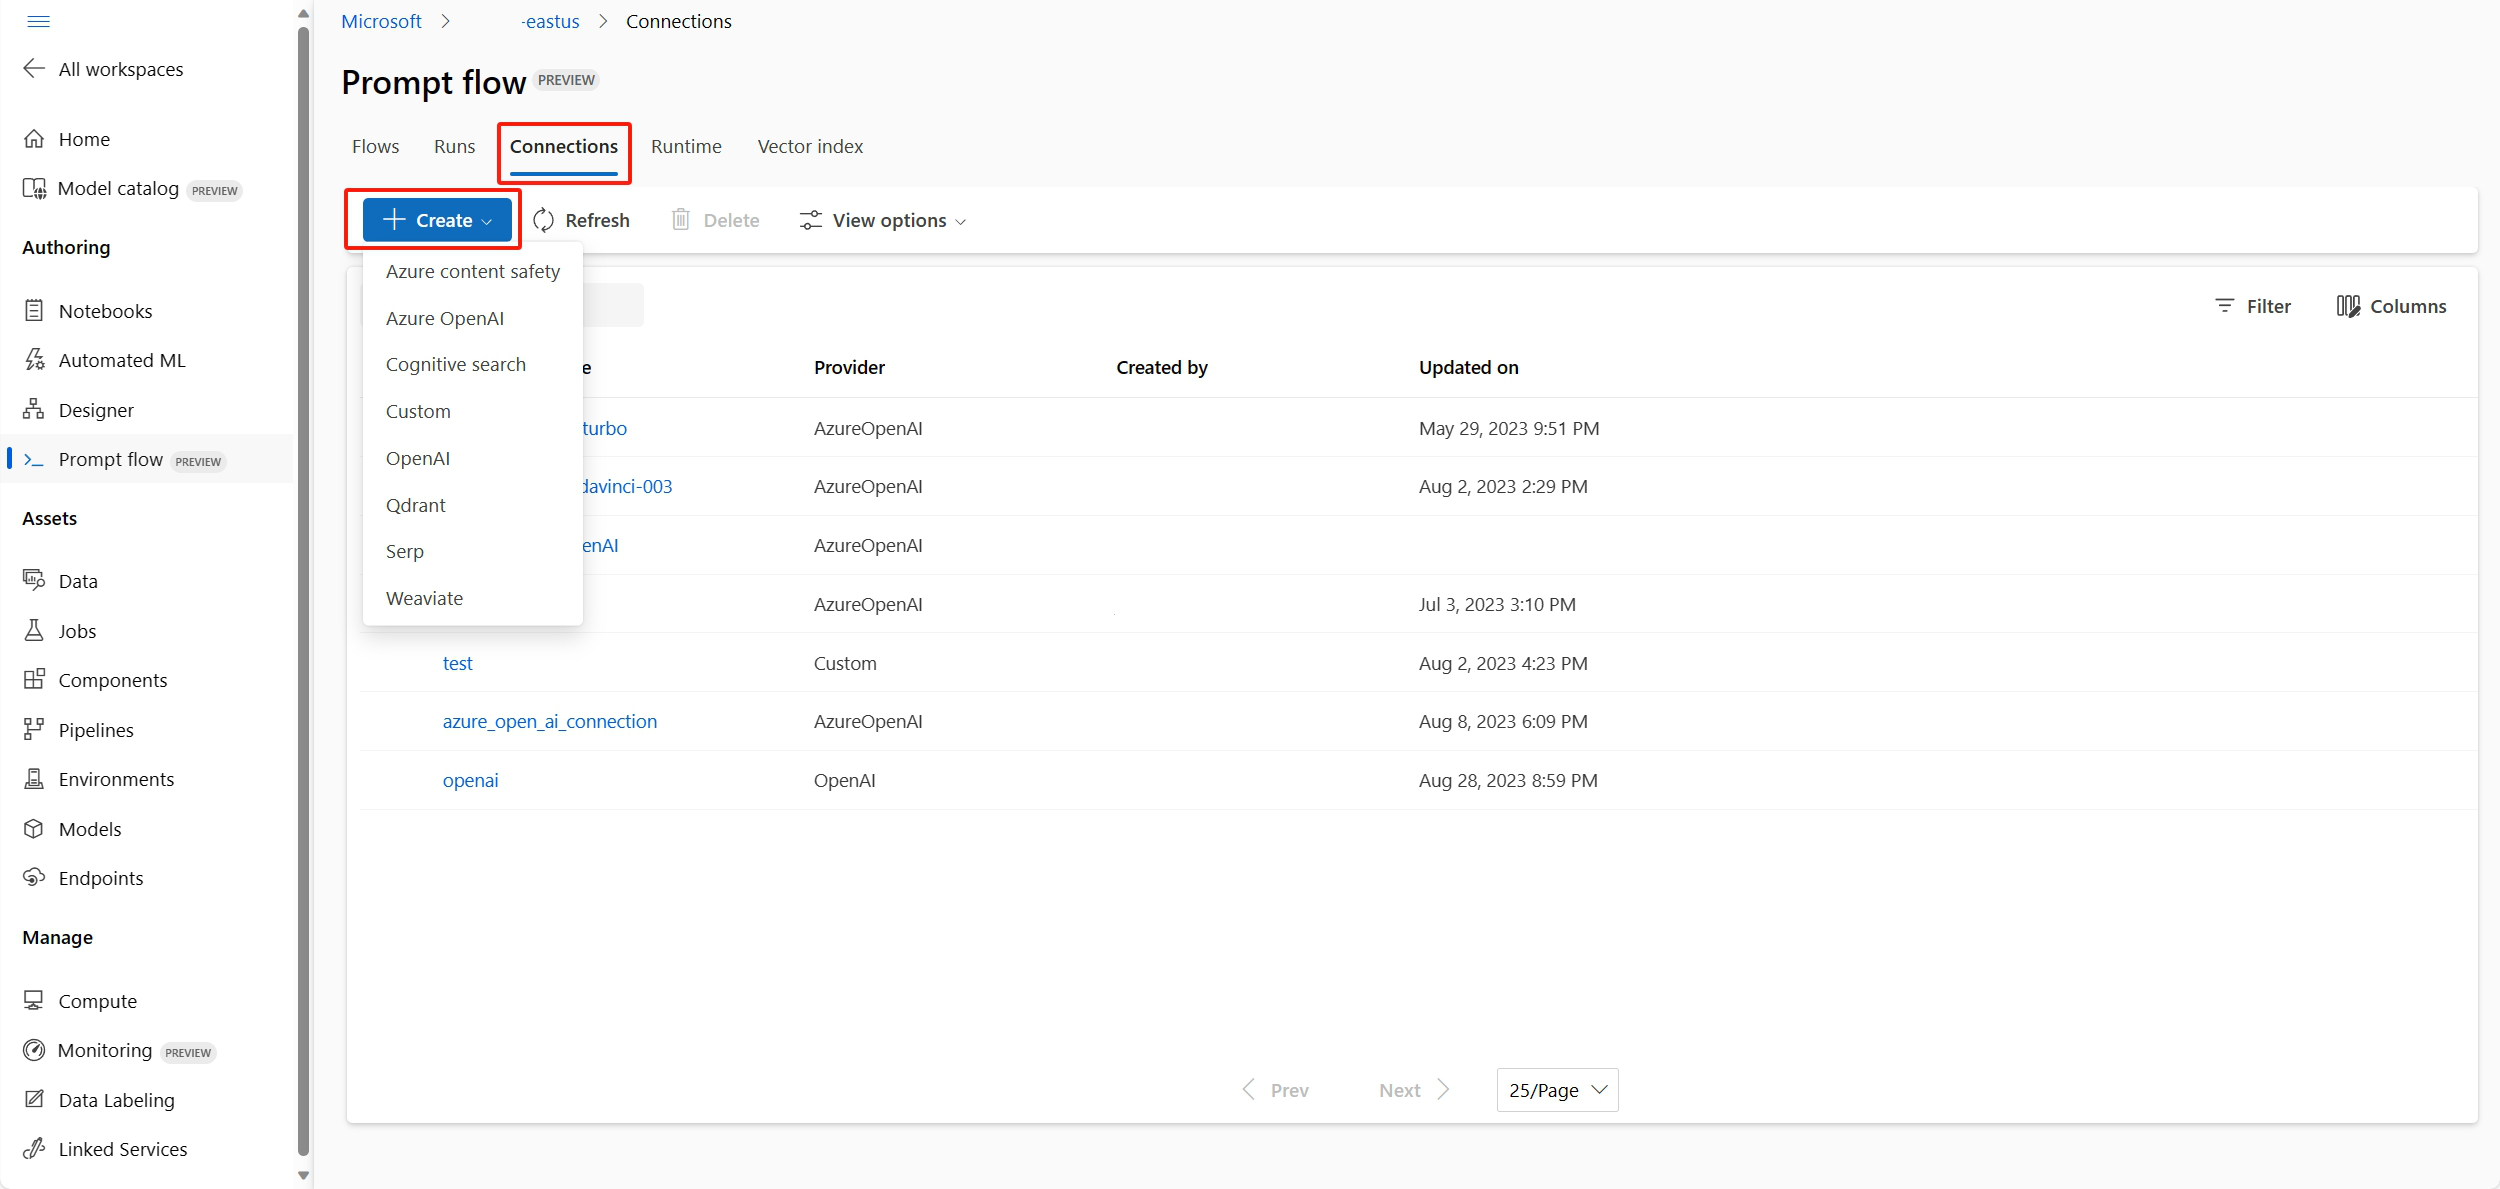
Navigate to the prompt flow homepage, select Connections tab. Connection is a shared resource to all members in the workspace. So, if you already see a connection whose provider is AzureOpenAI, you can skip this step, go to create runtime.
If you aren't already connected to AzureOpenAI, select the Create button then AzureOpenAI from the drop-down.
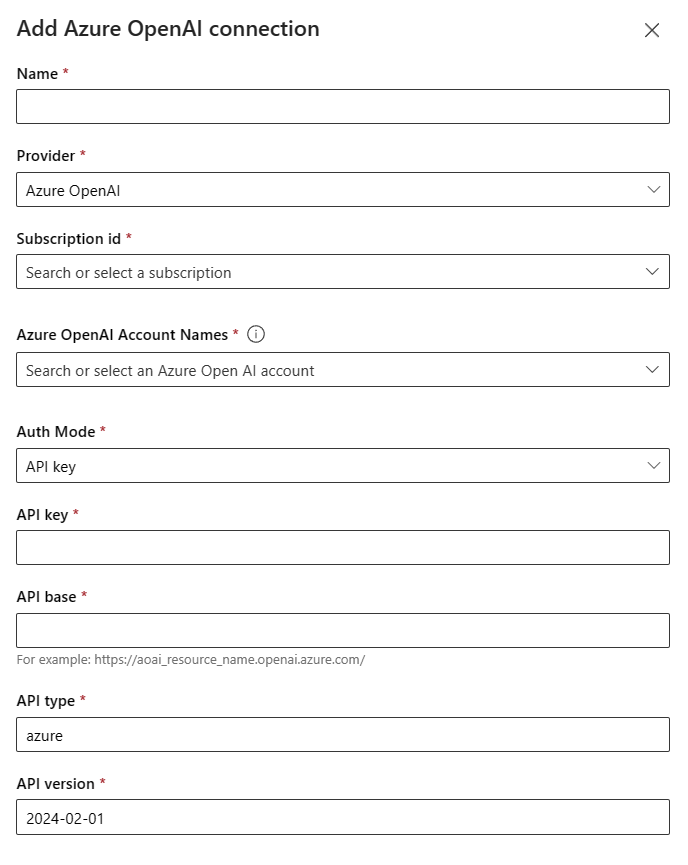
Then a right-hand panel will appear. Here, you'll need to select the subscription and resource name, provide the connection name, API key (if auth type equals to API key), API base, API type, and API version before selecting the Save button. Prompt flow also support Microsoft Entra ID as auth type for identity based auth for Azure OpenAI resource. Learn more about How to configure Azure OpenAI Service with managed identities.
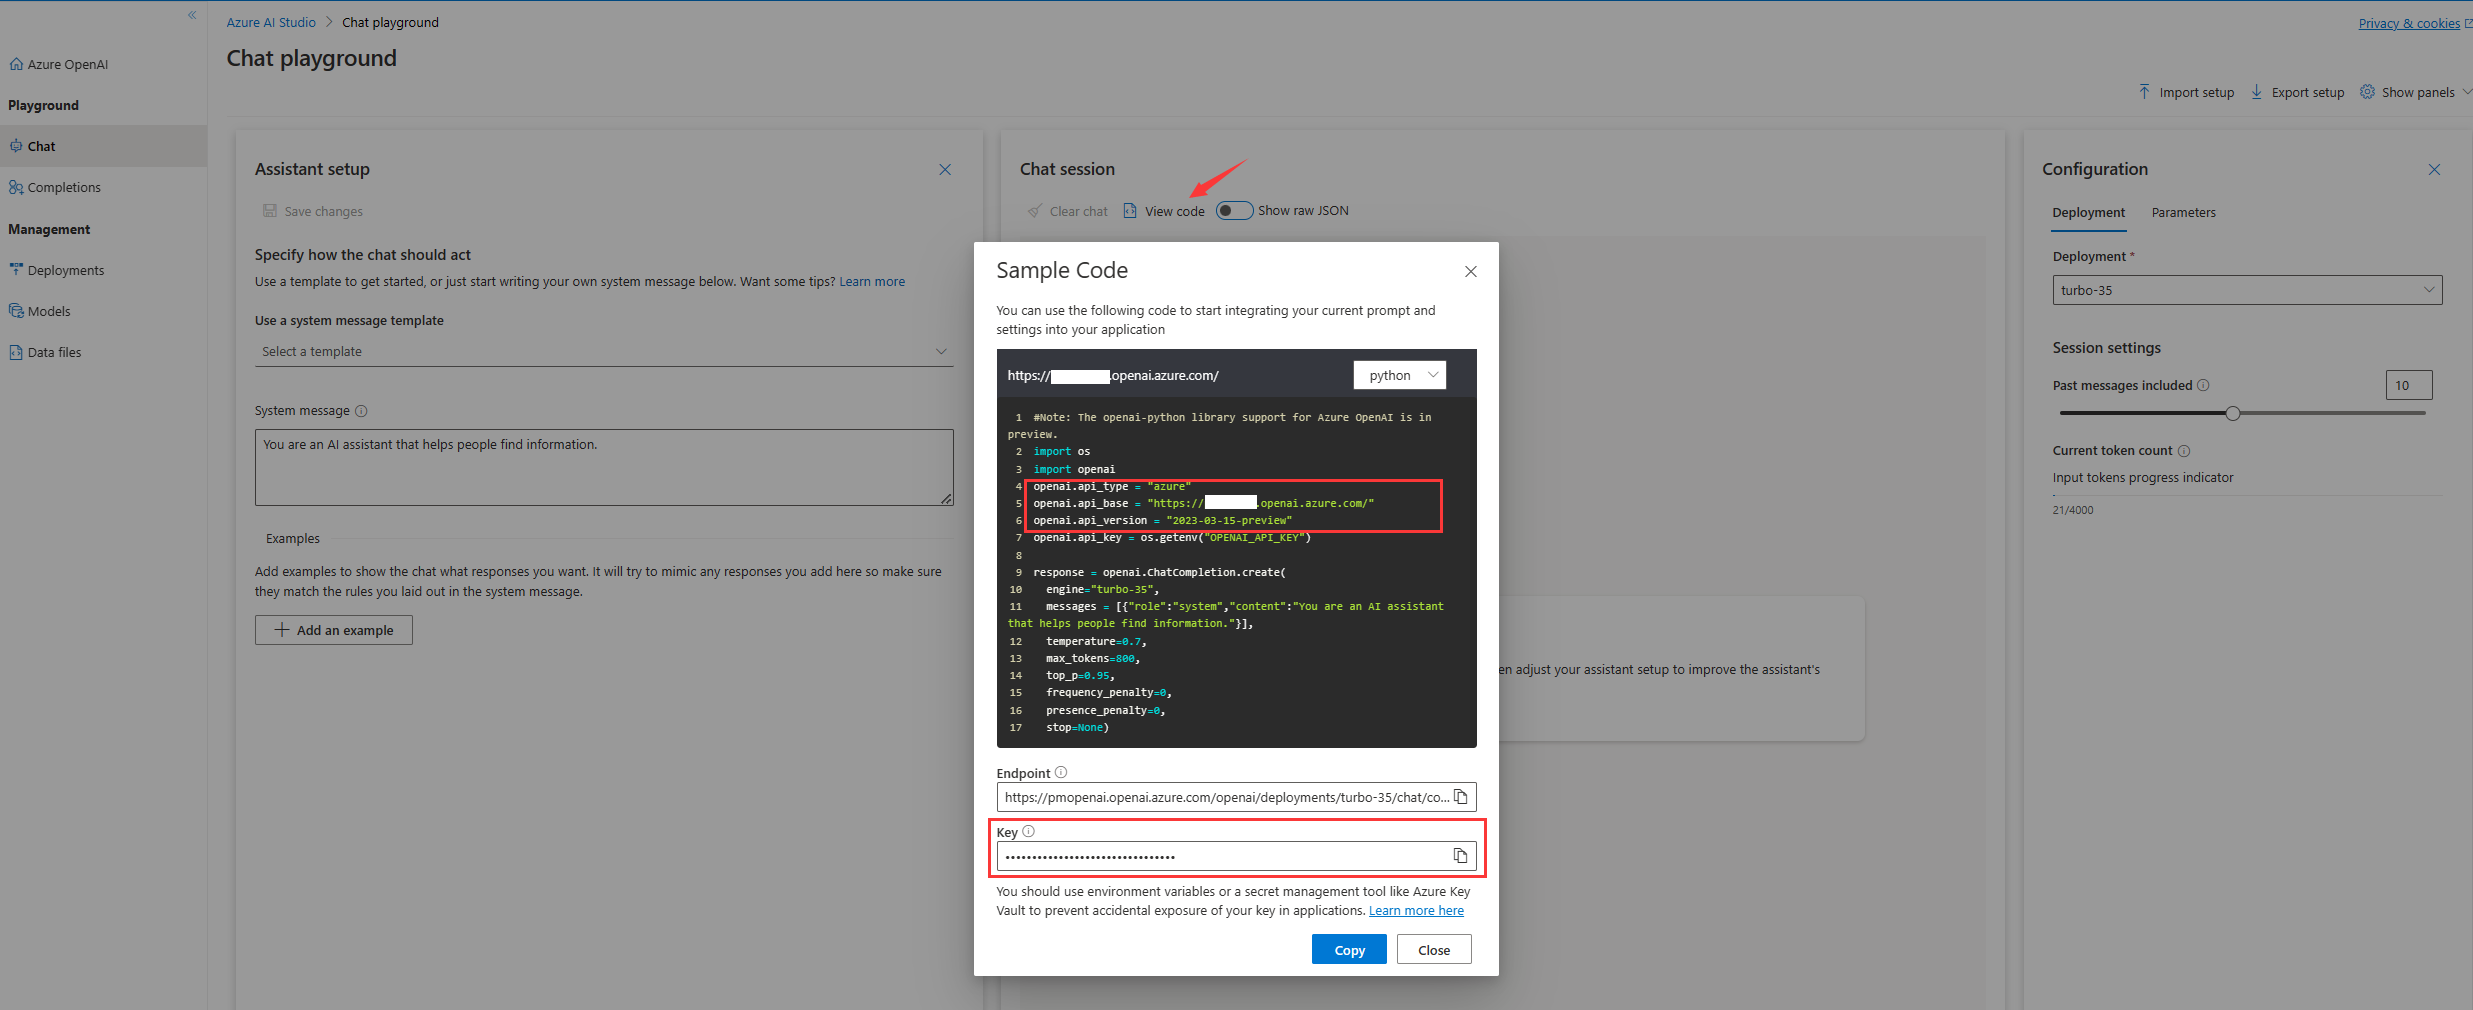
To obtain the API key, base, type, and version, you can navigate to the chat playground in the Azure OpenAI portal and select the View code button. From here, you can copy the necessary information and paste it into the connection creation panel.
After inputting the required fields, select Save to create the connection.
Create and develop your prompt flow
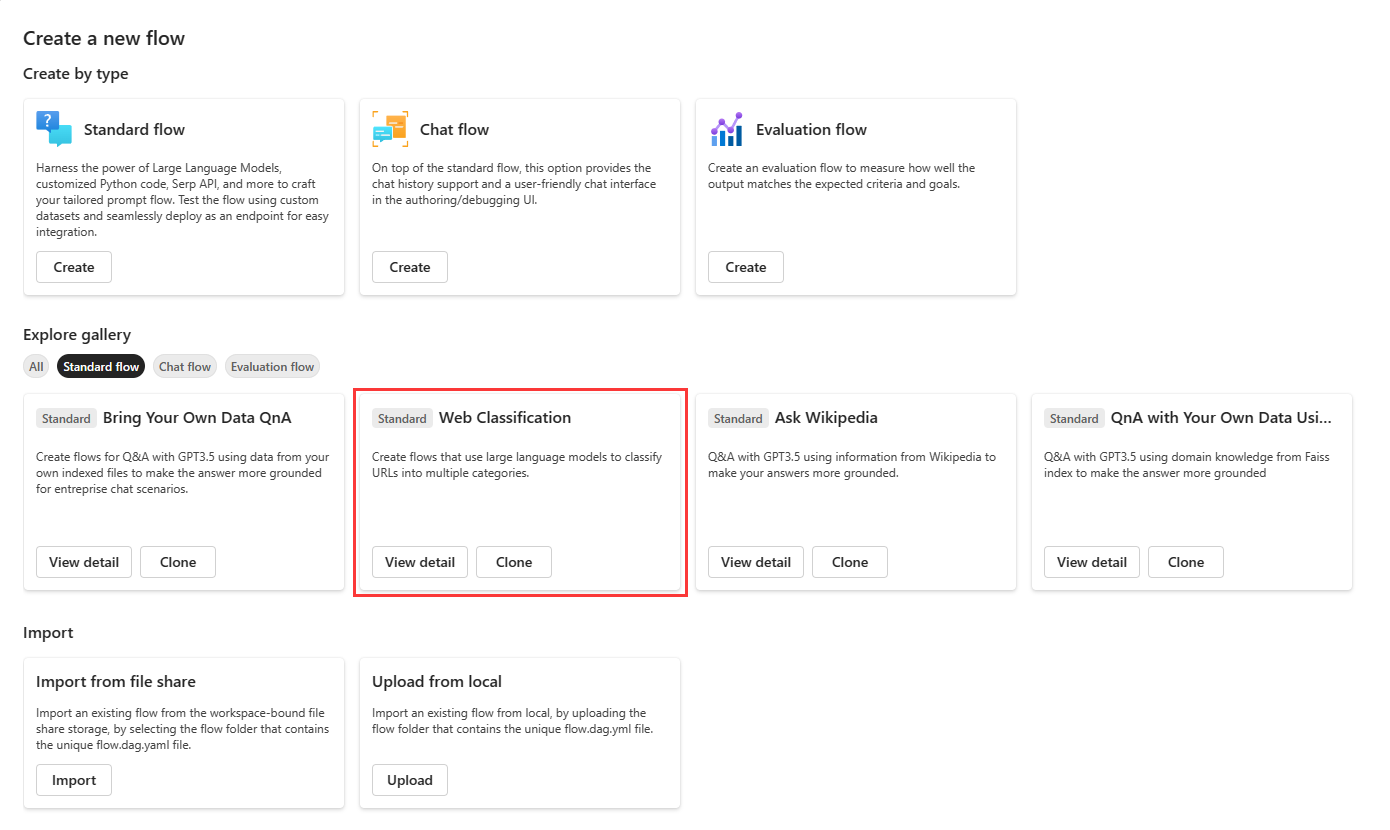
In Flows tab of prompt flow home page, select Create to create your first prompt flow. You can create a flow by cloning the samples in the gallery.
Clone from sample
The built-in samples are shown in the gallery.
In this guide, we'll use Web Classification sample to walk you through the main user journey. You can select View detail on Web Classification tile to preview the sample. Then a preview window is popped up. You can browse the sample introduction to see if the sample is similar to your scenario. Or you can just select Clone to clone the sample directly, then check the flow, test it, modify it.
After selecting Clone, a new flow is created, and saved in a specific folder within your workspace file share storage. You can customize the folder name according to your preferences in the right panel.
Start automatic runtime (preview)
Then you'll enter the flow authoring page. Before we dive in, please first start a runtime.
Runtime serves as the computing resources required for the application to run, including a Docker image that contains all necessary dependency packages. It's a must-have for flow execution.
For new users, we would recommend using the automatic runtime (preview) that can be used out of box, and you can easily customize the environment by adding packages in requirements.txt file in flow folder. Since starting the automatic runtime takes a while, we suggest you start it first before authoring the flow.
Flow authoring page
When the automatic runtime is creating, we can take a look at the flow authoring page.
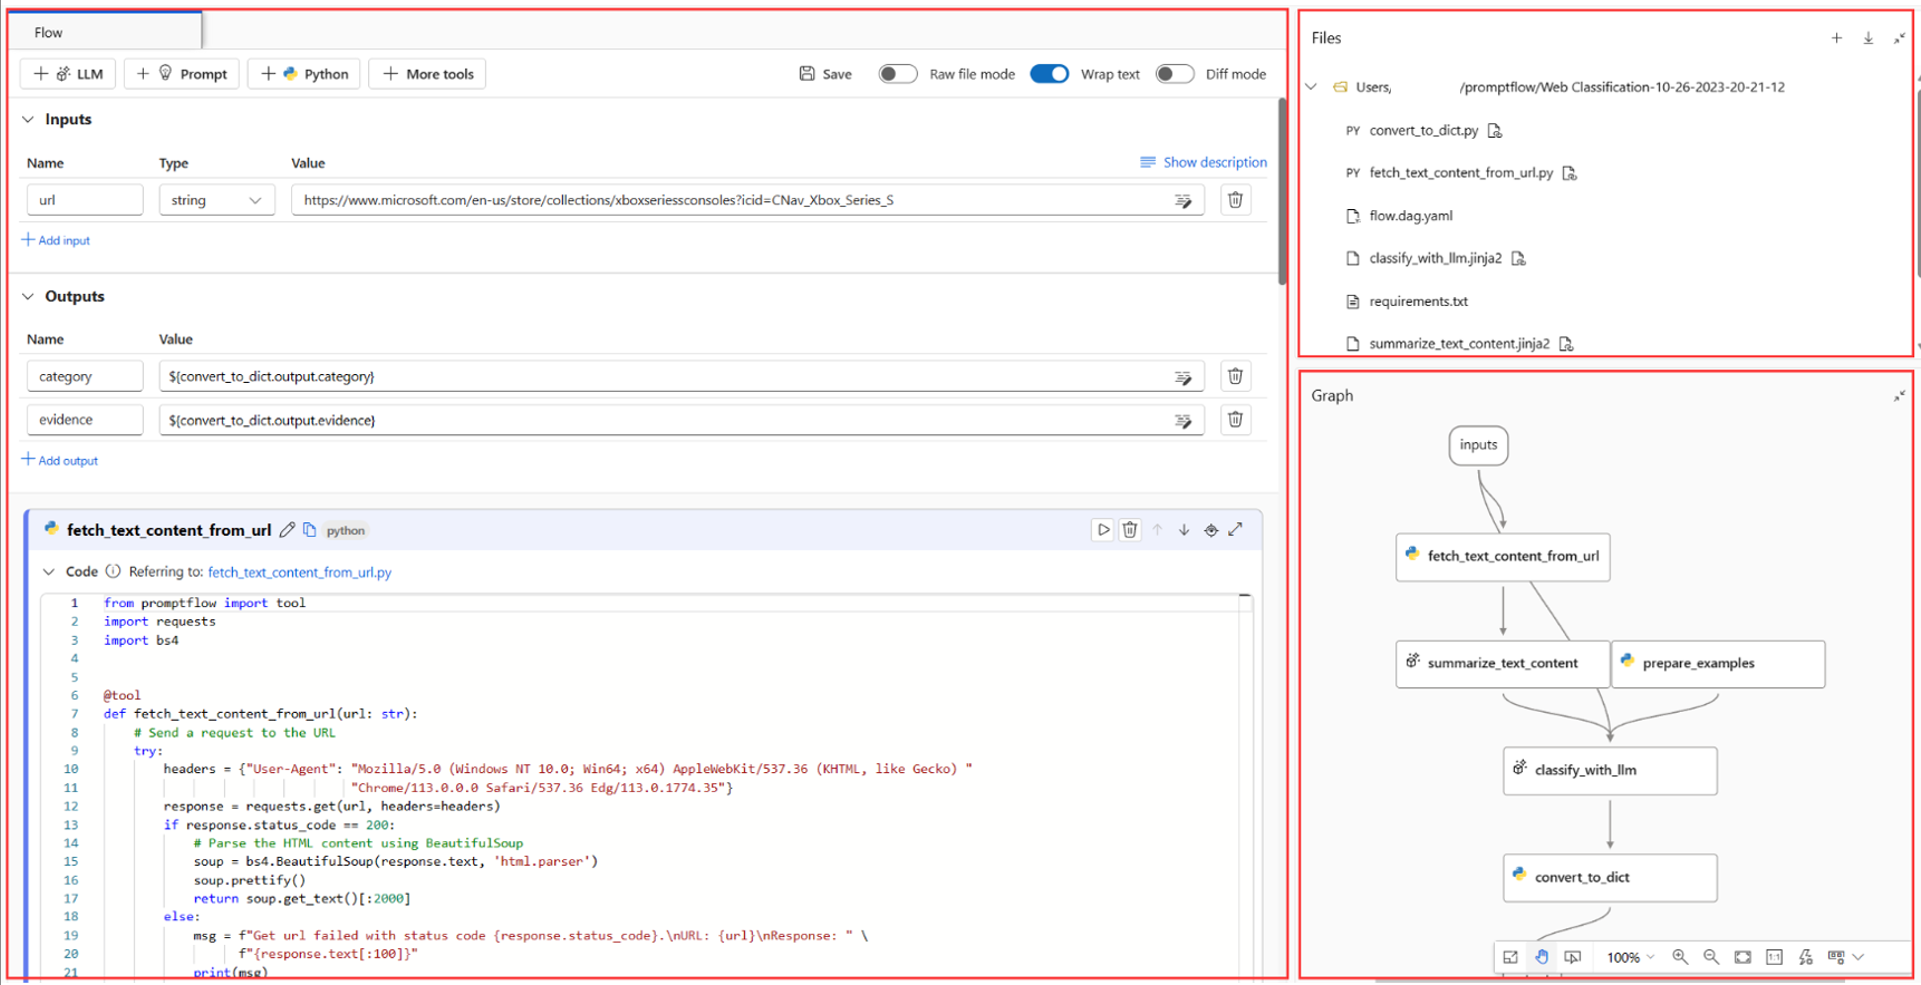
At the left of authoring page, it's the flatten view, the main working area where you can author the flow, for example add a new node, edit the prompt, select the flow input data, etc.
The top right corner shows the folder structure of the flow. Each flow has a folder that contains a flow.dag.yaml file, source code files, and system folders. You can export or import a flow easily for testing, deployment, or collaborative purposes.
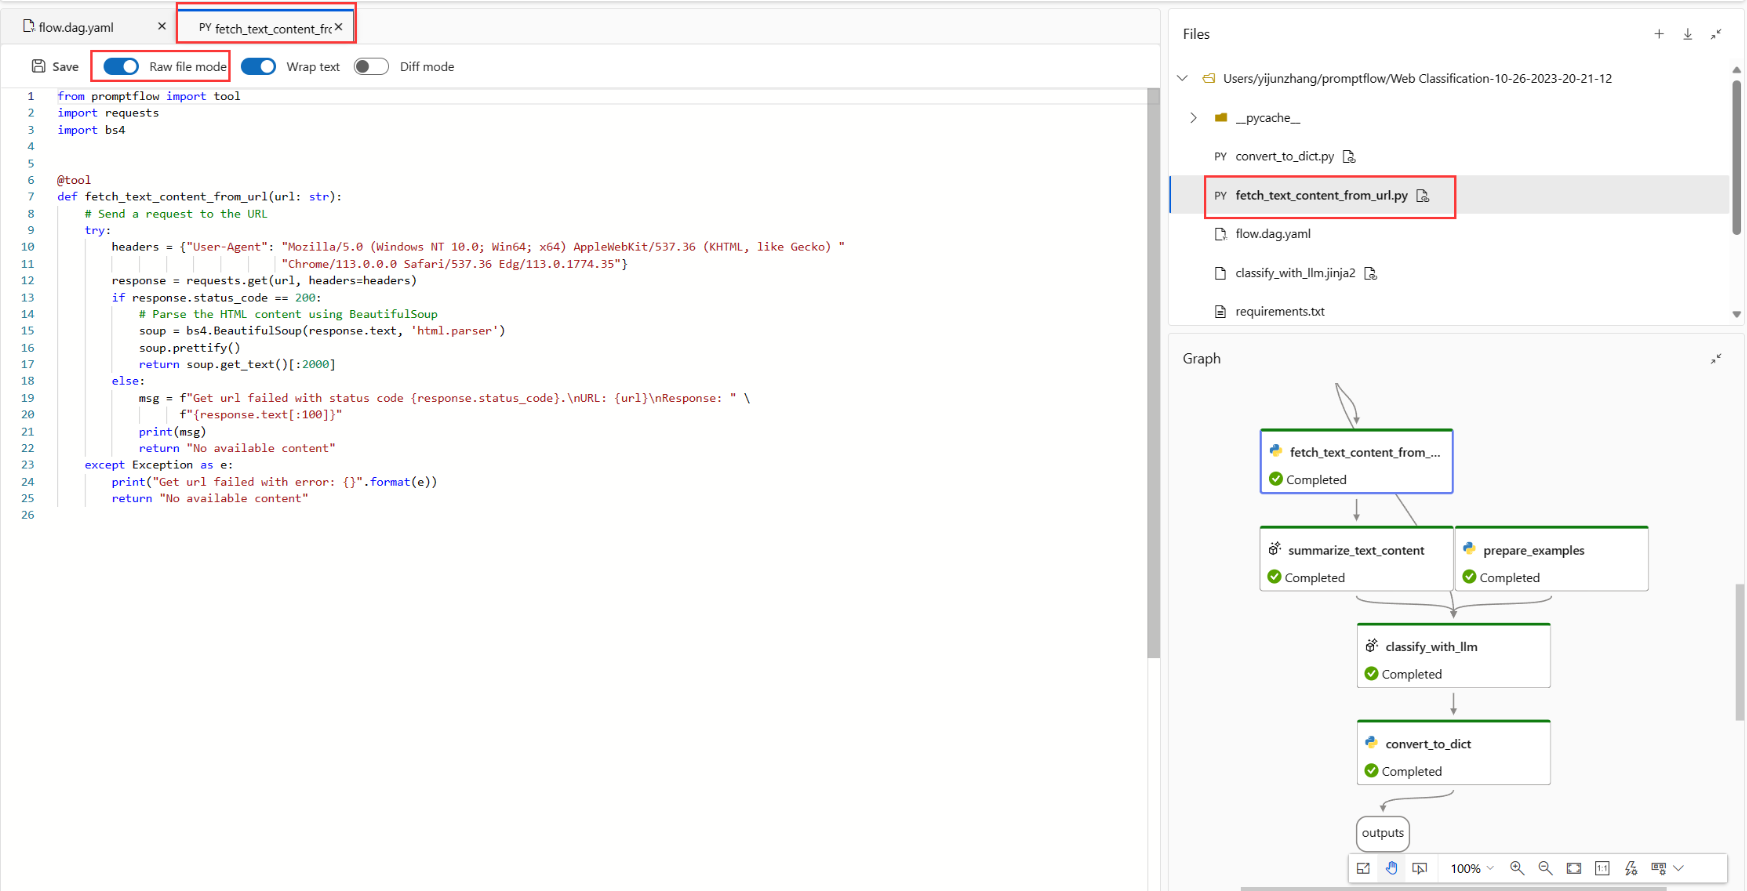
In addition to inline editing the node in the flatten view, you can also turn on the Raw file mode toggle and select the file name to edit the file in the opening file tab.
In the bottom right corner, it's the graph view for visualization only. You can zoom in, zoom out, auto layout, etc.
In this guide, we use Web Classification sample to walk you through the main user journey. Web Classification is a flow demonstrating multi-class classification with LLM. Given a URL, it will classify the URL into a web category with just a few shots, simple summarization and classification prompts. For example, given "https://www.imdb.com/", it will classify this URL into "Movie".
In the graph view, you can see how the sample flow looks like. The input is a URL to classify, then it uses a Python script to fetch text content from the URL, use LLM to summarize the text content within 100 words, then classify based on the URL and summarized text content, last use Python script to convert LLM output into a dictionary. The prepare_examples node is to feed few-shot examples to classification node's prompt.
Flow input data
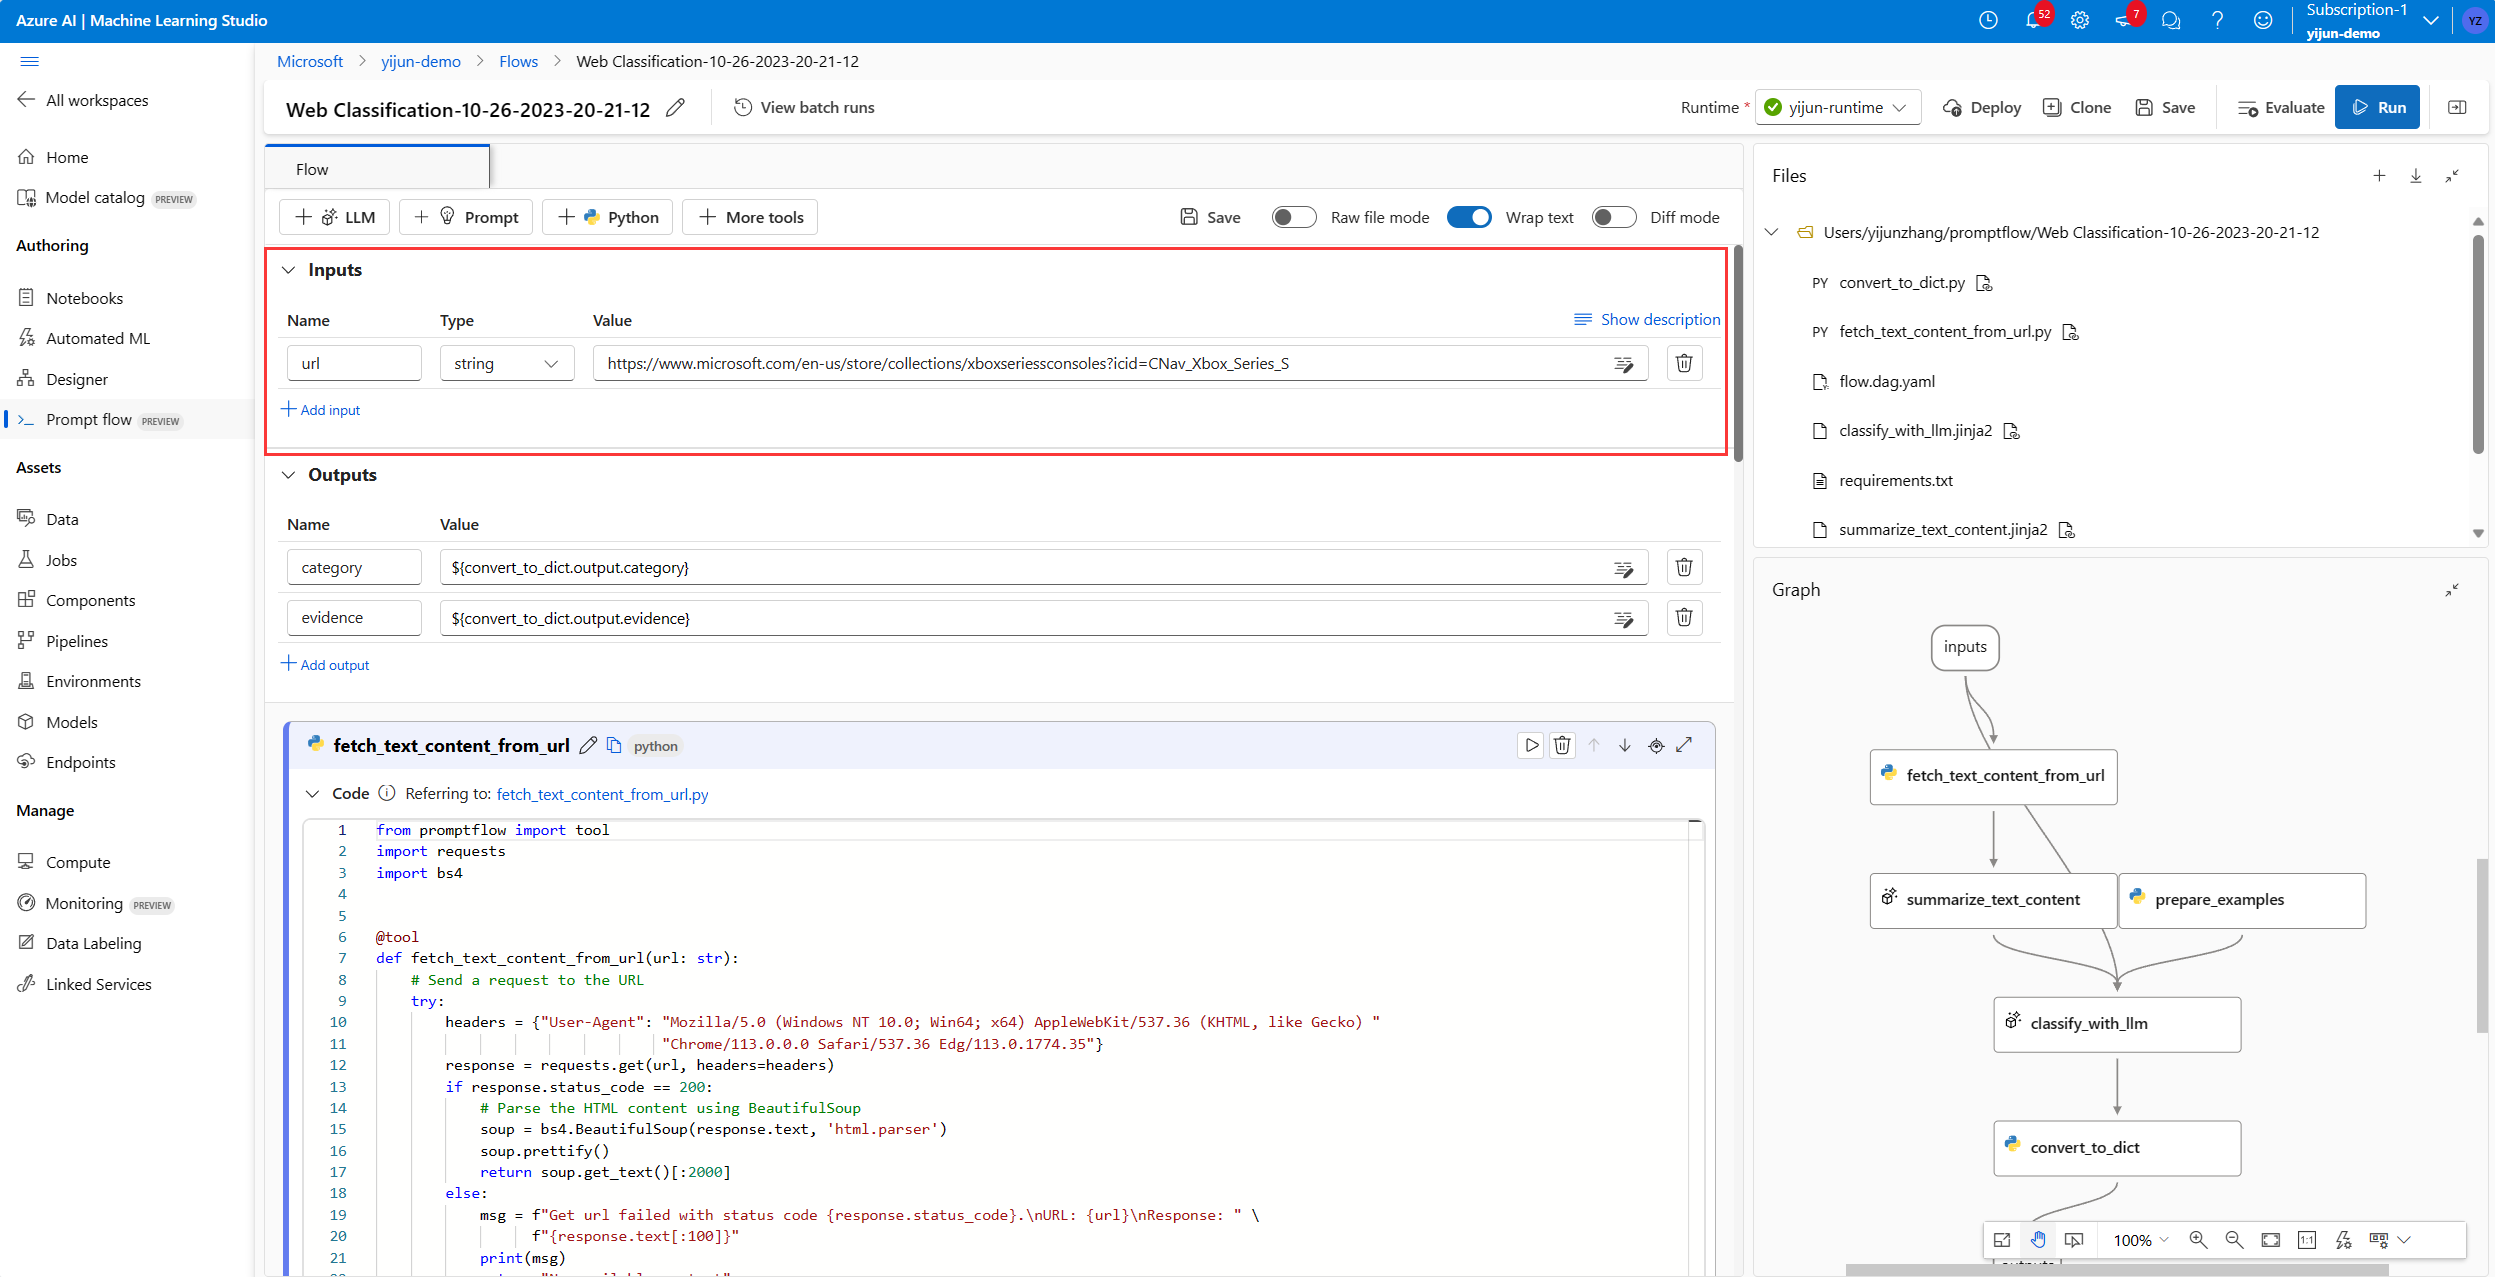
When unfolding Inputs section, you can create and view inputs. For Web Classification sample as shown the screenshot below, the flow input is a URL of string type.
The input schema (name: url; type: string) and value are already set when cloning samples. You can change to another value manually, for example "https://www.imdb.com/".
Set up LLM nodes
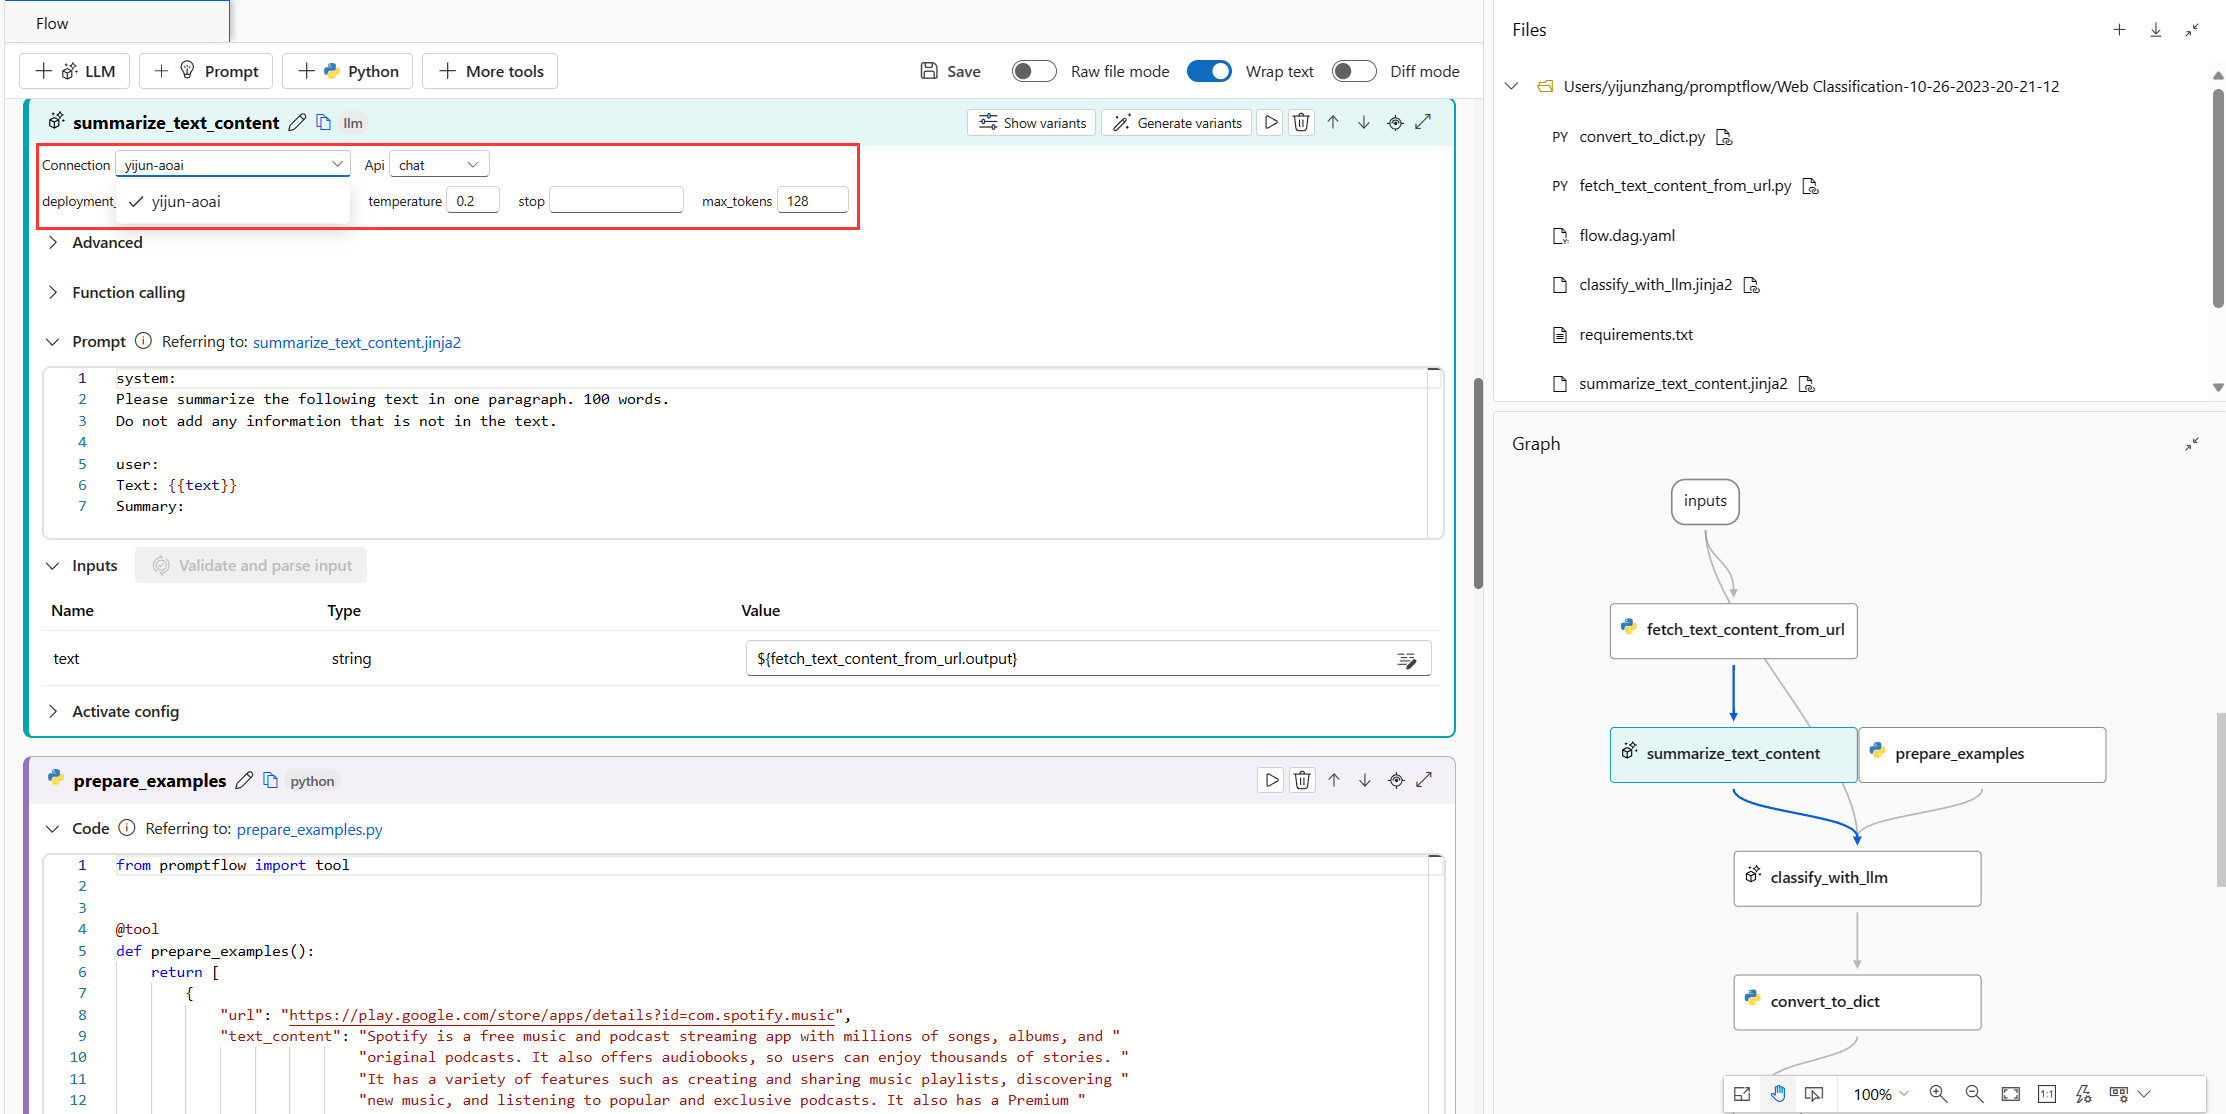
For each LLM node, you need to select a connection to set your LLM API keys.
For this example, make sure API type is chat since the prompt example we provide is for chat API. To learn the prompt format difference of chat and completion API, see Develop a flow.
Then depending on the connection type you selected, you need to select a deployment or a model. If you use Azure OpenAI connection, you need to select a deployment in drop-down (If you don't have a deployment, create one in Azure OpenAI portal by following Create a resource and deploy a model using Azure OpenAI). If you use OpenAI connection, you need to select a model.
We have two LLM nodes (summarize_text_content and classify_with_llm) in the flow, so you need to set up for each respectively.
Run single node
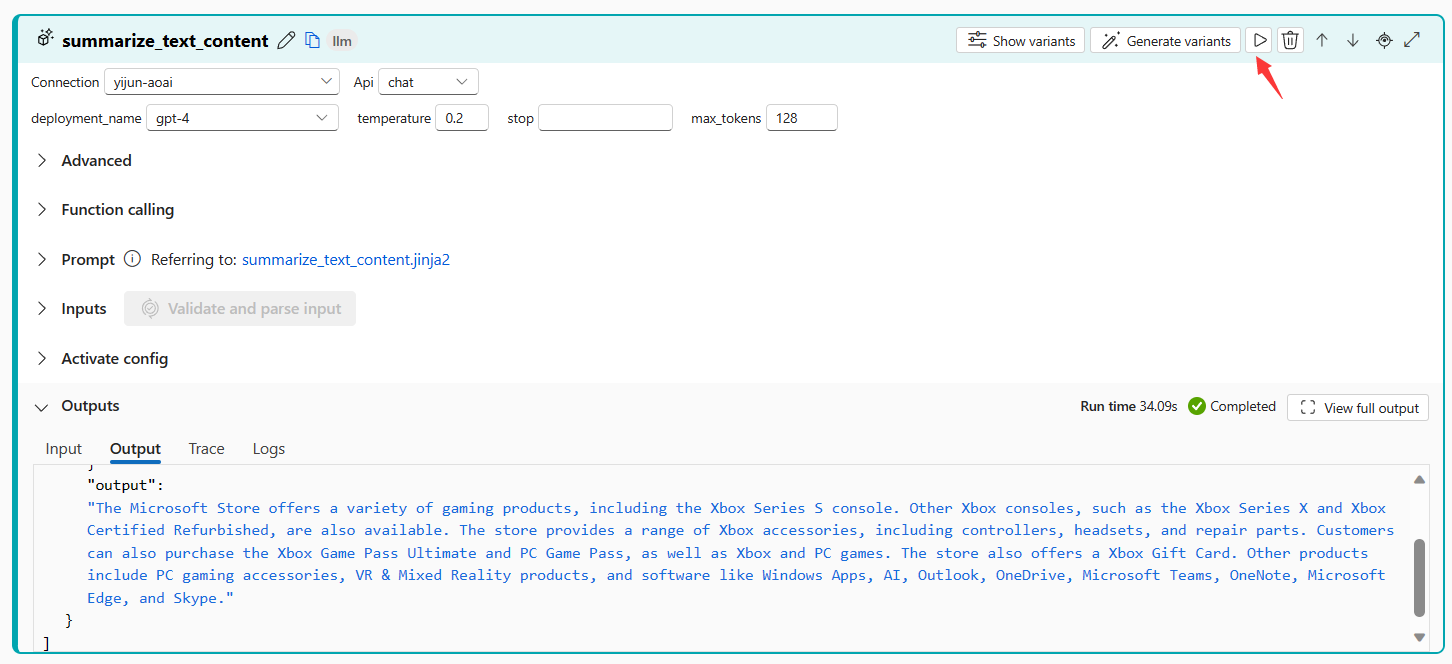
To test and debug a single node, select the Run icon on node in flatten view. Run status is shown at the very top, once running completed, check output in node output section.
Run fetch_text_content_from_url then summarize_text_content, check if the flow can successfully fetch content from web, and summarize the web content.
The single node status is shown in the graph view as well. You can also change the flow input URL to test the node behavior for different URLs.
Run the whole flow
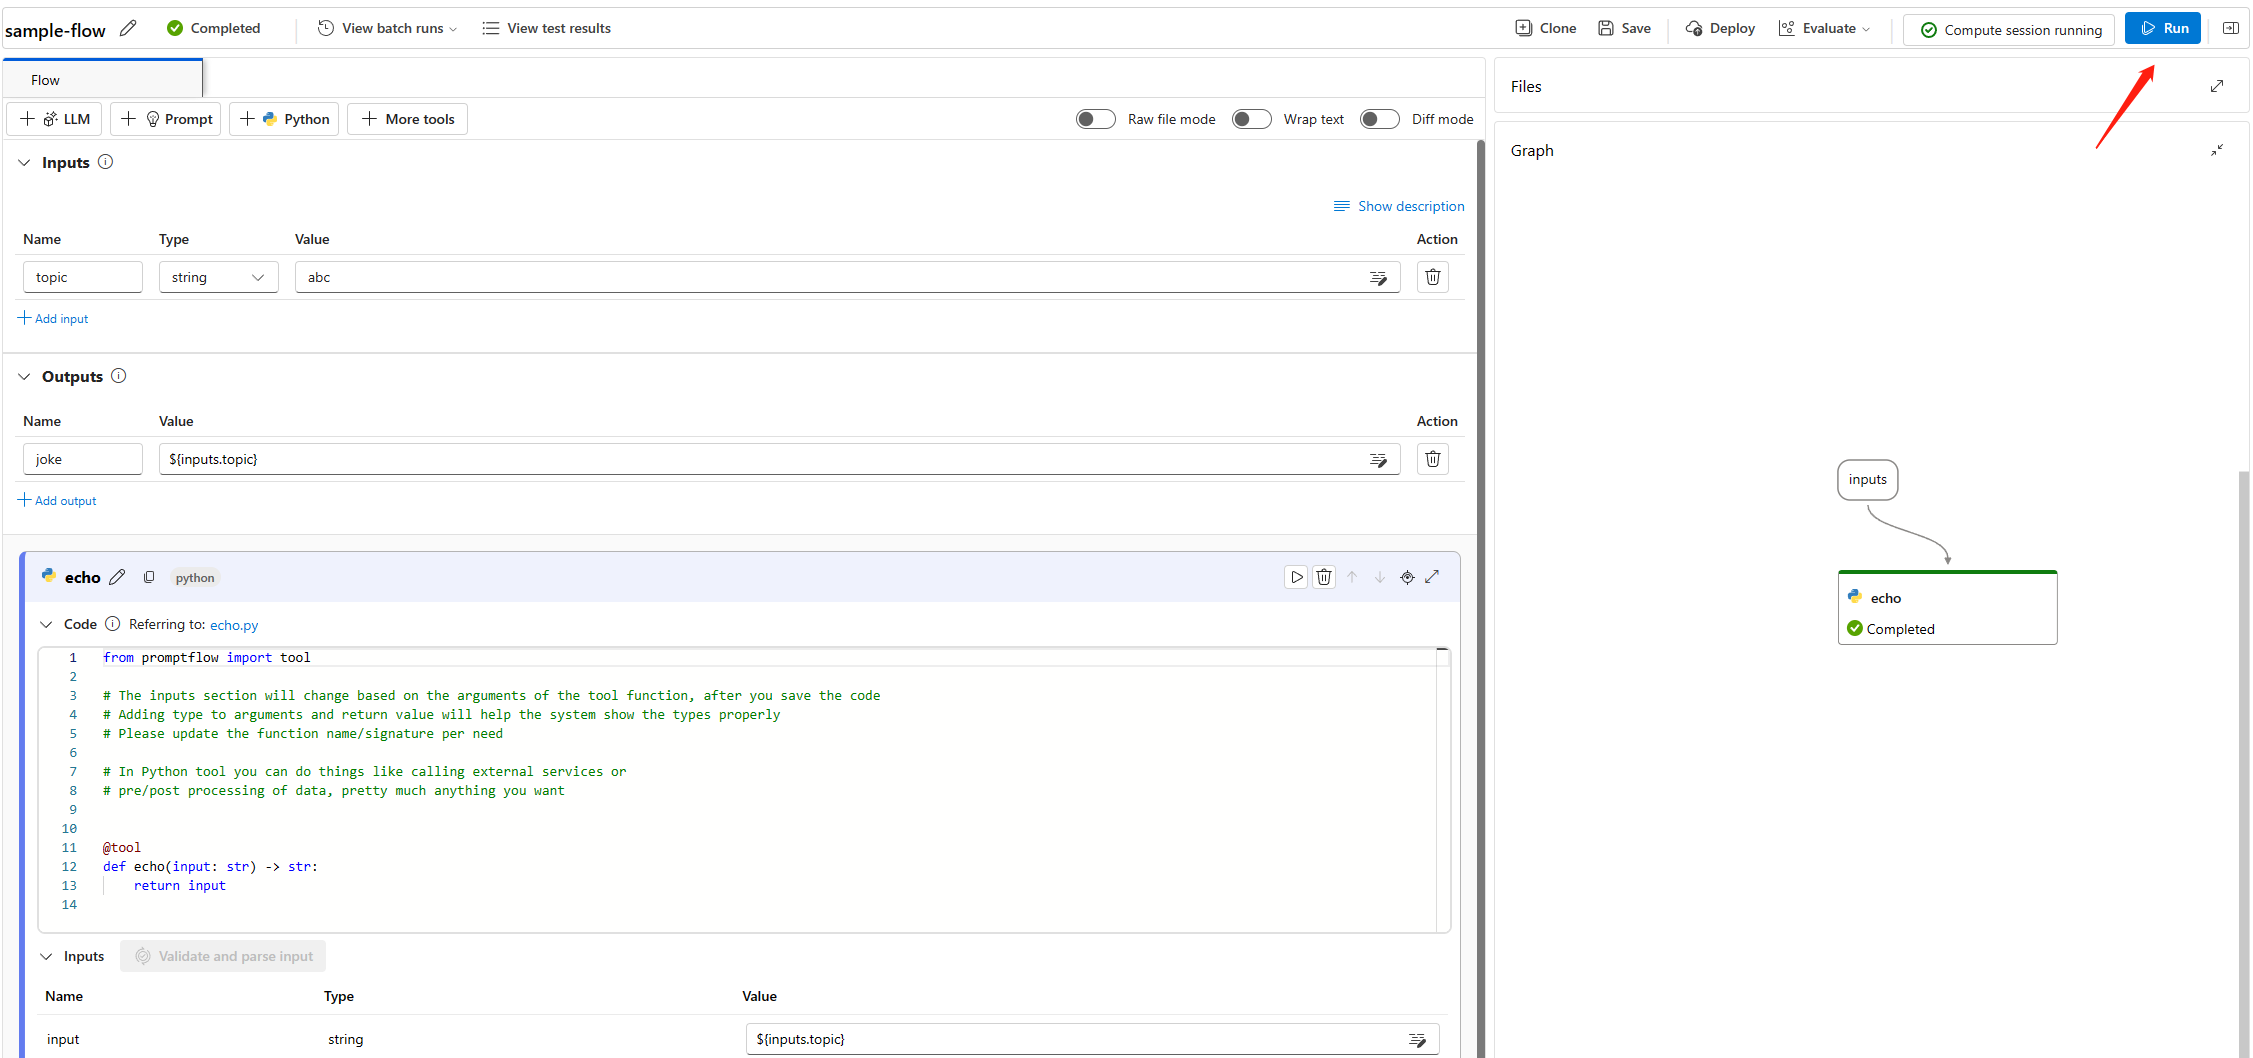
To test and debug the whole flow, select the Run button at the right top.
Then you can check the run status and output of each node. The node statuses are shown in the graph view as well. Similarly, you can change the flow input URL to test how the flow behaves for different URLs.
Set and check flow output
Instead of checking outputs on each node, you can also set flow output and check outputs of multiple nodes in one place. Moreover, flow output helps:
- Check bulk test results in one single table
- Define evaluation interface mapping
- Set deployment response schema
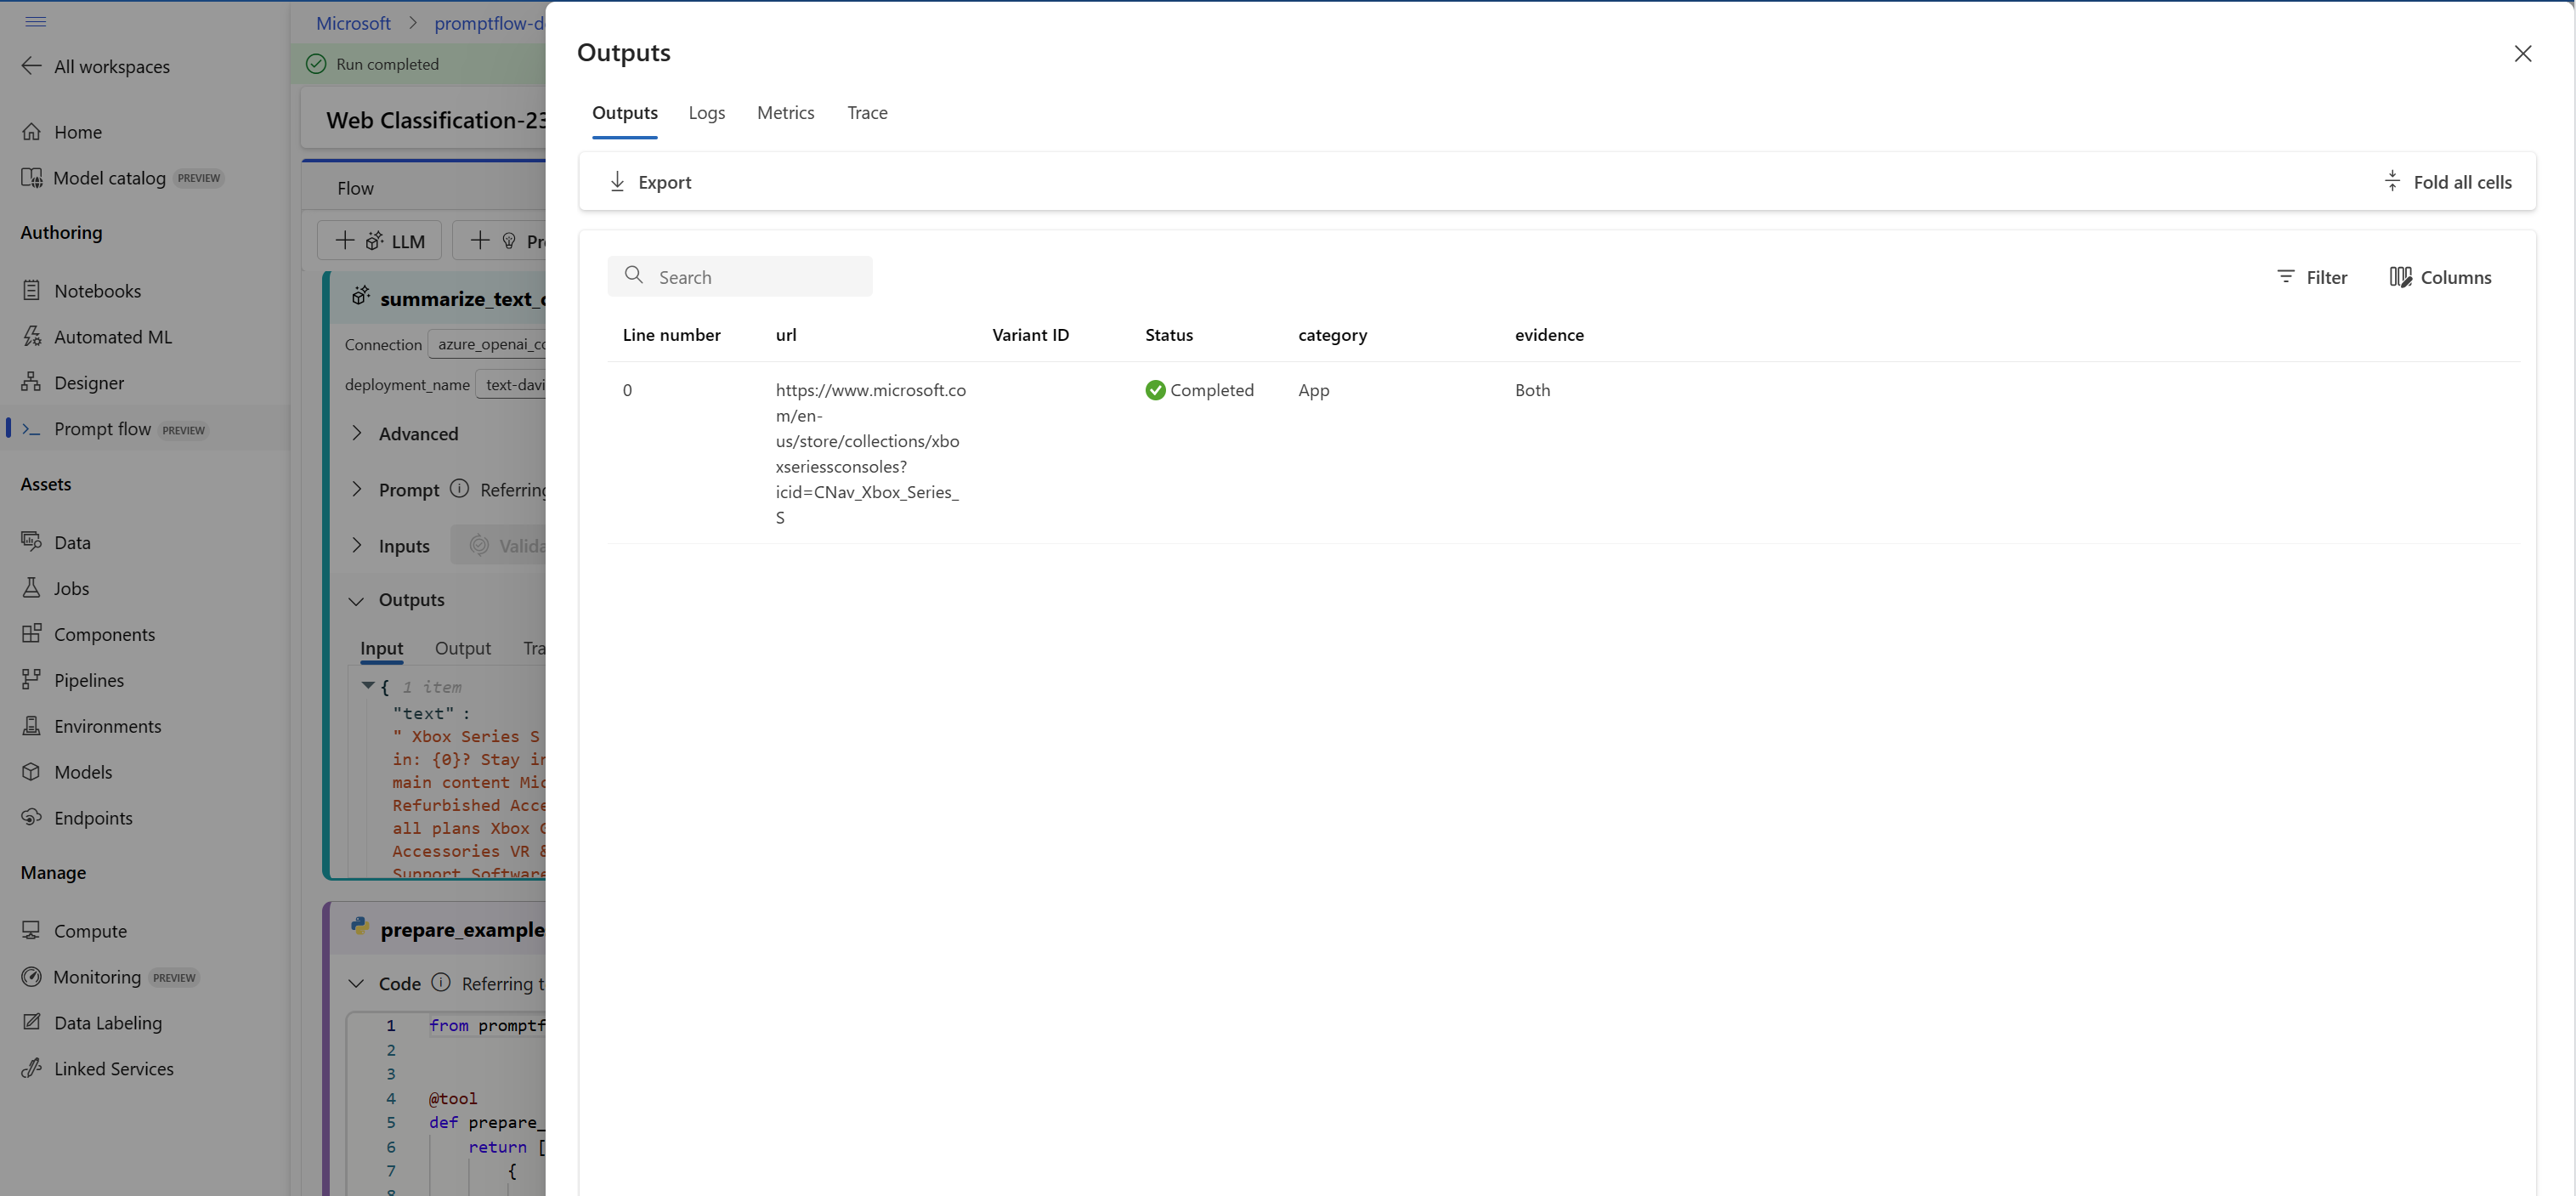
When you clone the sample, the flow outputs (category and evidence) are already set. You can select View outputs to check the outputs in a table.
You can see that the flow predicts the input URL with a category and evidence.
Test and evaluation
After the flow run successfully with a single row of data, you might want to test if it performs well in large set of data, you can run a bulk test and choose some evaluation methods then check the metrics.
Prepare data
You need to prepare test data first. We support csv, tsv, and jsonl file for now.
Go to GitHub to download "data.csv", the golden dataset for Web Classification sample.
Evaluate
Select Evaluate button next to Run button, then a right panel pops up. It's a wizard that guides you to submit a batch run and to select the evaluation method (optional).
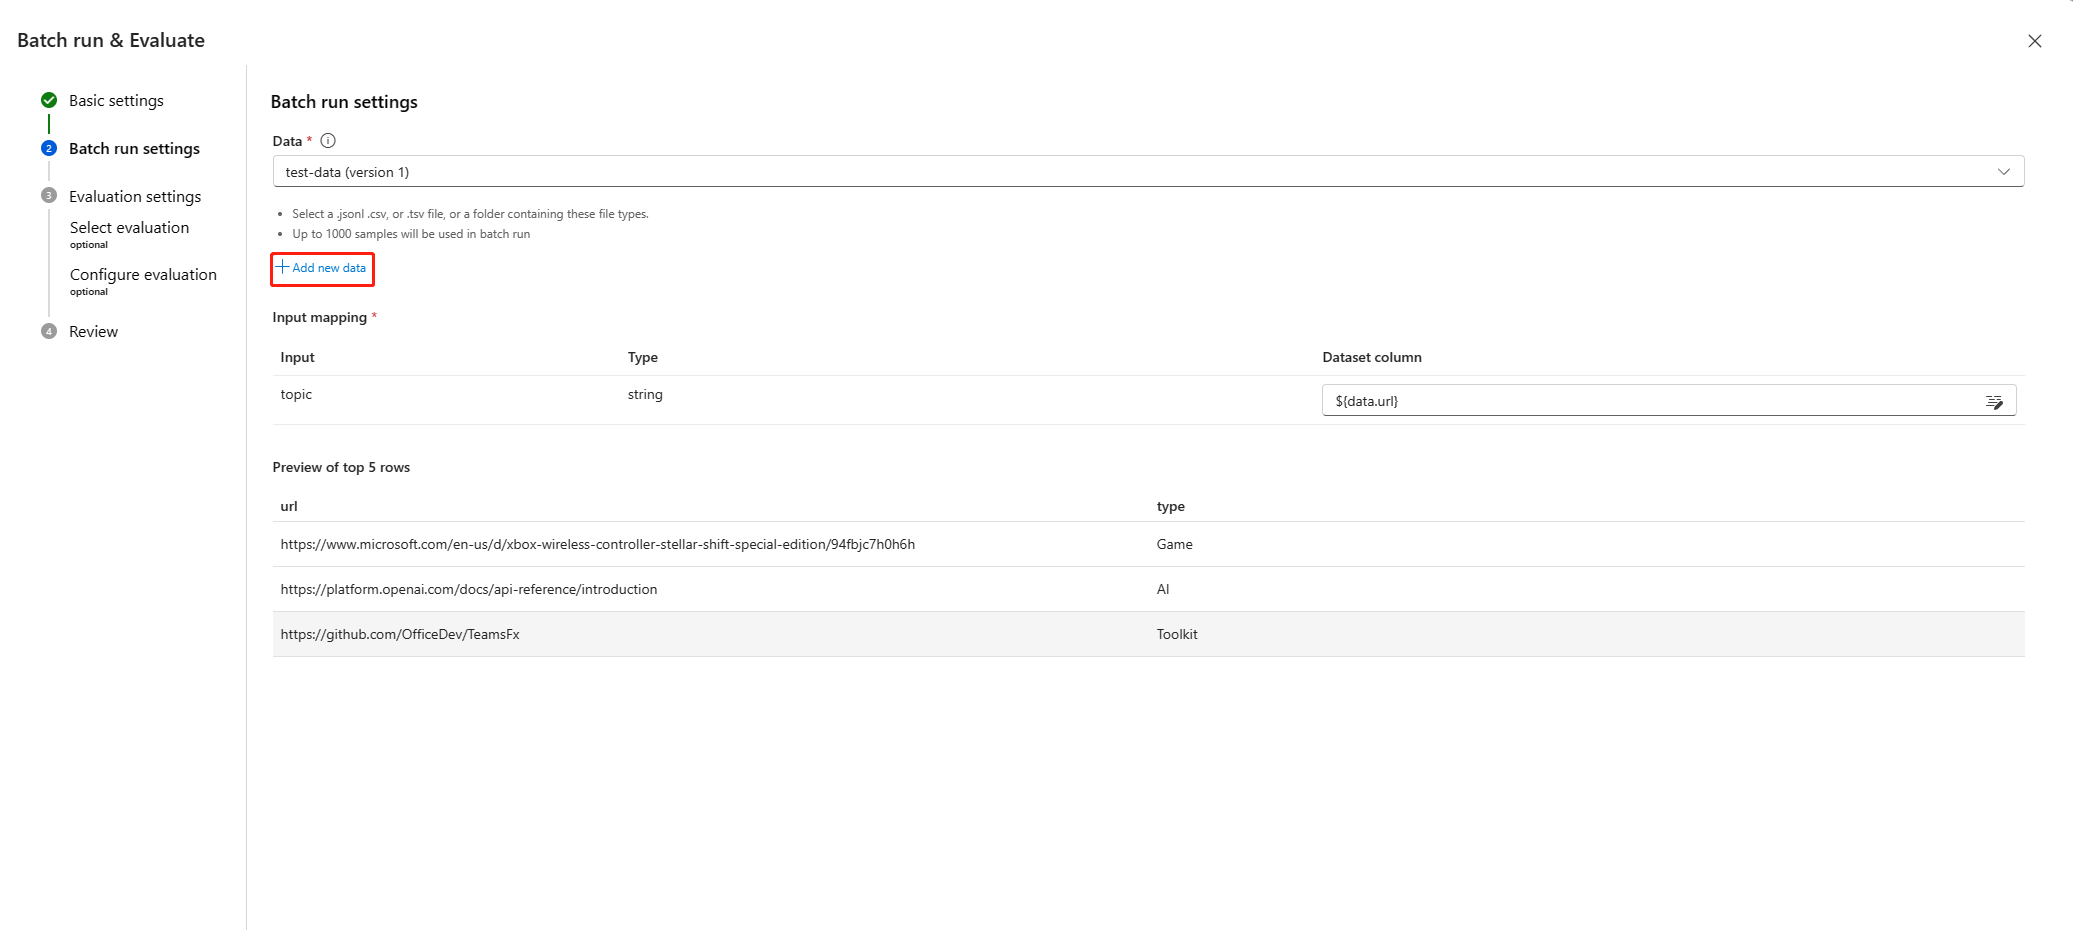
You need to set a batch run name, description, select a runtime, then select Add new data to upload the data you just downloaded. After uploading the data or if your colleagues in the workspace already created a dataset, you can choose the dataset from the drop-down and preview first five rows. The dataset selection drop down supports search and autosuggestion.
In addition, the input mapping supports mapping your flow input to a specific data column in your dataset, which means that you can use any column as the input, even if the column names don't match.
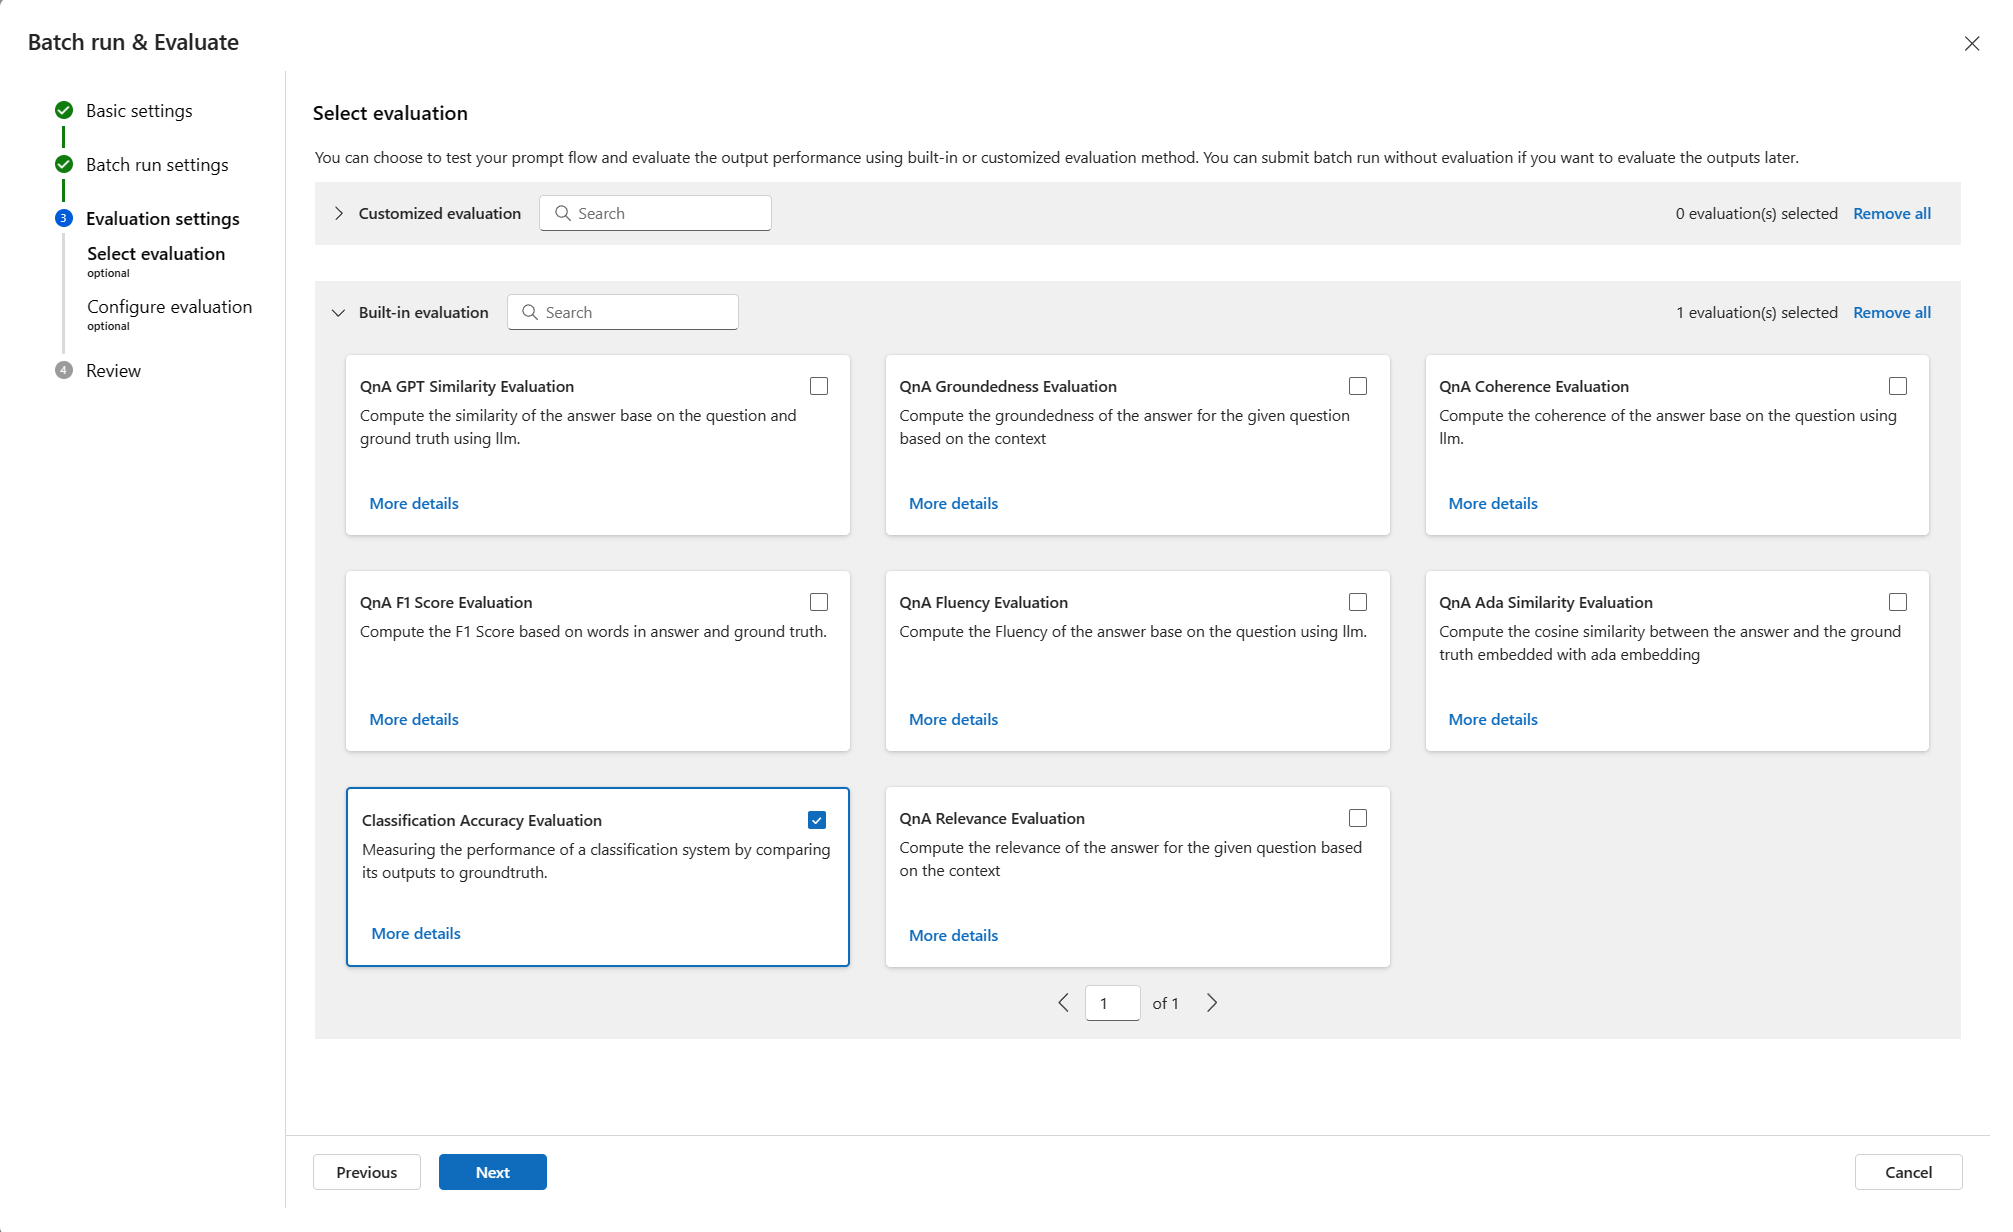
Next, select one or multiple evaluation methods. The evaluation methods are also flows that use Python or LLM etc., to calculate metrics like accuracy, relevance score. The built-in evaluation flows and customized ones are listed in the page. Since Web classification is a classification scenario, it's suitable to select the Classification Accuracy Evaluation to evaluate.
If you're interested in how the metrics are defined for built-in evaluation methods, you can preview the evaluation flows by selecting More details.
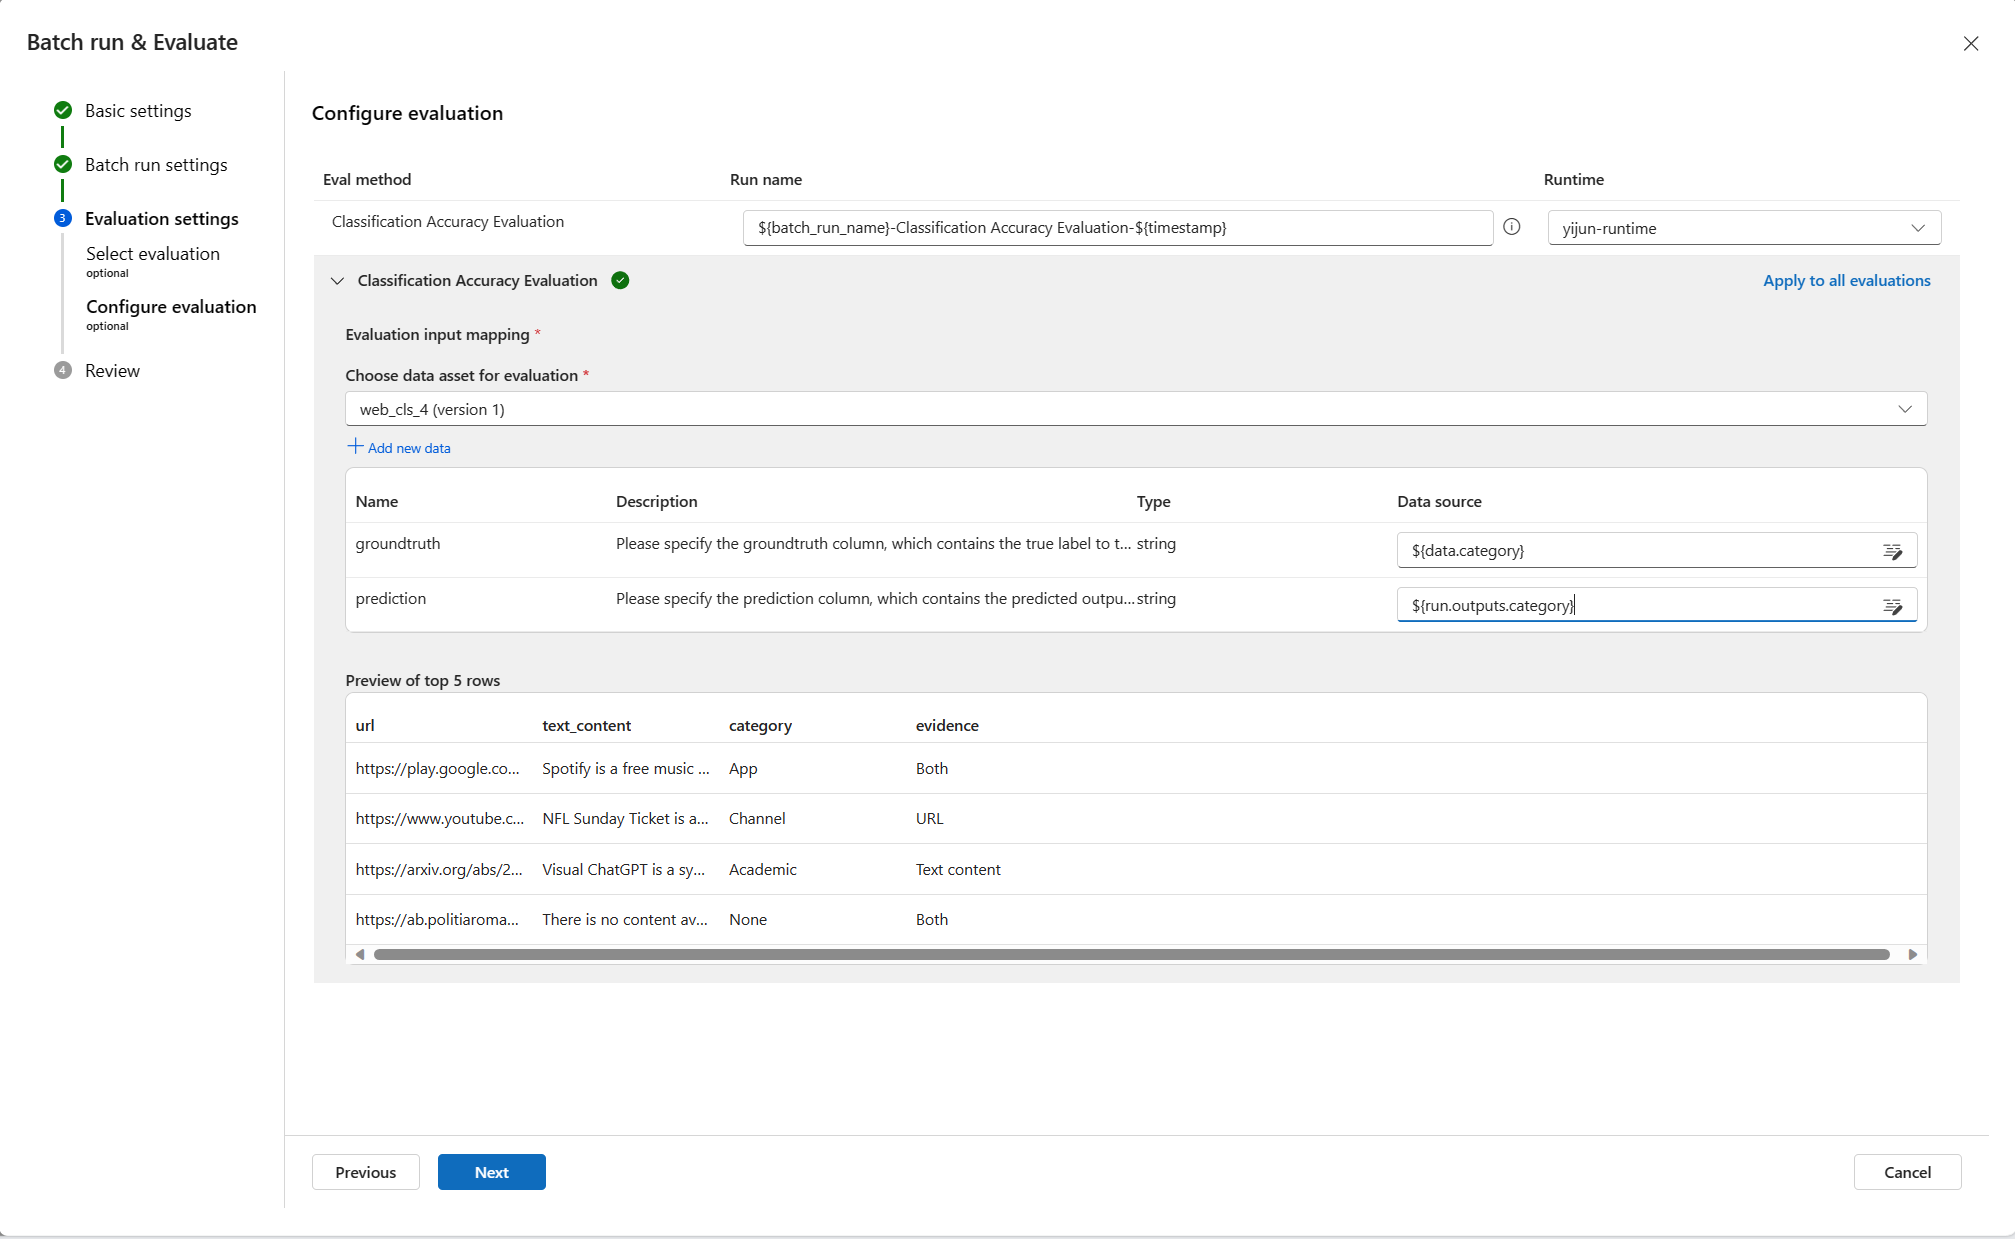
After selecting Classification Accuracy Evaluation as evaluation method, you can set interface mapping to map the ground truth to flow input and prediction to flow output.
Then select Review + submit to submit a batch run and the selected evaluation.
Check results
When your run have been submitted successfully, select View run list to navigate to the batch run list of this flow.
The batch run might take a while to finish. You can Refresh the page to load the latest status.
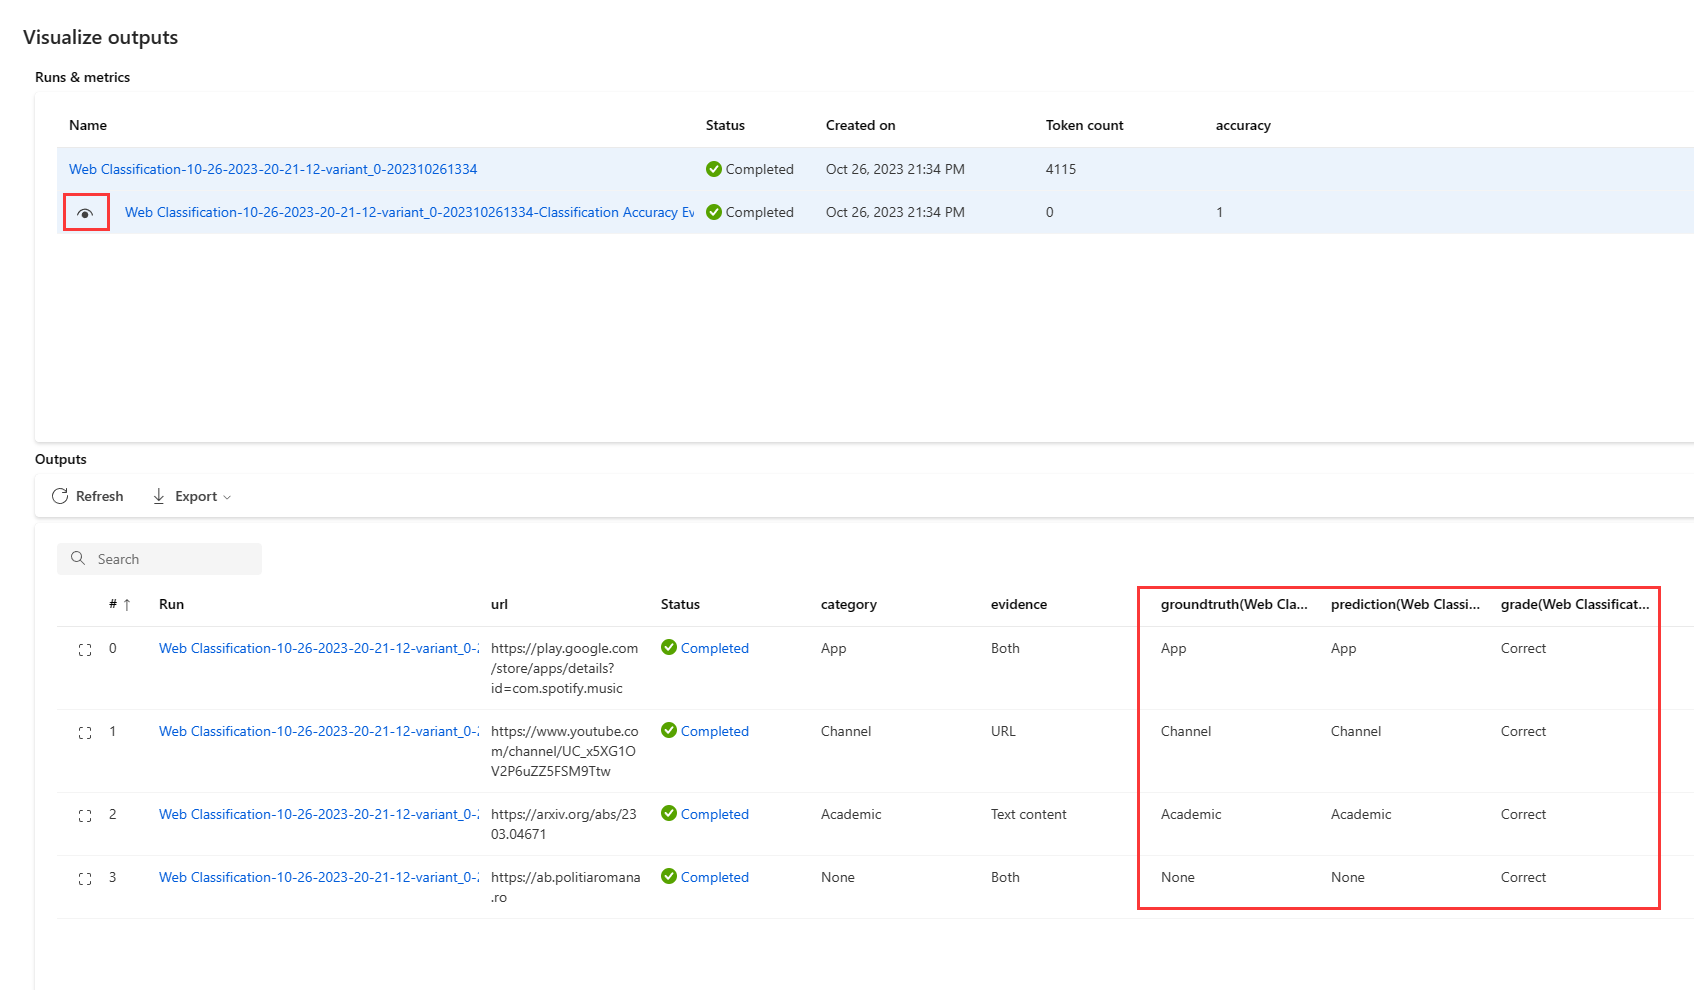
After the batch run is completed, select the run, then Visualize outputs to view the result of your batch run. Select View outputs (eye icon) to append evaluation results to the table of batch run results. You can see the total token count and overall accuracy, then in the table you will see the results for each row of data: input, flow output and evaluation results (which cases are predicted correctly and which are not.).
You can adjust column width, hide/unhide columns, change column orders. You can also select Export to download the output table for further investigation, we provide 2 options:
- Download current page: a csv file of the batch run outputs in current page.
- Download all data: what you download is a Jupyter notebook file, you need to run it to download outputs in jsonl or csv format.
As you might know, accuracy isn't the only metric that can evaluate a classification task, for example you can also use recall to evaluate. In this case, you can select Evaluate next to "Visualize outputs" button, choose other evaluation methods to evaluate.
Deployment
After you build a flow and test it properly, you might want to deploy it as an endpoint so that you can invoke the endpoint for real-time inference.
Configure the endpoint
Select batch run link, then you're directed to the batch run detail page, select Deploy. A wizard pops up to allow you to configure the endpoint. Specify an endpoint and deployment name, select a virtual machine, set connections, do some settings (you can use the default settings), select Review + create to start the deployment.
Test the endpoint
You can go to your endpoint detail page from the notification or by navigating to Endpoints in the left navigation of studio then select your endpoint in Real-time endpoints tab. It takes several minutes to deploy the endpoint. After the endpoint is deployed successfully, you can test it in the Test tab.
Put the url you want to test in the input box, and select Test, then you'll see the result predicted by your endpoint.
Clean up resources
If you plan to continue now to how-to guides and would like to use the resources you created here, skip to Next steps.
Stop compute instance
If you're not going to use it now, stop the compute instance:
- In the studio, in the left navigation area, select Compute.
- In the top tabs, select Compute instances
- Select the compute instance in the list.
- On the top toolbar, select Stop.
Delete all resources
If you don't plan to use any of the resources that you created, delete them so you don't incur any charges:
- In the Azure portal, select Resource groups on the far left.
- From the list, select the resource group that you created.
- Select Delete resource group.
Next steps
Now that you have an idea of what's involved in flow developing, testing, evaluating and deploying, learn more about the process in these tutorials:
Feedback
Coming soon: Throughout 2024 we will be phasing out GitHub Issues as the feedback mechanism for content and replacing it with a new feedback system. For more information see: https://aka.ms/ContentUserFeedback.
Submit and view feedback for
