ملاحظة
يتطلب الوصول إلى هذه الصفحة تخويلاً. يمكنك محاولة تسجيل الدخول أو تغيير الدلائل.
يتطلب الوصول إلى هذه الصفحة تخويلاً. يمكنك محاولة تغيير الدلائل.
Power BI is a reporting and analytics platform that turns data into coherent, immersive, interactive visualizations. يتيح لك Power BI الاتصال بمصادر البيانات بسهولة، وتصور العلاقات واكتشافها، ومشاركة الرؤى مع من تريد.
يمكنك إسناد تقارير Power BI إلى بيانات من Microsoft Sentinel ومشاركة هذه التقارير مع أشخاص ليس لديهم حق الوصول إلى Microsoft Sentinel. وعلى سبيل المثال، قد ترغب في مشاركة معلومات حول محاولات تسجيل الدخول الفاشلة مع مالكي التطبيق، دون منحهم حق الوصول إلى Microsoft Sentinel. يمكن أن توفر مرئيات Power BI البيانات في لمح البصر.
يعمل Microsoft Sentinel على مساحات عمل Log Analytics، ويمكنك استخدام Kusto Query Language (KQL) للاستعلام عن البيانات.
توفر هذه المقالة إجراء يستند إلى السيناريو لعرض تقارير التحليل في Power BI لبيانات Microsoft Sentinel. لمزيد من المعلومات، راجع توصيل مصادر البياناتوتصور البيانات المجمعة.
في هذه المقالة، ستتمكن من:
- تصدير استعلام KQL إلى استعلام لغة Power BI M.
- عليك استخدم الاستعلام M في Power BI Desktop لإنشاء مرئيات وتقرير.
- انشر التقرير إلى خدمة Power BI وشاركه مع الآخرين.
- أضف التقرير إلى قناة فرق.
يمكن للأشخاص الذين منحتهم حق الوصول في خدمة Power BI وأعضاء قناة Teams مشاهدة التقرير دون الحاجة إلى أذونات Microsoft Sentinel.
Important
يتوفر Microsoft Sentinel بشكل عام في مدخل Microsoft Defender، بما في ذلك للعملاء الذين ليس لديهم Microsoft Defender XDR أو ترخيص E5.
Starting in July 2026, all customers using Microsoft Sentinel in the Azure portal will be redirected to the Defender portal and will use Microsoft Sentinel in the Defender portal only. Starting in July 2025, many new customers are automatically onboarded and redirected to the Defender portal.
إذا كنت لا تزال تستخدم Microsoft Sentinel في مدخل Microsoft Azure، نوصيك بالبدء في التخطيط للانتقال إلى مدخل Defender لضمان انتقال سلس والاستفادة الكاملة من تجربة عمليات الأمان الموحدة التي يقدمها Microsoft Defender. لمزيد من المعلومات، راجع حان الوقت للنقل: إيقاف مدخل Microsoft Sentinel Azure لمزيد من الأمان.
Prerequisites
لإكمال الخطوات في هذه المقالة تحتاج إلى:
- على الأقل قراءة الوصول إلى مساحة عمل Microsoft Sentinel التي تراقب محاولات تسجيل الدخول.
- حساب Power BI لديه حق الوصول للقراءة إلى مساحة عمل Microsoft Sentinel.
- Power BI Desktop مثبت من Microsoft Store.
تصدير استعلام من Microsoft Sentinel
إنشاء استعلام KQL وتشغيله وتصديره من Microsoft Sentinel.
To create a simple query, in Microsoft Sentinel, select Logs. إذا تم إلحاق مساحة العمل الخاصة بك إلى مدخل Microsoft Defender، فحدد السجلات العامة>.
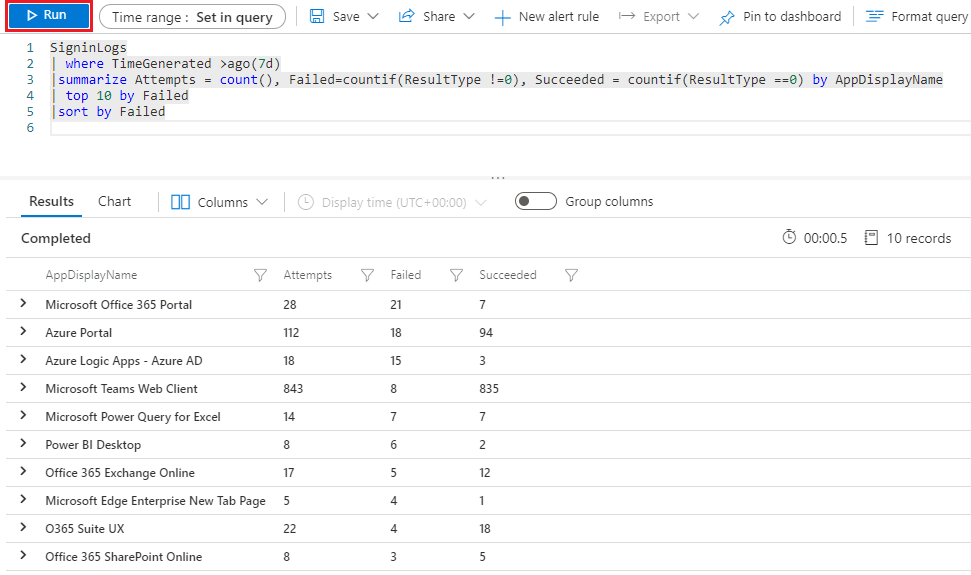
في محرر الاستعلام، ضمن استعلام جديد 1، أدخل الاستعلام التالي، أو أي استعلام Microsoft Sentinel آخر لبياناتك:
SigninLogs
| where TimeGenerated >ago(7d)
| summarize Attempts = count(), Failed=countif(ResultType !=0), Succeeded = countif(ResultType ==0) by AppDisplayName
| top 10 by Failed
| sort by Failed
راجع المزيد من المعلومات حول العناصر التالية المستخدمة في المثال السابق، في وثائق Kusto:
- where operator
- summarize operator
- top operator
- sort operator
- ago() function
- دالة التجميع count()
- دالة التجميع countif()
لمزيد من المعلومات حول KQL، راجع نظرة عامة على لغة استعلام Kusto (KQL).
Other resources:
Select Run to run the query and generate results.
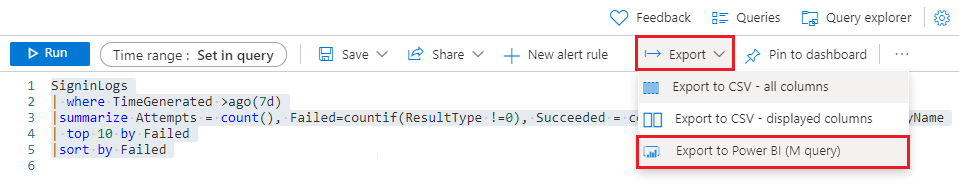
To export the query to Power BI M query format, select Export, and then select Export to Power BI (M query). The query is exported to a text file called PowerBIQuery.txt.
انسخ محتويات الملف الذي تم تصديره.
احصل على البيانات في Power BI Desktop
قم بتشغيل الاستعلام M المُصدَّر في Power BI Desktop للحصول على البيانات.
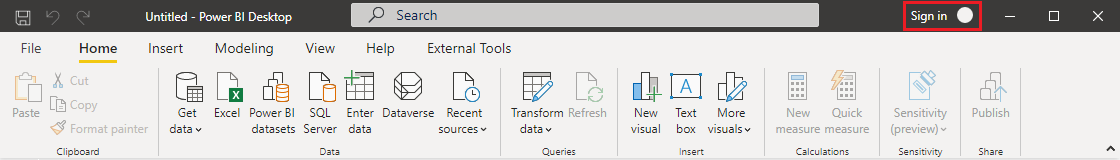
افتح Power BI Desktop، وسجل الدخول إلى حساب Power BI الذي لديه حق الوصول للقراءة إلى مساحة عمل Microsoft Sentinel.
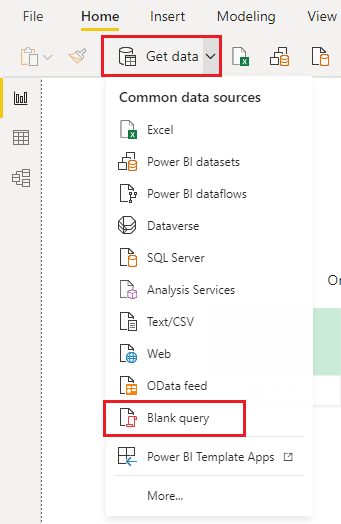
In the Power BI ribbon, select Get data and then select Blank query. يتم فتح محرر Power Query .
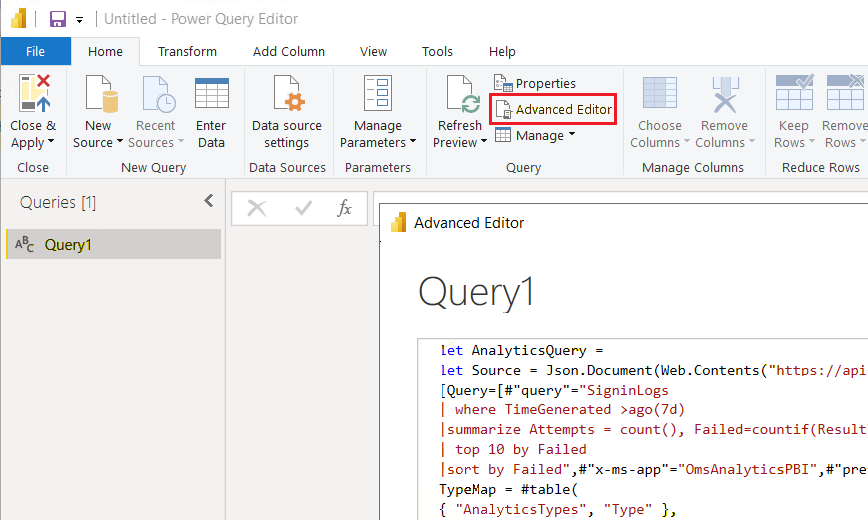
في Power Query Editor، حدد Advanced Editor.
Paste the copied contents of the exported PowerBIQuery.txt file into the Advanced Editor window, and then select Done.
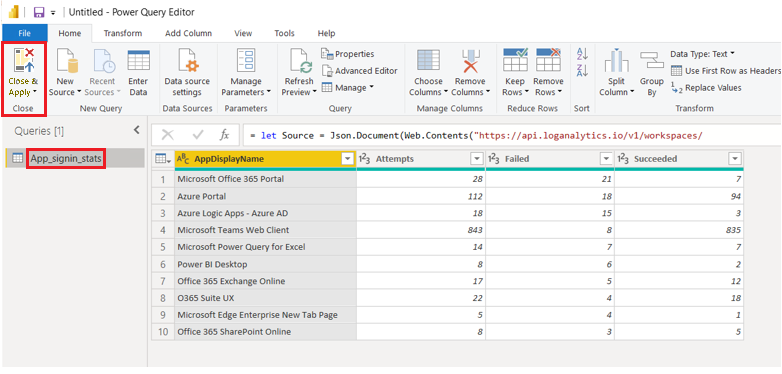
في محرر Power Query، أعد تسمية الاستعلام إلى App_signin_stats، ثم حدد إغلاق وتطبيق.
إنشاء مرئيات من البيانات
الآن بعد أن أصبحت بياناتك في Power BI، يمكنك إنشاء مرئيات لتوفير رؤى حول البيانات.
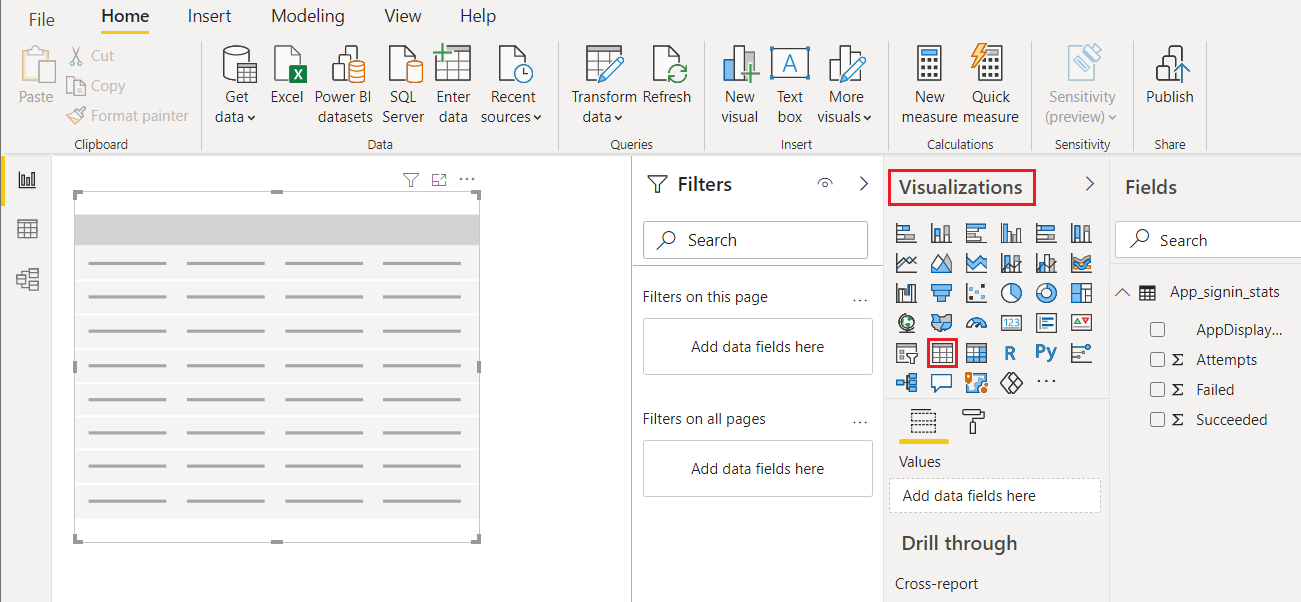
إنشاء مرئيات الجدول
أولاً، قم بإنشاء جدول يعرض جميع نتائج الاستعلام.
To add a table visualization to the Power BI Desktop canvas, select the table icon under Visualizations.
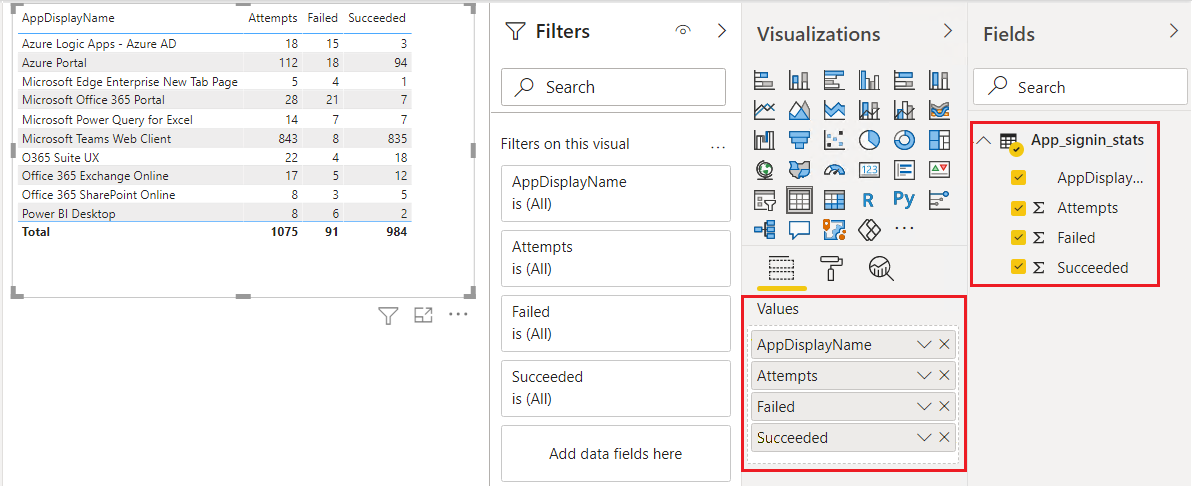
Under Fields, select all the fields in your query, so they all appear in the table. إذا لم يعرض الجدول جميع البيانات، فكبّر الجدول بسحب مقابض التحديد الخاصة به.
إنشاء مخطط دائري
بعد ذلك، أنشئ مخططًا دائريًا يوضح التطبيقات التي شهدت أكثر محاولات تسجيل الدخول فشلًا.
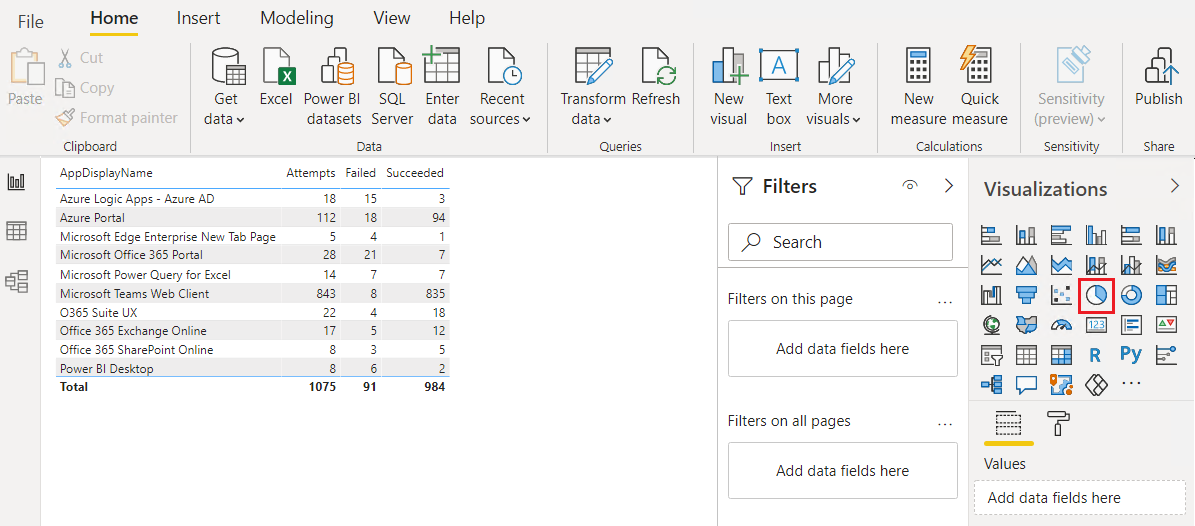
Deselect the table visual by clicking or tapping outside of it, and then under Visualizations, select the pie chart icon.
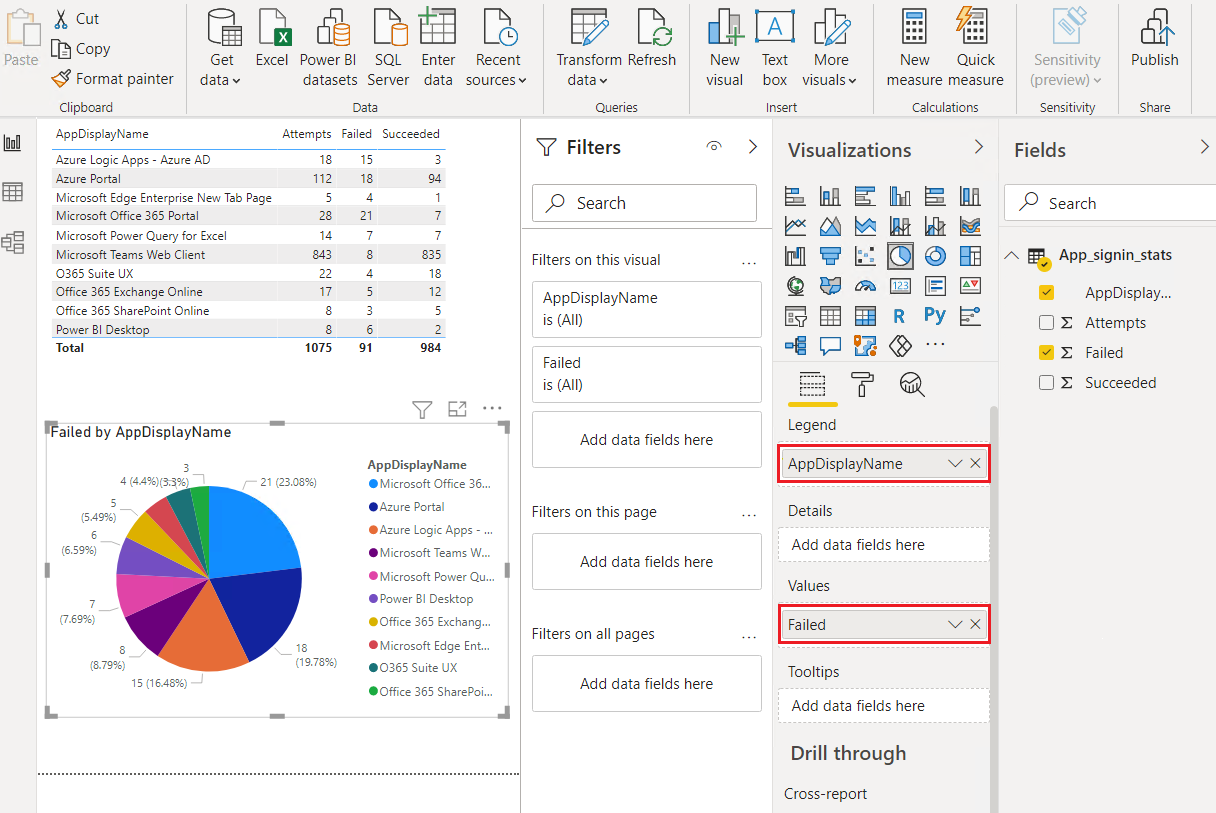
Select AppDisplayName in the Legend well, or drag it from the Fields pane. Select Failed in the Values well, or drag it from Fields. ويعرض المخطط الدائري الآن عدد محاولات تسجيل الدخول الفاشلة لكل تطبيق.
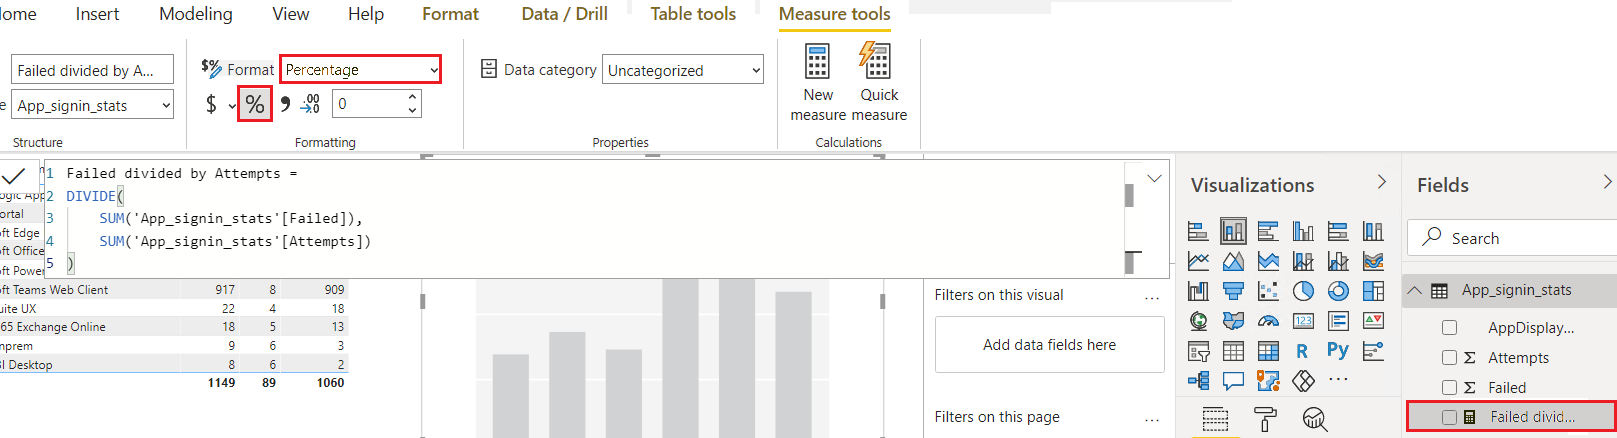
قم بإنشاء مقياس سريع جديد
تحتاج أيضًا إلى إظهار النسبة المئوية لمحاولات تسجيل الدخول الفاشلة لكل تطبيق. نظرًا لأن الاستعلام لا يحتوي على عمود النسبة المئوية، يمكنك إنشاء مقياس جديد لإظهار هذه المعلومات.
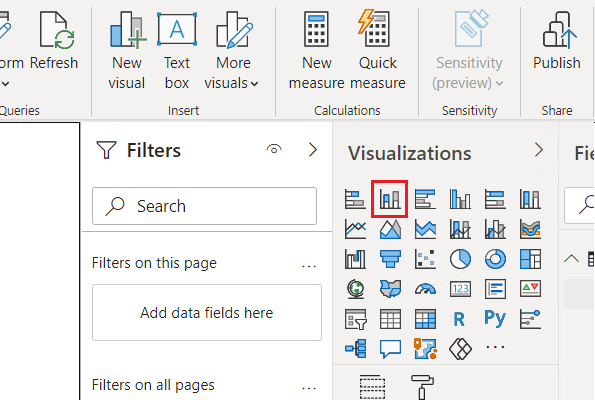
Under Visualizations, select the stacked column chart icon to create a stacked column chart.
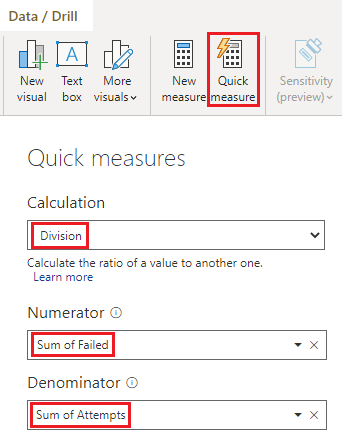
With the new visualization selected, select Quick measure in the ribbon.
In the Quick measures window, under Calculation, select Division. Drag Failed from Fields into the Numerator field, and drag Attempts from Fields to Denominator.
Select OK. The new measure appears in the Fields pane.
Select the new measure in the Fields pane, and under Formatting in the ribbon, select Percentage.
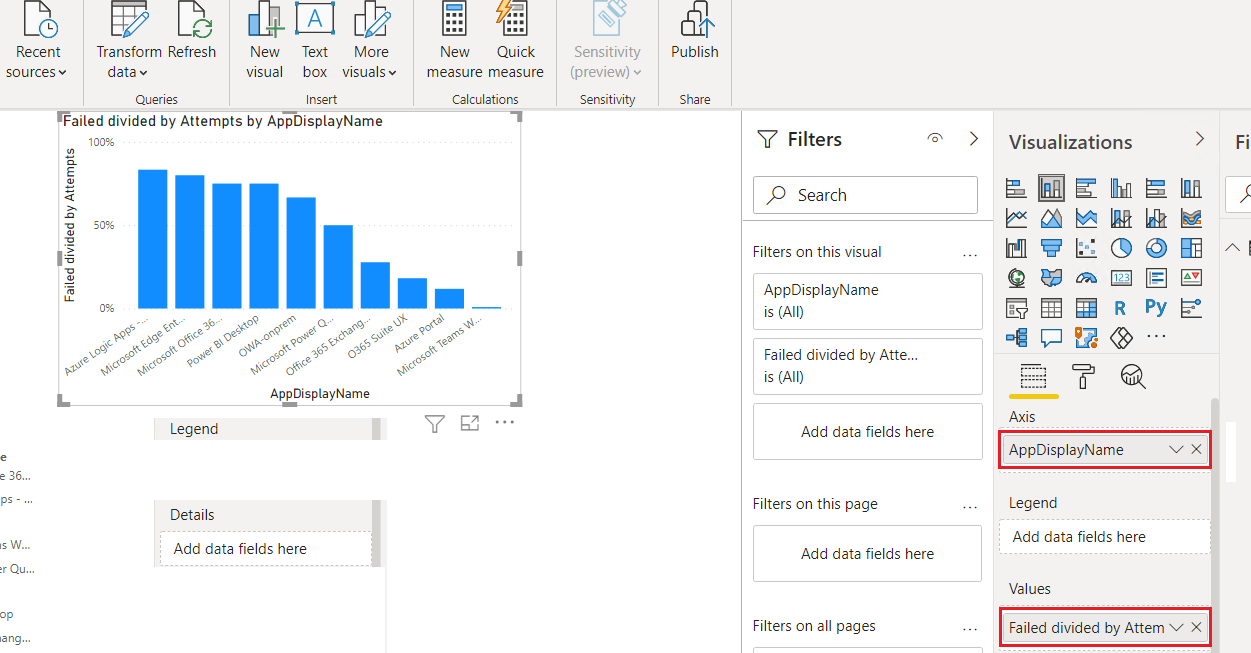
With the column chart visualization selected on the canvas, select or drag the AppDisplayName field into the Axis well, and the new Failed divided by Attempts measure into the Values well. ويعرض المخطط الآن النسبة المئوية لمحاولات تسجيل الدخول الفاشلة لكل تطبيق.
قم بتحديث البيانات وحفظ التقرير
Select Refresh to get the latest data from Microsoft Sentinel.
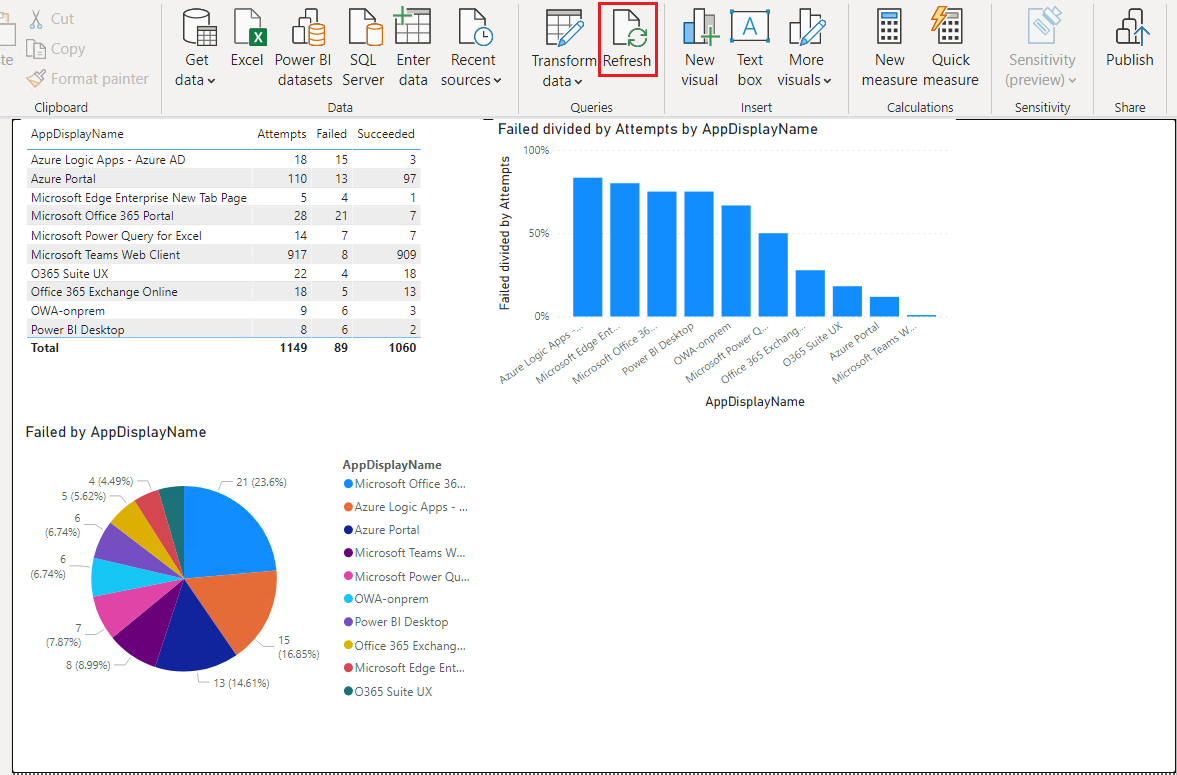
Select File>Save and save your Power BI report.
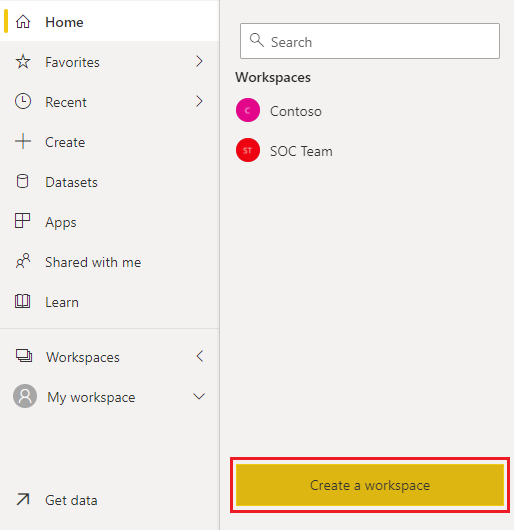
قم بإنشاء مساحة عمل Power BI عبر الإنترنت
ولإنشاء مساحة عمل Power BI لمشاركة التقرير:
Sign in to powerbi.com with the same account you used for Power BI Desktop and Microsoft Sentinel read access.
Under Workspaces, select Create a workspace. Name the workspace Management Reports, and select Save.
To grant people and groups access to the workspace, select the More options dots next to the new workspace name, and then select Workspace access.
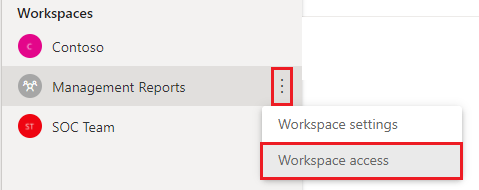
In the Workspace access side pane, you can add users' email addresses and assign each user a role. الأدوار هي المسؤول والعضو والمساهم والعارض.
نشر تقرير Power BI
يمكنك الآن استخدام Power BI Desktop لنشر تقرير Power BI الخاص بك حتى يتمكن الآخرون من رؤيته.
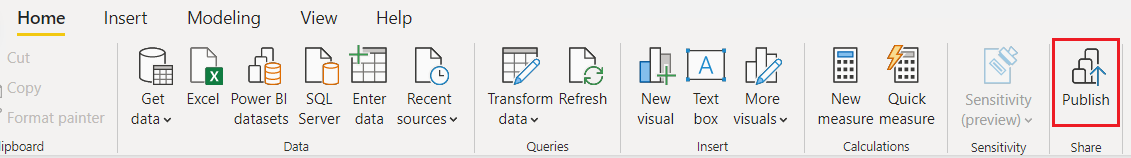
In your new report in Power BI Desktop, select Publish.
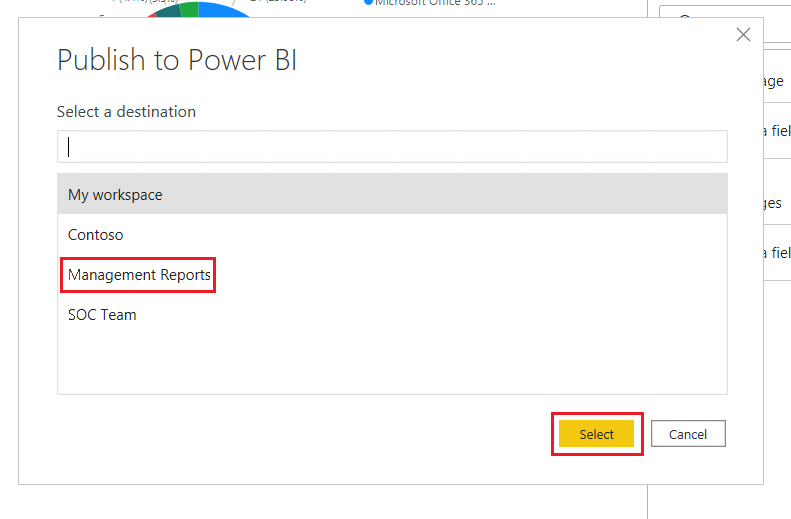
Select the Management Reports workspace to publish to, and select Select.
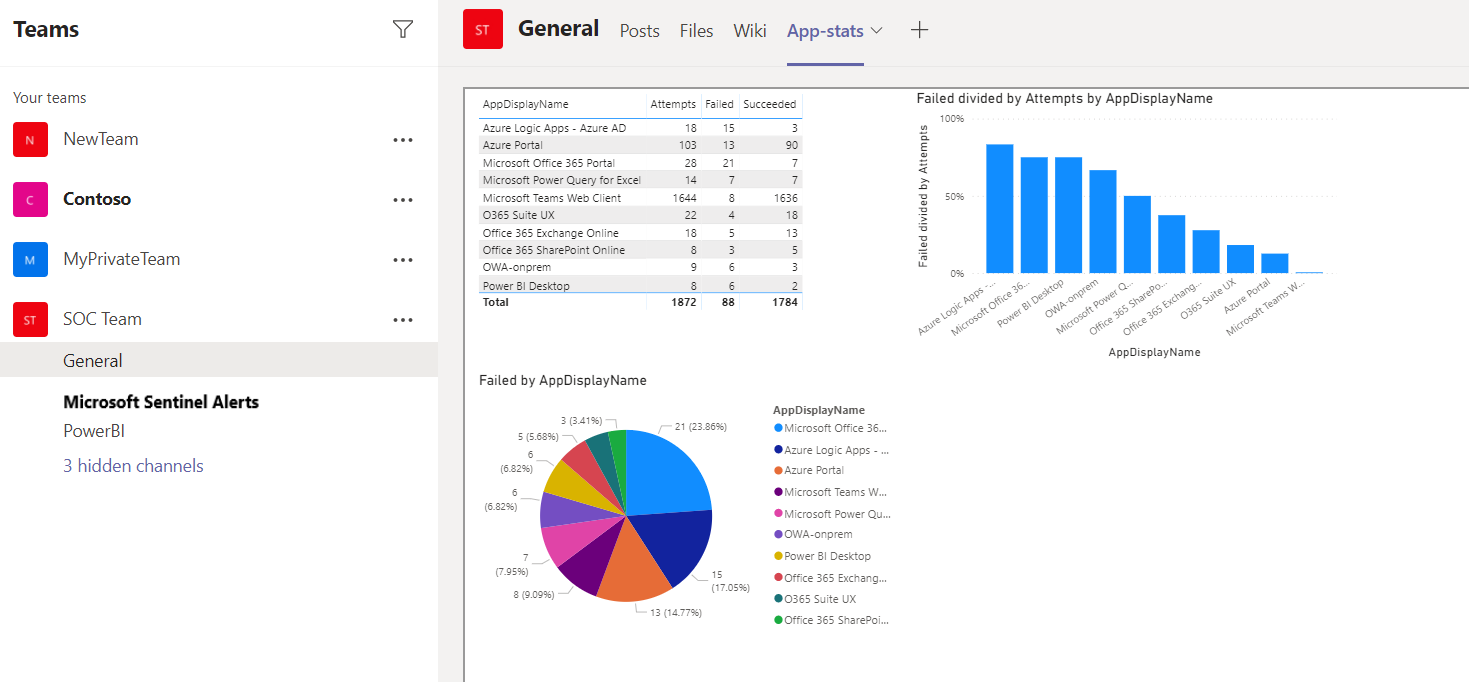
قم باستيراد التقرير إلى قناة Microsoft Teams
تحتاج أيضًا إلى تمكين أعضاء قناة Management Teams من رؤية التقرير. لإضافة التقرير إلى قناة Teams:
في قناة Management Teams، حدد + لإضافة علامة تبويب، وفي نافذة إضافة علامة تبويب ، ابحث عن Power BI وحدده.
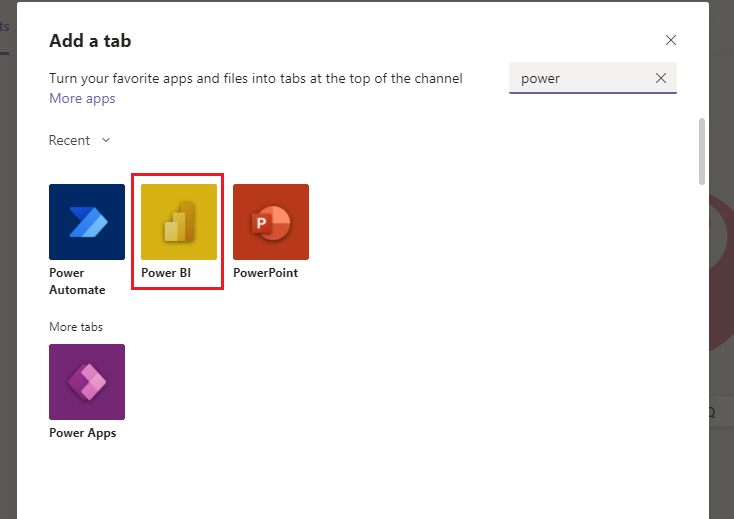
Select your new report from the list of Power BI reports, and select Save. يظهر التقرير في علامة تبويب جديدة في قناة Teams.
تحديث تقرير الجدول
قم بتحديث تقرير Power BI وفقًا لجدول زمني، بحيث تظهر البيانات المحدثة دائمًا في التقرير.
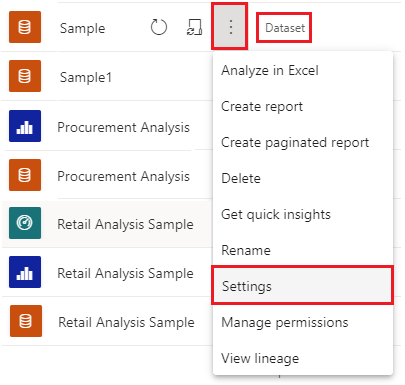
في خدمة Power BI، حدد مساحة العمل التي نشرت تقريرك عليها.
Next to the report's dataset, select More options>Settings.
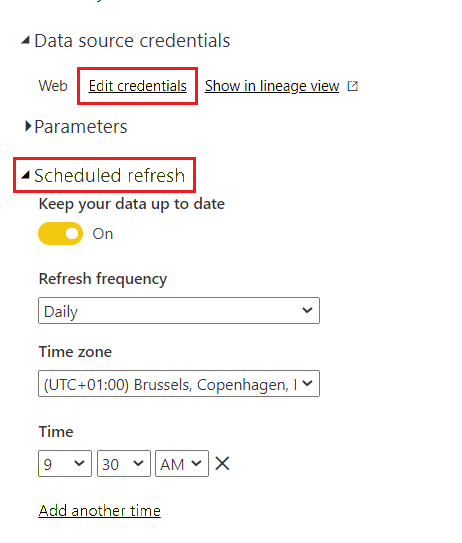
Select Edit credentials to provide the credentials for an account that has read access to the Log Analytics workspace.
Under Scheduled refresh, set the slider to On, and set up a refresh schedule for the report.
Related content
لمزيد من المعلومات، راجع: