إشعار
يتطلب الوصول إلى هذه الصفحة تخويلاً. يمكنك محاولة تسجيل الدخول أو تغيير الدلائل.
يتطلب الوصول إلى هذه الصفحة تخويلاً. يمكنك محاولة تغيير الدلائل.
Applies to: ✅ SQL analytics endpoint, Warehouse, and Mirrored Database in Microsoft Fabric
This article describes how to use the SQL query editor in the Microsoft Fabric portal to quickly and efficiently write queries, and suggestions on how best to see the information you need.
- You can also query the data in your warehouse by using multiple tools with a SQL connection string.
- You can build queries graphically by using the Visual query editor.
- You can quickly view data in the Data preview.
The SQL query editor provides IntelliSense, code completion, syntax highlighting, client-side parsing, and validation. You can run Data Definition Language (DDL), Data Manipulation Language (DML), and Data Control Language (DCL) statements.
SQL query editor in the Fabric portal
The SQL query editor provides a text editor to write queries by using T-SQL. To access the built-in SQL query editor:
Create a new query by using the New SQL query button in the ribbon.
Select the SQL templates dropdown list to easily create T-SQL objects. The code templates populate in your SQL query window, as shown in the following image.
As you work on your SQL query, the queries are automatically saved every few seconds. A "saving" indicator appears in your query tab to indicate that your query is being saved.
Multitask between tabs for data preview, querying, and modeling
The data preview, querying, and modeling experience opens as individual tabs that you can multitask between in the editor. If you're writing a query, you can switch between seeing a preview of the data and viewing the relationships between tables that you're writing the query for. To view or close all tabs, select the icon on the right of all tabs.
View query results
Once you've written the T-SQL query, select Run to execute the query.
The Results preview appears in the Results section. If the query returns more than 10,000 rows, the preview shows only the first 10,000 rows. You can search for a string within the results grid to filter rows that match the search criteria. The Messages tab shows SQL messages returned when the SQL query runs.
The status bar indicates the query status, duration of the run, and number of rows and columns returned in results.
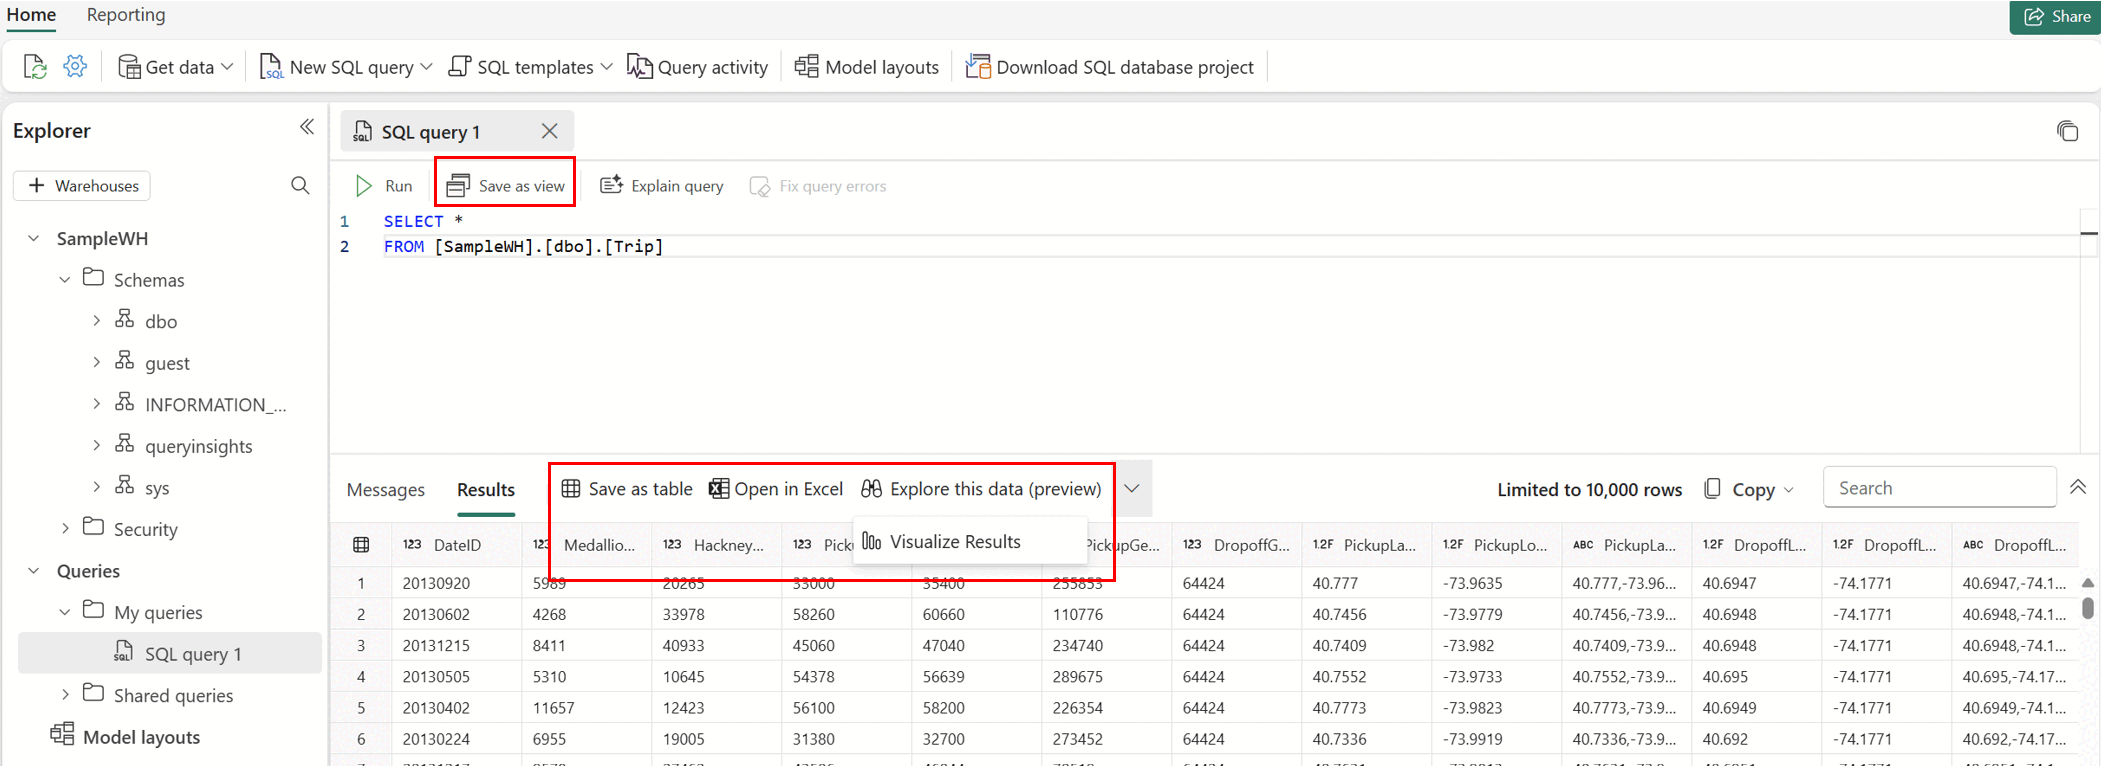
To enable Save as view, Save as table, Open in Excel, Explore this data (preview), and Visualize results menus, highlight the SQL statement containing the SELECT statement in the SQL query editor.
Save as view
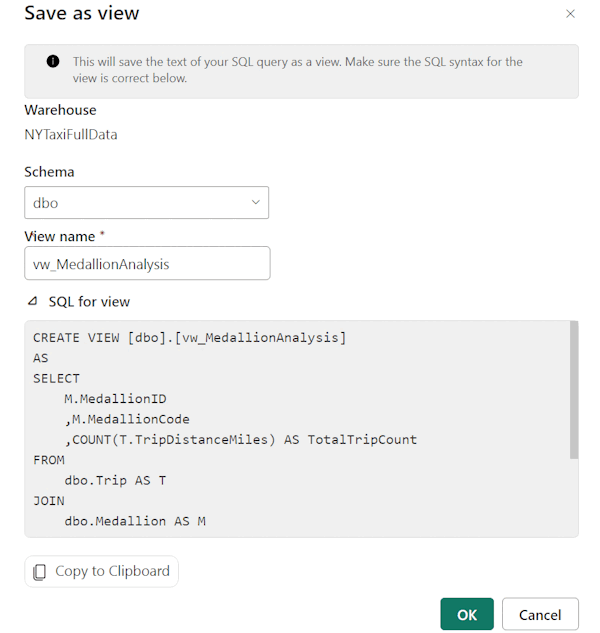
Select the query and save your query as a view by using the Save as view button. Select a schema name, provide the name of the view, and verify the SQL statement before confirming the creation of the view. When the view is successfully created, it appears in the Explorer.
Save as table
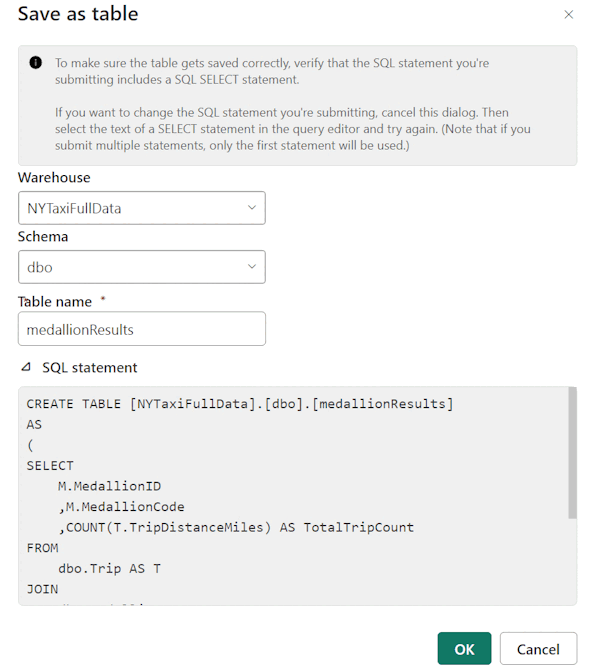
Use Save as table to save your query results into a table. Select the warehouse where you want to save results, select a schema, and provide a table name to load results into the table by using the CREATE TABLE AS SELECT statement. When the table is successfully created, it appears in the Explorer.
Open in Excel
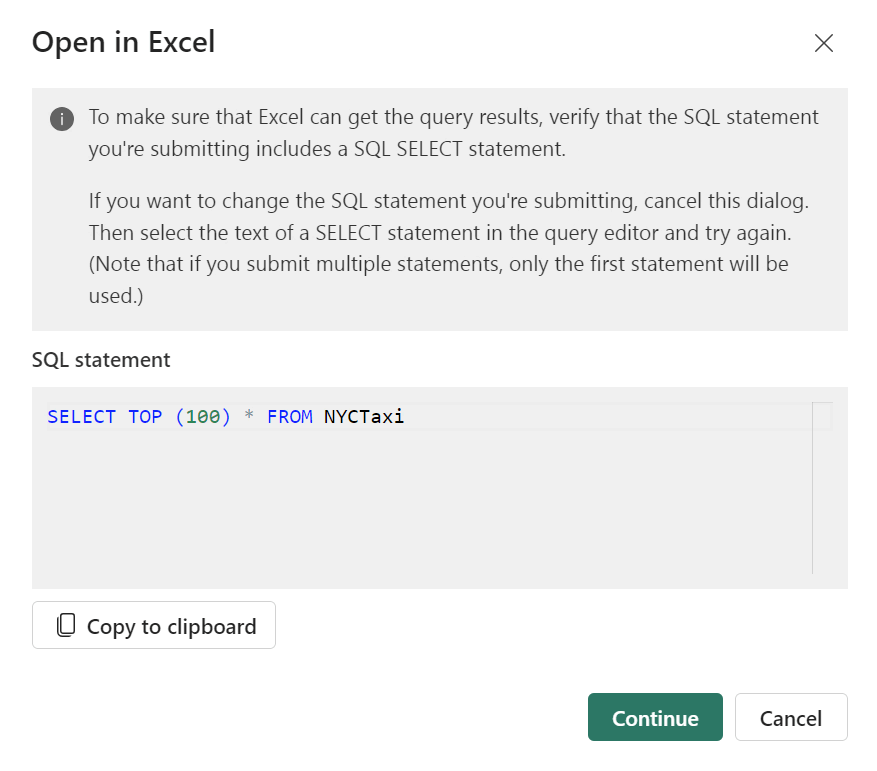
Select Open in Excel to open the corresponding T-SQL query in Excel and execute the query. You can work with the results in Microsoft Excel on your local computer.
Follow these steps to work with the Excel file locally:
After you select the Continue button, locate the downloaded Excel file in your Windows File Explorer, for example, in the Downloads folder of your browser.
To see the data, select the Enable Editing button in the Protected View ribbon followed by the Enable Content button in the Security Warning ribbon. Once both are enabled, you're presented with the following dialog to approve running the query listed.
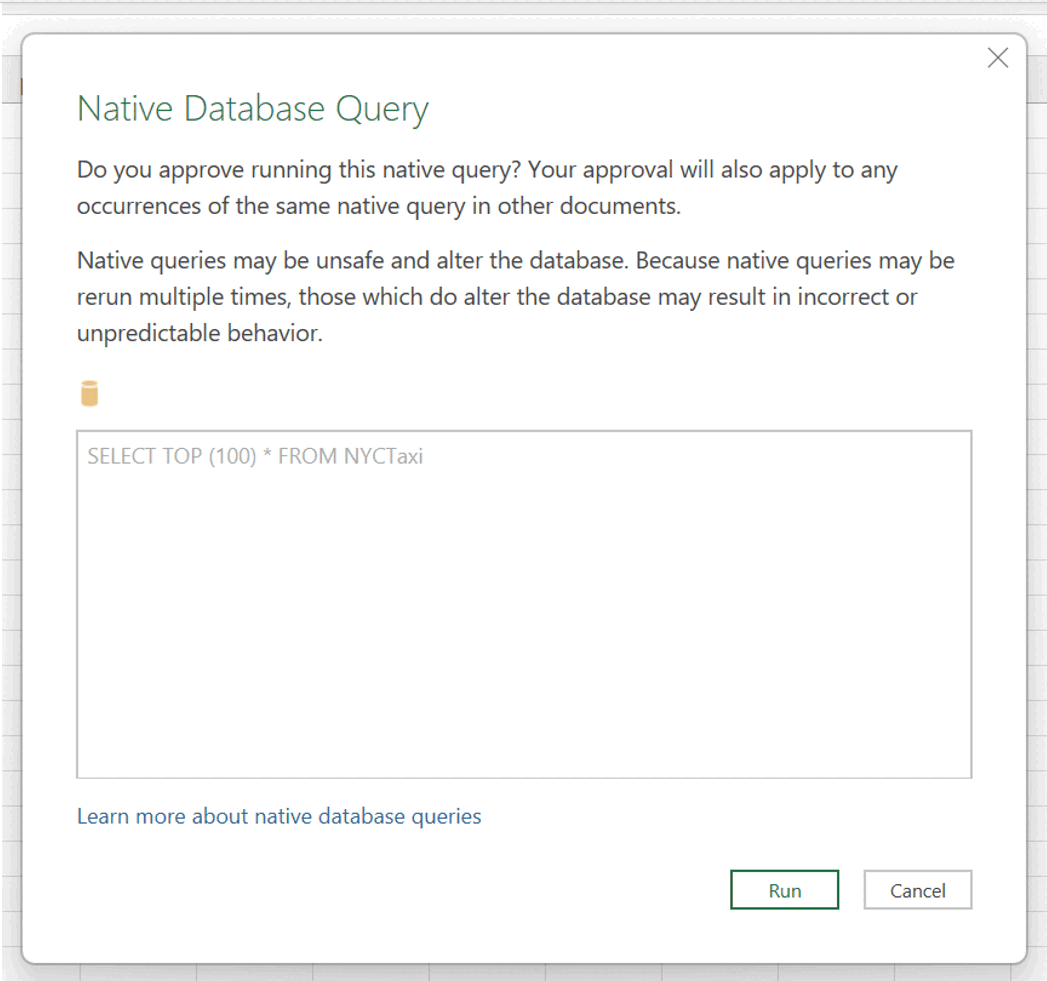
Select Run.
Authenticate your account by using the Microsoft account option. Select Connect.
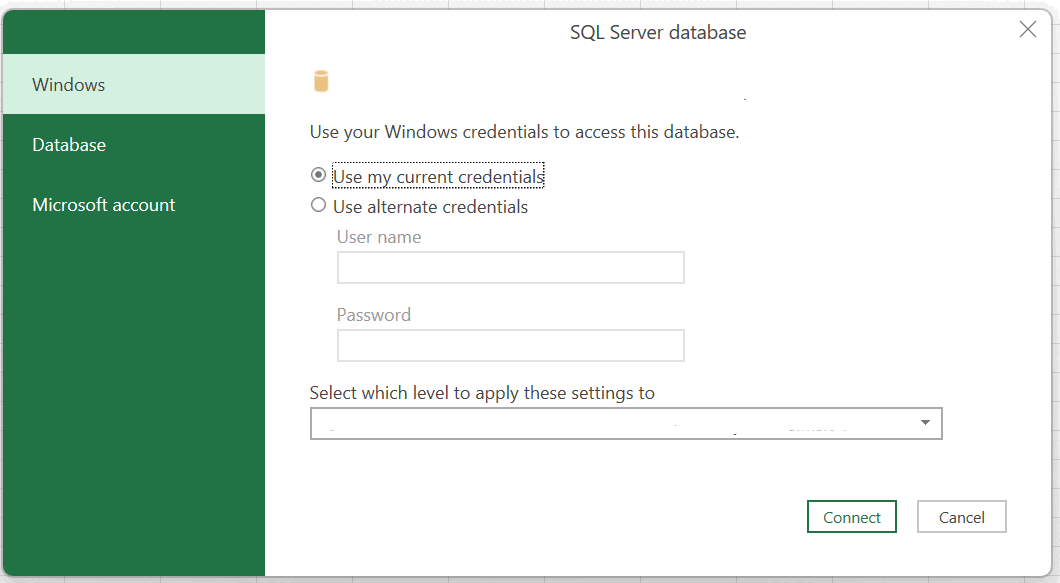
After you sign in successfully, you see the data presented in the spreadsheet.
Explore this data (preview)
Explore this data (preview) provides the capability to perform ad hoc exploration of your query results. By using this feature, you can launch a side-by-side matrix and visual view to better understand any trends or patterns behind your query results before diving into building a full Power BI report. For more information, see Explore your data in the Power BI service.
Visualize results
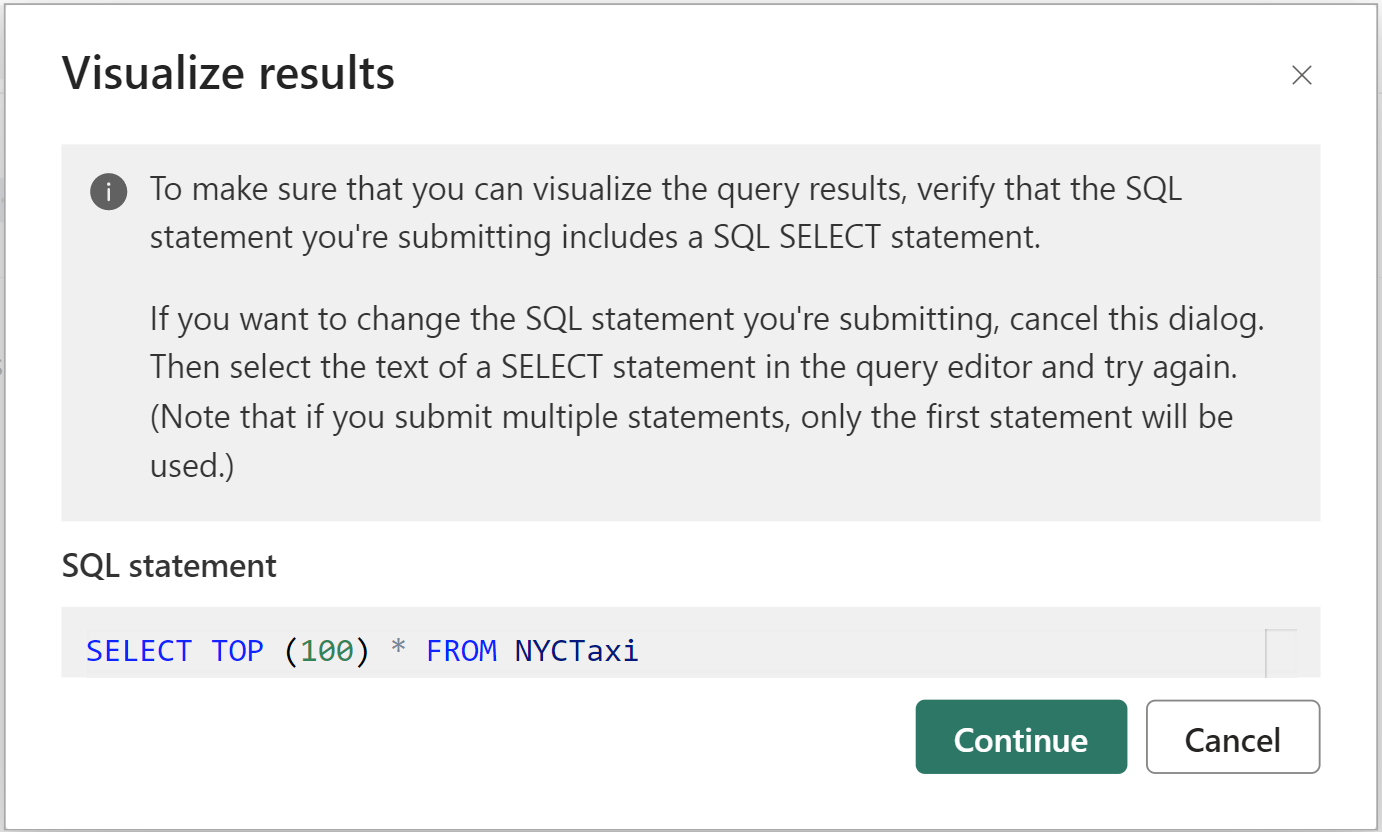
Visualize results allows you to create reports from your query results within the SQL query editor.
Copy
The Copy dropdown list allows you to copy the results and column names in the data grid. You can choose to copy results with column names, just copy the results, or just copy the column names.
Multiple result sets
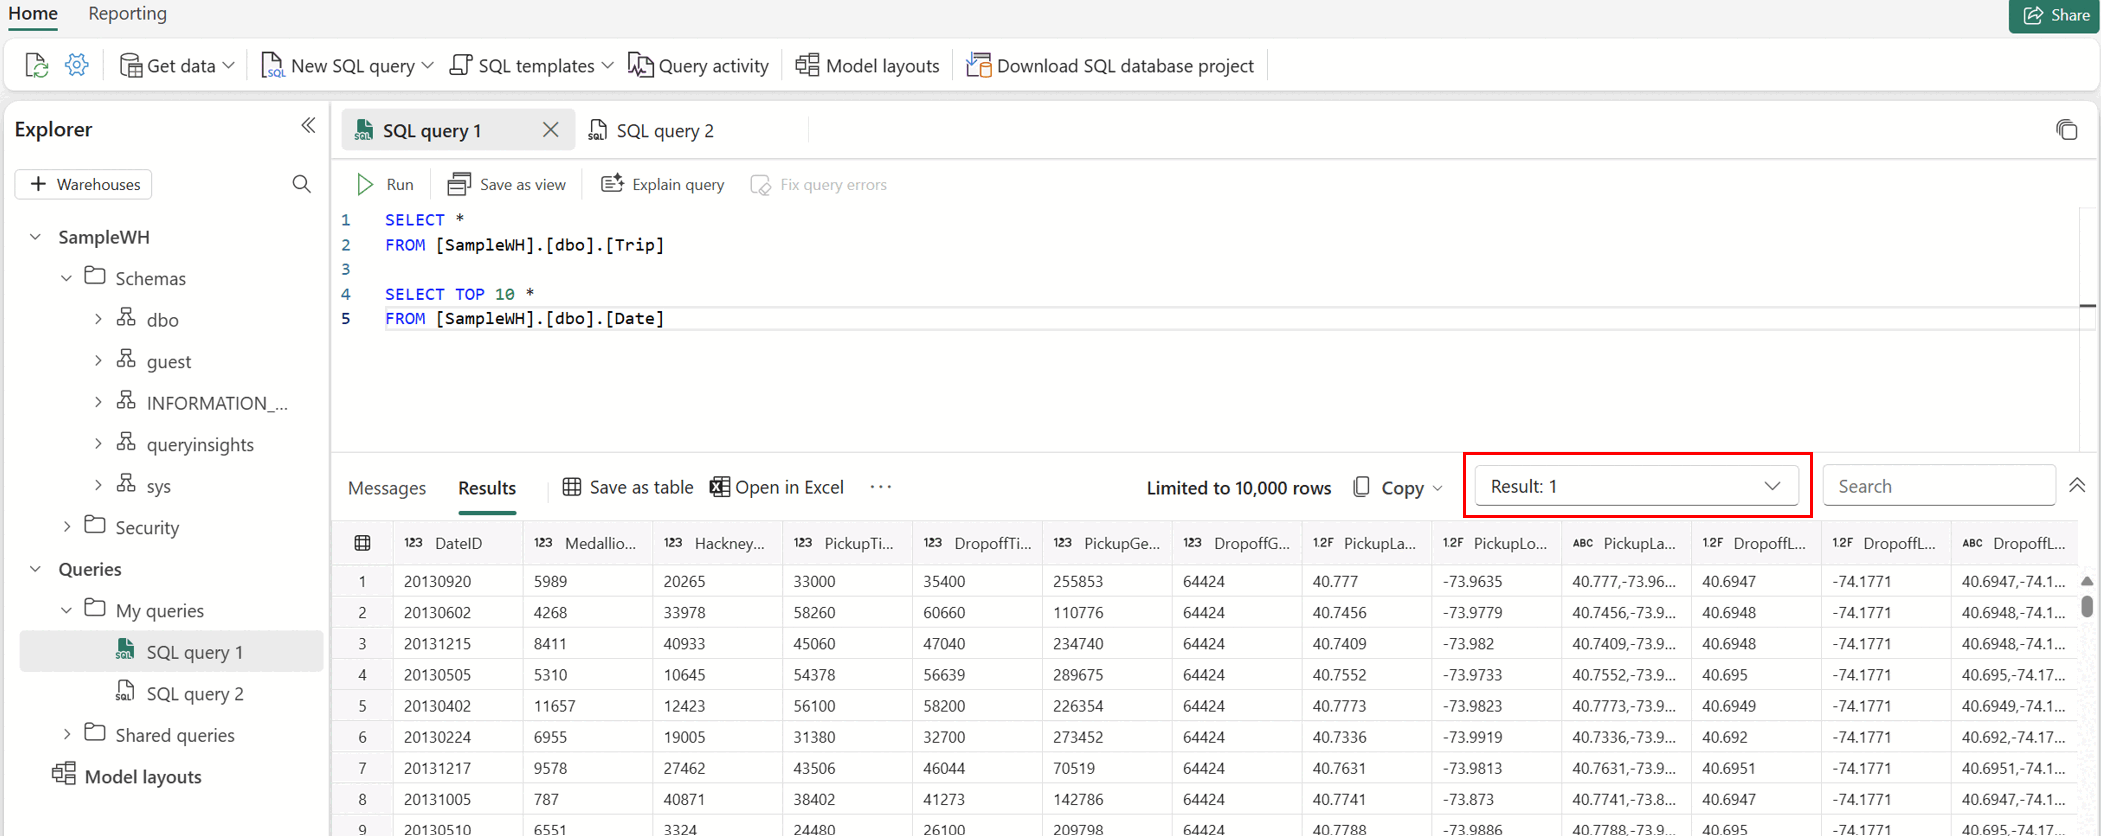
When you run multiple queries and those queries return multiple results, you can select the Results dropdown list to see individual results.
Cross-warehouse querying
For more information on cross-warehouse querying, see Cross-warehouse querying.
You can write a T-SQL query with the three-part naming convention to refer to objects and join them across warehouses, for example:
SELECT
   emp.Employee
   ,SUM(Profit) AS TotalProfit
   ,SUM(Quantity) AS TotalQuantitySold
FROM
   [SampleWarehouse].[dbo].[DimEmployee] as emp
JOIN
   [WWI_Sample].[dbo].[FactSale] as sale
ON
   emp.EmployeeKey = sale.SalespersonKey
WHERE
   emp.IsSalesperson = 'TRUE'
GROUP BY
   emp.Employee
ORDER BY
   TotalProfit DESC;
Manage running queries when closing the query editor
When a query is still running and you close the query editor tab, you can decide whether the query should continue running in the background or be canceled.
Yes, keep running the query: The query continues to execute in the background, with a toast notification indicating it's running. When the query finishes, a notification alerts you so you can return to the query to view the results.
No, cancel the query: The query is terminated immediately. This option is useful to free up resources or stop queries you no longer need.
Remember my preference and don't show again: Saves your choice locally in your browser cookies.
Keyboard shortcuts
Keyboard shortcuts provide a quick way to navigate and work more efficiently in the SQL query editor. The following table lists all the shortcuts available in Windows and macOS, in the Edge browser, for the SQL query editor in the Microsoft Fabric portal:
| Function | Windows Shortcut | macOS Shortcut |
|---|---|---|
| Query editor actions | ||
| Run all SQL statements in active query tab | Ctrl + Enter / Shift + Enter | Command + Enter / Shift + Enter |
| Close current tab | Ctrl + Shift + F4 | Command + Shift + F4 |
| Cancel running SQL script | Ctrl + . | Command + . |
| Search string | Ctrl + F | Command + F |
| Replace string | Ctrl + H | Command + Option + F |
| Undo | Ctrl + Z | Command + Z |
| Redo | Ctrl + Y | Command + Shift + Z |
| Go one word left | Ctrl + Left arrow key | Command + Left arrow key |
| Go one word right | Ctrl + Right arrow key | Command + Right arrow key |
| Indent increase | Tab | Tab |
| Indent decrease | Shift + Tab | Shift + Tab |
| Comment | Ctrl + K, Ctrl + C | Command + K, Command + C |
| Uncomment | Ctrl + K, Ctrl + U | Command + K, Command + U |
| Move cursor up | Up Arrow | Up Arrow |
| Move cursor down | Down Arrow | Down Arrow |
| Select All | Ctrl + A | Command + A |
| Explain query (Copilot) | Ctrl + Alt + E | Command + Option + E |
| Fix query (Copilot) | Ctrl + Alt + F | Command + Option + X |
| Ribbon actions | ||
| Refresh metadata | Ctrl + Shift + R | Command + Shift + R |
| Open settings | Ctrl + Shift + X | Command + Shift + X |
| Copy SQL connection string | Ctrl + Shift + C | Command + Shift + C |
| Open query activity | Ctrl + Shift + A | Command + Shift + A |
| Open Copilot chat pane | Ctrl + Shift + I | Command + Shift + I |
| New semantic model | Ctrl + Shift + M | Command + Shift + M |
| New SQL Query | Ctrl + J | Command + J |
| New visual query | Ctrl + Shift + J | Command + Shift + J |
| Explorer actions | ||
| Expand explorer pane | Ctrl + B | Command + B |
| Collapse explorer pane | Ctrl + B | Command + B |
| Query results actions | ||
| Expand results | Ctrl + R | Command + R |
| Collapse results | Ctrl + R | Command + R |
Limitations
In SQL query editor, every time you run the query, it opens a separate session and closes it at the end of the execution. This behavior means that if you set up session context for multiple query runs, the context isn't maintained for independent execution of queries.
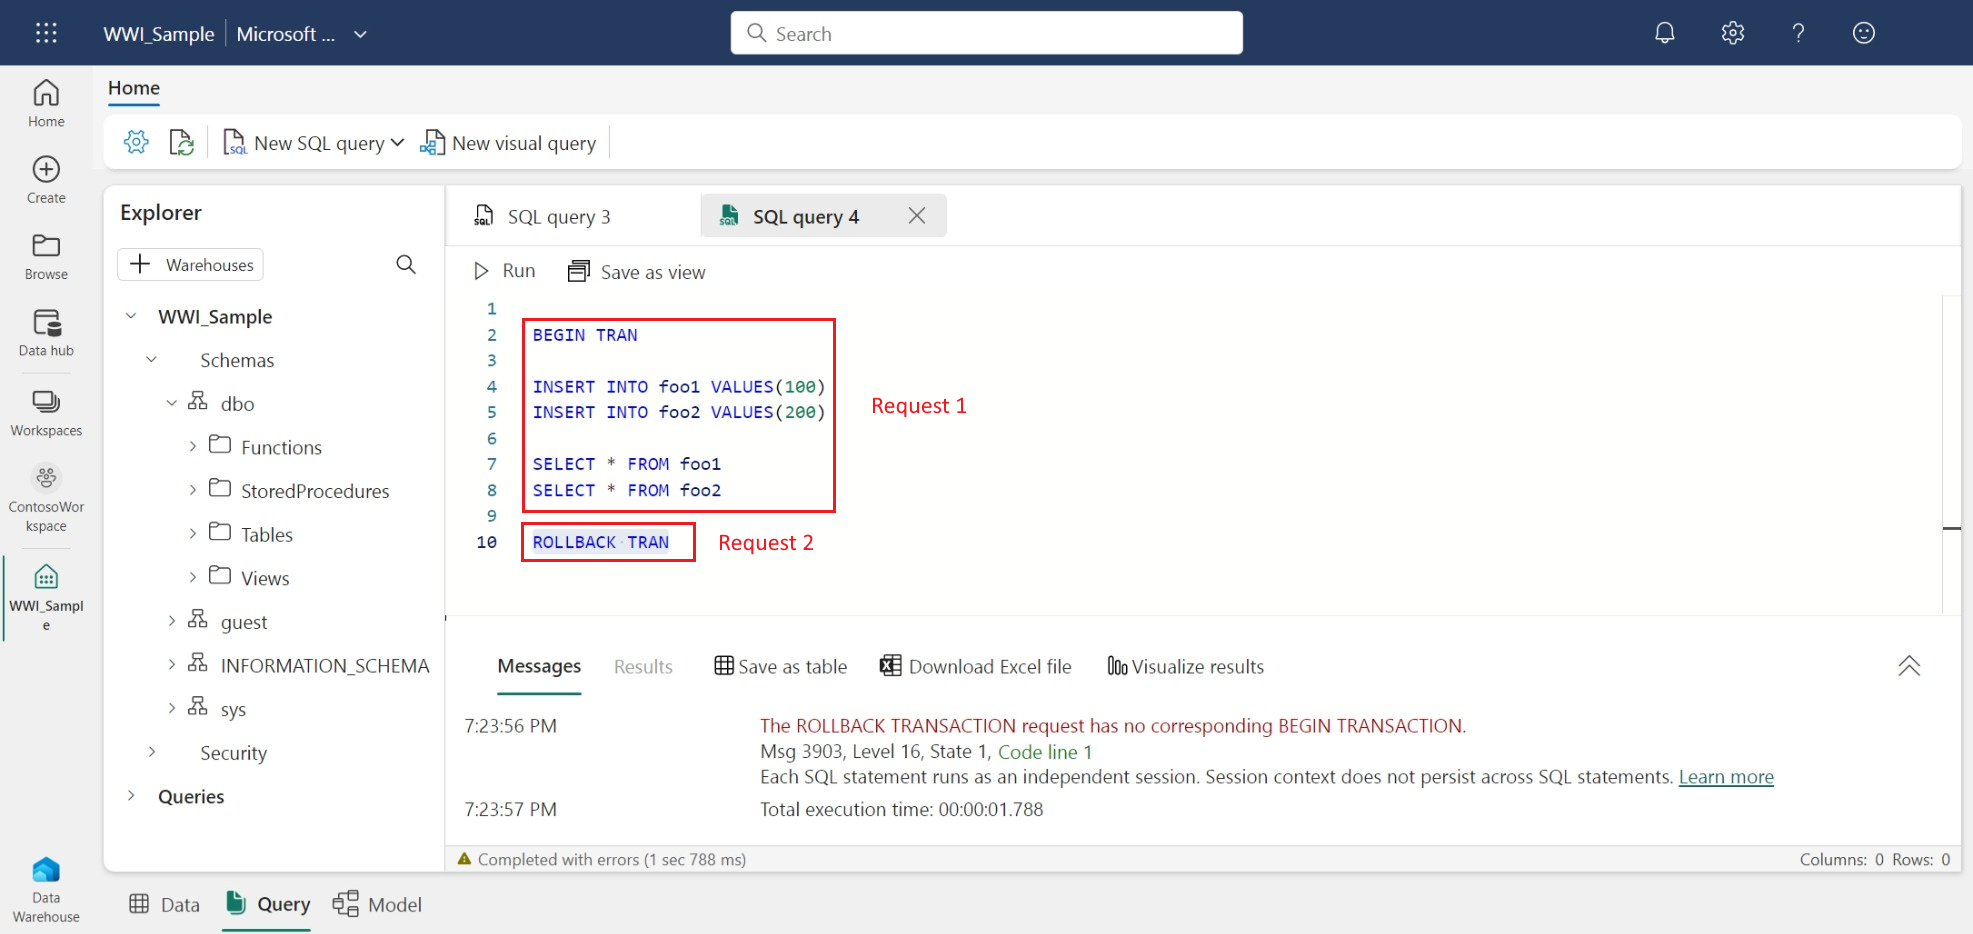
You can run Data Definition Language (DDL), Data Manipulation Language (DML), and Data Control Language (DCL) statements, but there are limitations for Transaction Control Language (TCL) statements. In the SQL query editor, when you select the Run button, you're submitting an independent batch request to execute. Each Run action in the SQL query editor is a batch request, and a session only exists per batch. Each execution of code in the same query window runs in a different batch and session.
- For example, when you independently execute transaction statements, the session context isn't retained. In the following screenshot,
BEGIN TRANis executed in the first request, but since the second request runs in a different session, there's no transaction to commit. The commit or rollback operation fails. If the SQL batch doesn't include aCOMMIT TRAN, the changes applied afterBEGIN TRANaren't committed.
The SQL query editor doesn't support
sp_set_session_context.In the SQL query editor, the
GOSQL command creates a new independent batch in a new session.
- For example, when you independently execute transaction statements, the session context isn't retained. In the following screenshot,
When you run a SQL query with USE, you need to submit the SQL query with
USEas one single request.Visualize results currently doesn't support SQL queries with an
ORDER BYclause.T-SQL statements that use the T-SQL
OPTIONsyntax aren't currently supported in the Explore this data or Visualize results options with DirectQuery mode. The workaround is to create visualizations in Power BI Desktop using Import mode.The following table summarizes the expected behavior that doesn't match with SQL Server Management Studio or the mssql extension with Visual Studio Code:
Scenario Supported in SSMS/ADS Supported in SQL query editor in Fabric portal Using SET Statements (Transact-SQL) to set properties for session Yes No Using sp_set_session_context (Transact-SQL) for multiple batch statements runs Yes No Transactions (Transact-SQL) (unless executed as a single batch request) Yes No
Related content
- Manage objects in your data warehouse
- Query using the Visual Query editor
- Tutorial: Create cross-warehouse queries with the SQL query editor


