التدريب
مسار التعلم
Use advance techniques in canvas apps to perform custom updates and optimization - Training
Use advance techniques in canvas apps to perform custom updates and optimization
لم يعد هذا المتصفح مدعومًا.
بادر بالترقية إلى Microsoft Edge للاستفادة من أحدث الميزات والتحديثات الأمنية والدعم الفني.
These are the latest features in the Stable release of Microsoft Edge DevTools.
تلميح
The Microsoft Build 2022 conference was on May 24-26. Learn more about new features for memory, performance, and production debugging in DevTools and new capabilities in the web platform for PWAs in the following videos:

The Microsoft Edge DevTools extension for Visual Studio Code now has a browser preview that allows you to emulate different devices. Click the new Emulate CSS media features ( ) button, to preview the current project in different modes, such as Dark, Light, Print, and High Contrast:
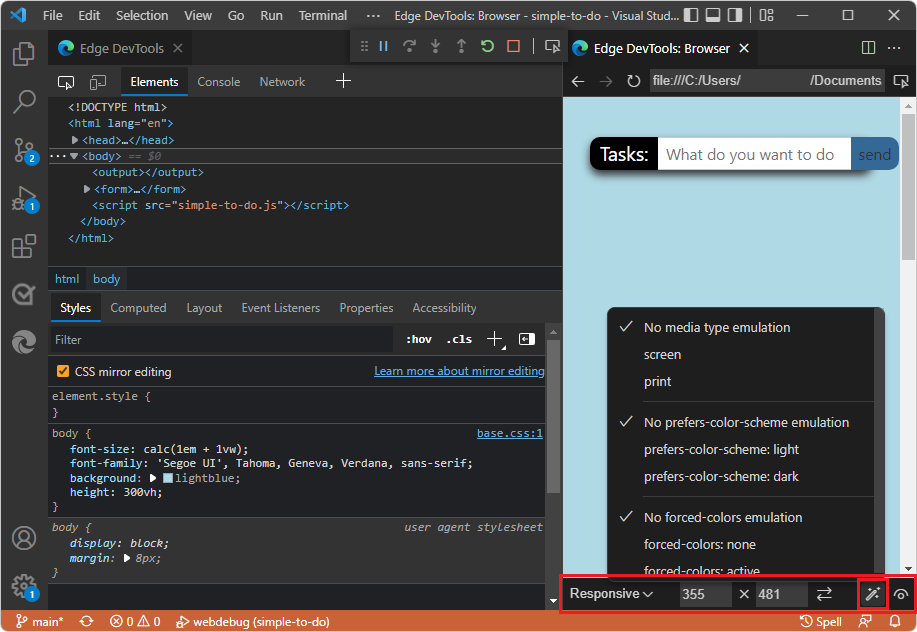
Click the new Emulate vision deficiencies ( ) button to easily test accessibility, such as showing what the webpage looks like with blurred vision or color vision deficiencies.
Other new features include a simpler way to toggle CSS mirroring, which now also supports sourcemaps. This means that you can debug and modify CSS created by Sass, React, and other abstractions live in the browser and see the changes in the source files.
See also:
In Microsoft Edge 102, when taking a heap snapshot in the Memory tool, you can now export all string objects from the snapshot to a JSON file. In the Memory tool, in the Constructor section, click the new Save all to file button next to the (string) entry.
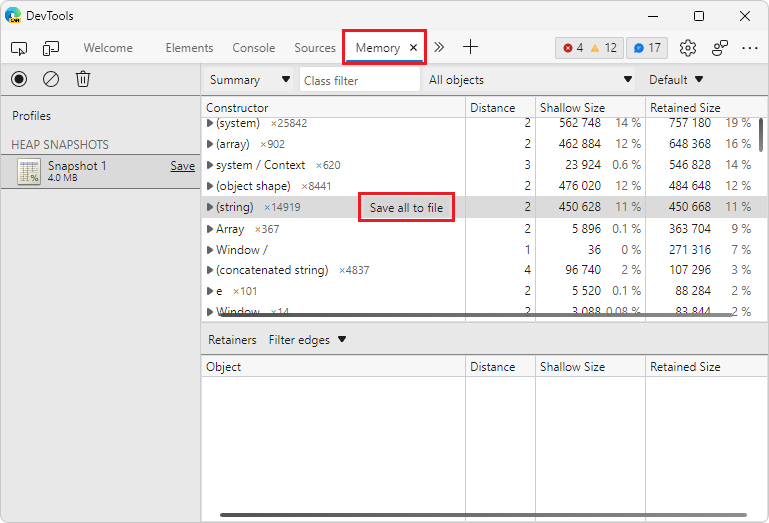
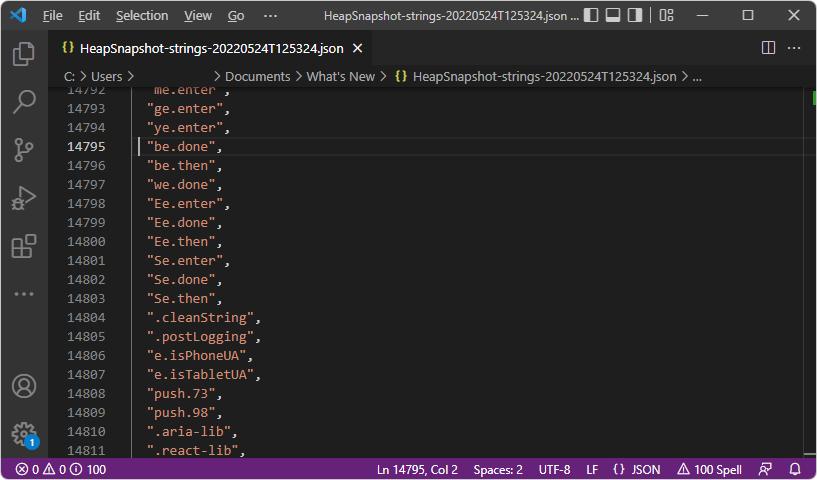
The Memory tool exports a JSON file that contains all of the string objects from the heap snapshot:
See also:
In previous versions of Microsoft Edge, cycles and internal nodes were displayed in the Retainers section of a heap snapshot. To help simplify the retainer path, in Microsoft Edge 102, the Retainers section in the Memory tool now has new filters to hide cycles and to hide internal nodes in the retainer path.
In the Retainers section, a cycled node is indicated by being grayed out.
In the following image, in the Filter edges dropdown menu, Hide cycled is not selected, so a cycled node (grayed out) is displayed:

In the following image, in the Filter edges dropdown menu, Hide cycled is selected, so the cycled node is not displayed:

Cycles are nodes that appear at least twice in a retainer path. One appearance of a node is earlier in the retainer path, and other appearances of that node are later in the retainer path. To free up memory, it's most important to remove the occurrence of the node which appears first in the retainer path. The second and potentially subsequent appearances of the node are still displayed in the Retainers section.
Internal nodes are objects that are specific to V8 (the JavaScript engine in Microsoft Edge). Internal nodes are also displayed in the Retainers section.
See also:
Previously, in the Elements tool, the overlay for the node that you selected only displayed on hover when you used the Inspect tool (![]() ). The previous design was difficult to use with a screen magnifier or other assistive technologies.
). The previous design was difficult to use with a screen magnifier or other assistive technologies.
In Microsoft Edge 102, when using the Inspect tool and moving around the rendered webpage, you can keep the current Inspect overlay displayed. Press and hold Ctrl+Alt (Windows, Linux) or Ctrl+Option (macOS) while you move around in the rendered webpage. The existing tooltip and grid color overlay for the Inspect tool remains displayed while you hover over different parts of the rendered webpage:
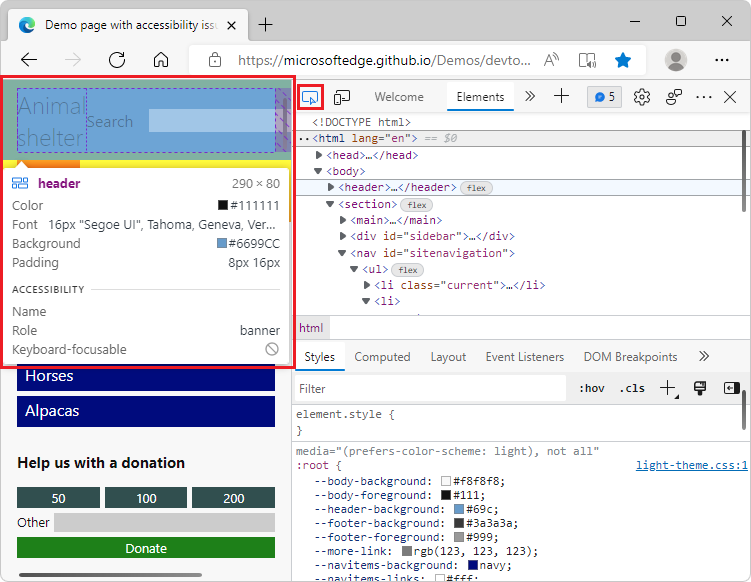
Also, you can now press Ctrl to hide the Inspect tool's overlay while you move the mouse pointer over the rendered webpage.
For the history of this feature in the Chromium open-source project, see Issue 1316208.
See also:
In previous versions of Microsoft Edge, the following items didn't render correctly in high-contrast mode:
In Microsoft Edge 102, these issues have been fixed.
The Issues tool's menus are displayed correctly in high-contrast mode:

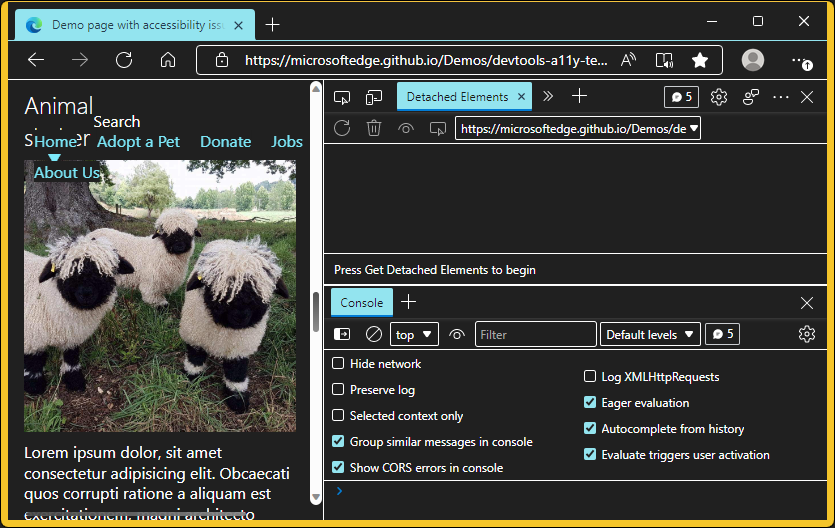
The Detached Elements tool's UI is displayed correctly in high-contrast mode:
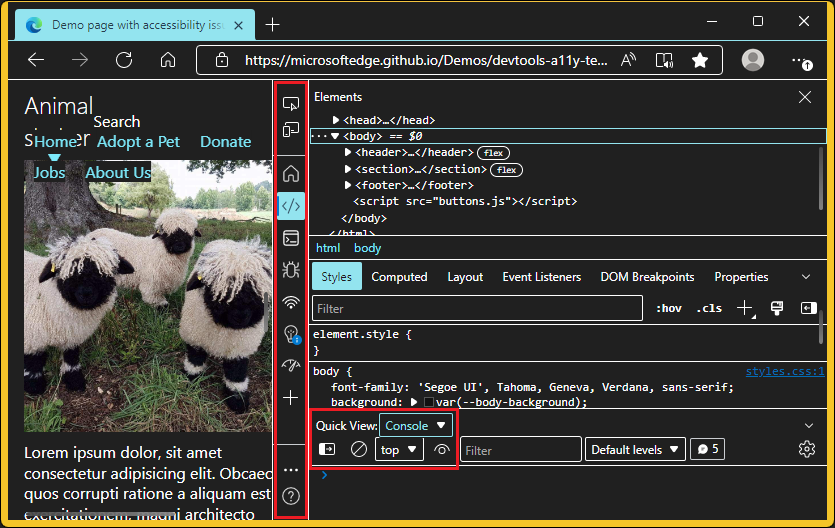
The Activity Bar and Quick View panel (when using Focus Mode) are displayed correctly in high-contrast mode:
See also:
In the Settings > Experiments page, each experiment now has a Help (![]() ) button:
) button:
![]()
To get more information about an experimental feature, click the corresponding Help (![]() ) button. The Help button displays the relevant section of the Experimental features in Microsoft Edge DevTools article.
) button. The Help button displays the relevant section of the Experimental features in Microsoft Edge DevTools article.
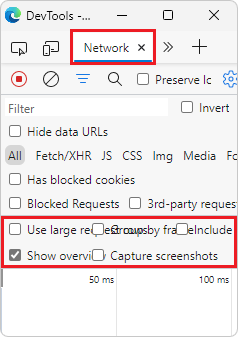
In previous versions of Microsoft Edge, opening Network settings with the gear icon in the Network tool would overlap when the DevTools were very narrow:
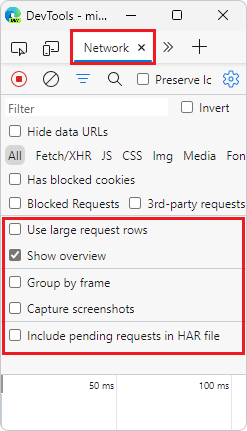
In Microsoft Edge 102, this issue has been fixed. The individual settings now display better in narrow layouts:
See also:
Microsoft Edge 102 also includes the following updates from the Chromium project:
التدريب
مسار التعلم
Use advance techniques in canvas apps to perform custom updates and optimization - Training
Use advance techniques in canvas apps to perform custom updates and optimization
الوثائق
What's New in DevTools (Microsoft Edge 107) - Microsoft Edge Developer documentation
Automate WebView2 with Playwright. Focus Mode Activity Bar icons have tooltips. New shortcut key for Command Palette. Memory tool loads larger heap snapshots. Links in Application tool render in high contrast mode. And more.
What's New in DevTools (Microsoft Edge 110) - Microsoft Edge Developer documentation
Faster heap snapshots in Memory tool. Move tools between Activity Bar and Quick View in Focus Mode. Screen readers report when More Tools is expanded. Change Dock and Activity Bar location via keyboard. Screen readers announce which theme is selected. Improved support for contrast themes. And more.
What's New in DevTools (Microsoft Edge 84) - Microsoft Edge Developer documentation
Use DevTools in Windows high contrast mode, match keyboard shortcuts in DevTools to Visual Studio Code, and more.