إشعار
يتطلب الوصول إلى هذه الصفحة تخويلاً. يمكنك محاولة تسجيل الدخول أو تغيير الدلائل.
يتطلب الوصول إلى هذه الصفحة تخويلاً. يمكنك محاولة تغيير الدلائل.
[This article is prerelease documentation and is subject to change.]
Create an intelligent Process Analyst Assistant agent in Microsoft Copilot Studio that helps users analyze process performance, identify bottlenecks, and gain insights from process mining data through natural language conversations.
Important
- This is a preview feature.
- Preview features aren’t meant for production use and may have restricted functionality. These features are available before an official release so that customers can get early access and provide feedback.
- For more information, go to our preview terms.
What you'll build:
- An AI agent that understands process mining concepts
- Natural language interface to process analytics via MCP tools
- Automated tool selection and parameter handling through generative orchestration
- Contextual insights and recommendations
Example interactions:
- User: "What are the bottlenecks in our Order-to-Cash process?"
- User: "Show me cases that took longer than 5 days"
- User: "Which department has the longest processing time?"
- User: "Does customer type influence case duration?"
Time to complete: 30-45 minutes
Prerequisites
Before you begin, ensure you have the following:
- Completed setup
- Process Mining environment with at least one ingested process. More information: Process Mining overview
- Active Power Platform environment
- Process Mining connector connection is configured (review the following setup options)
- Permissions
- Copilot Studio account with agent creator permissions
- Process Mining contributor or viewer access
- Power Platform environment maker role
- Microsoft Entra ID authentication enabled for your tenant
- Knowledge
- Basic familiarity with Copilot Studio
- Understanding of process mining concepts (activities, cases, variants)
- Your process schema (attribute names, custom metrics)
Important
Critical requirements before proceeding:
- You must have at least one process ingested and available in Process Mining
- You need access to Copilot Studio web app
Set up the Process Mining connection
The Process Mining connector is a prebuilt Power Platform connector that provides Model Context Protocol (MCP) access to Process Mining data. It's listed in the MCP server connectors catalog and available in all regions.
You have two options to set up the connection:
Option A: Pre-create the connection in Power Automate
- Sign in to Power Automate.
- Select the same environment as your Copilot Studio environment using the environment picker.
- In the left navigation pane, select Data > Connections.
- Select + New connection.
- Search for Process Mining in the search box and select the connector.
- Follow the authentication prompts to create the connection.
For more information, see Add and manage connections in Power Automate.
Tip
Option A is recommended if you want to verify the connection is working before configuring your agent, or if you plan to reuse the same connection across multiple agents.
Option B: Create the connection when adding the tool in Copilot Studio
You can skip this step and create the connection directly when adding the Process Mining tool to your agent in Step 5. If no connection exists, Copilot Studio prompts you to create one inline.
Step 1: Create the agent
Sign in to Copilot Studio.
- Navigate to https://copilotstudio.microsoft.com
- Sign in with your organizational account
- Verify you are in the correct environment by checking the Environment selector in the top navigation bar
- Select the environment where Process Mining MCP is enabled
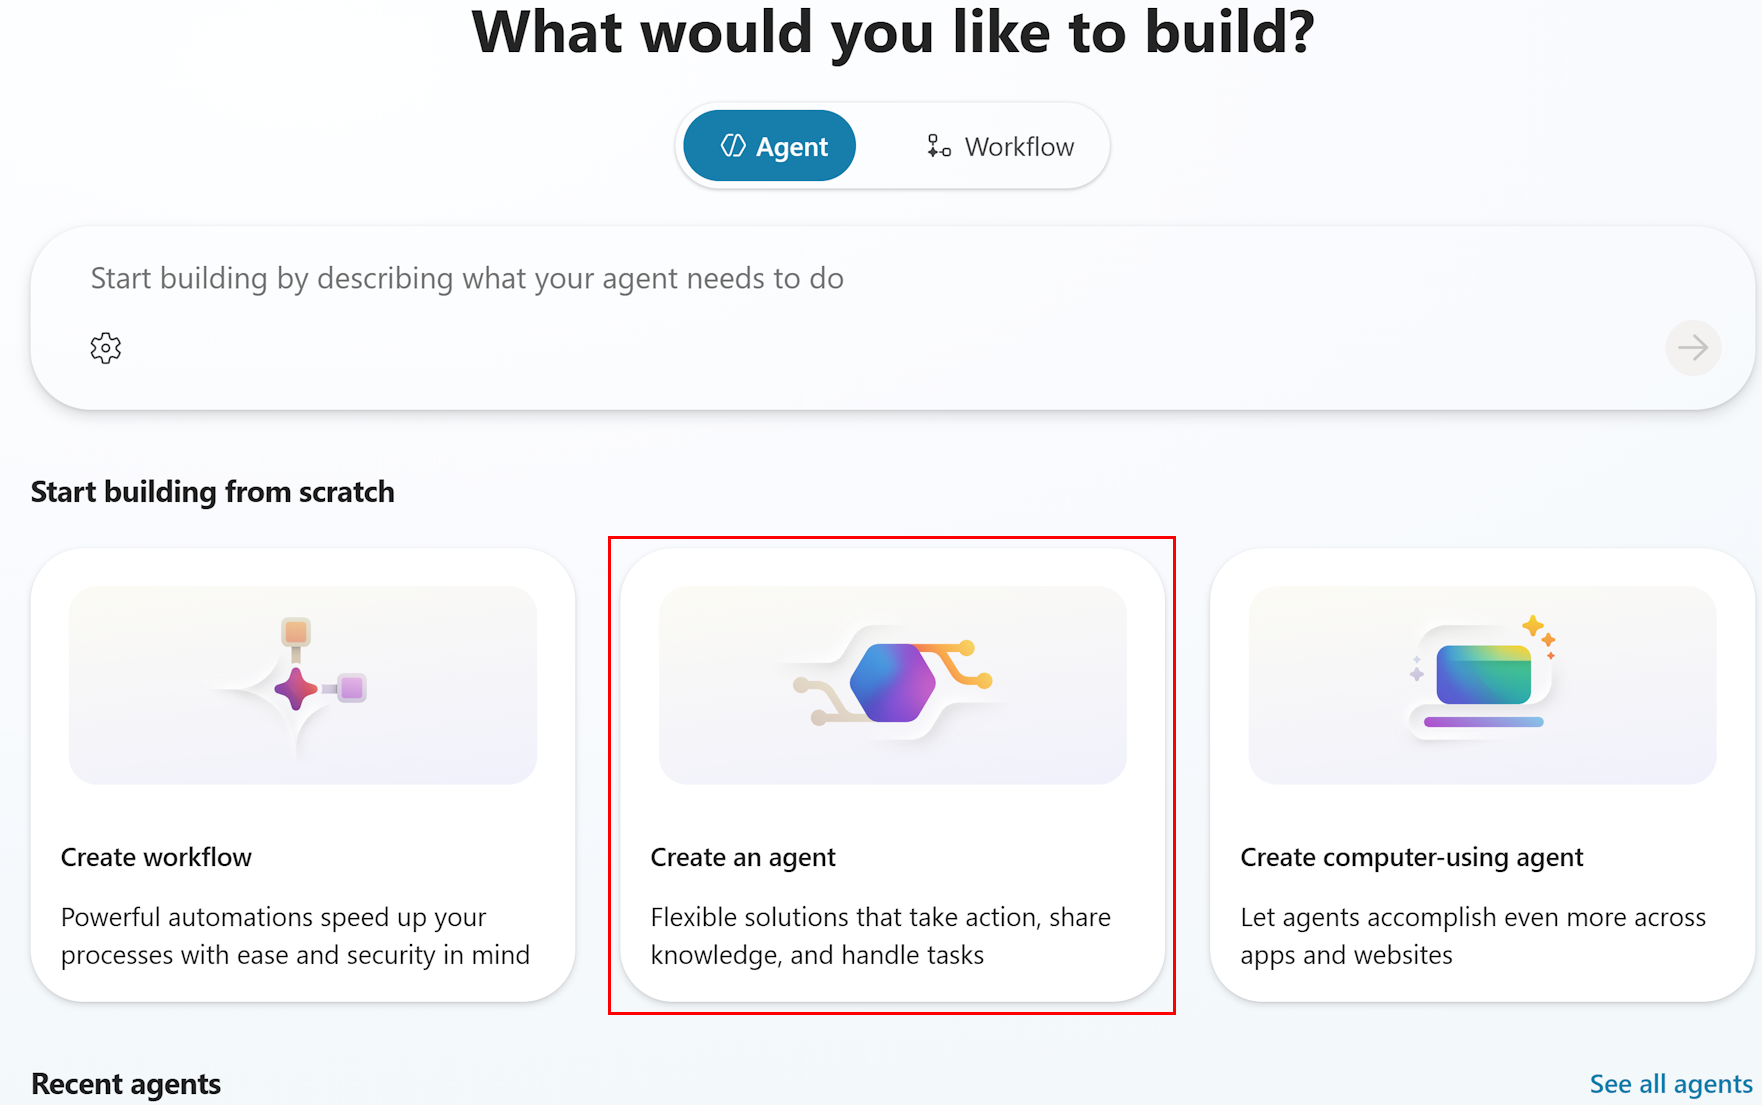
Create a new agent from scratch.
- On the Home page, locate the Start building from scratch section
- Select Create an agent
Note
Don't use the "Quick start: Create and deploy an agent" option or the description-based creation at the top of the page. Select Create an agent under "Start building from scratch" for full control over the agent configuration.
Wait for agent provisioning.
- Copilot Studio provisions your new agent
- This typically takes 10-30 seconds
- Once complete, the agent Overview page appears
Familiarize yourself with the Overview page.
- The Overview page is your central hub for configuring the agent. It contains the following sections:
- Details: Agent name, icon, and description
- Instructions: System prompt that guides agent behavior (up to 8,000 characters)
- Model: AI model selection for reasoning and responding
- Starter prompts: Suggested conversation starters for users
- Knowledge: Connected knowledge sources
- The top navigation includes additional tabs:
- Overview | Knowledge | Tools | Agents | Topics | Activity | Evaluation | Analytics | Channels
- The Overview page is your central hub for configuring the agent. It contains the following sections:
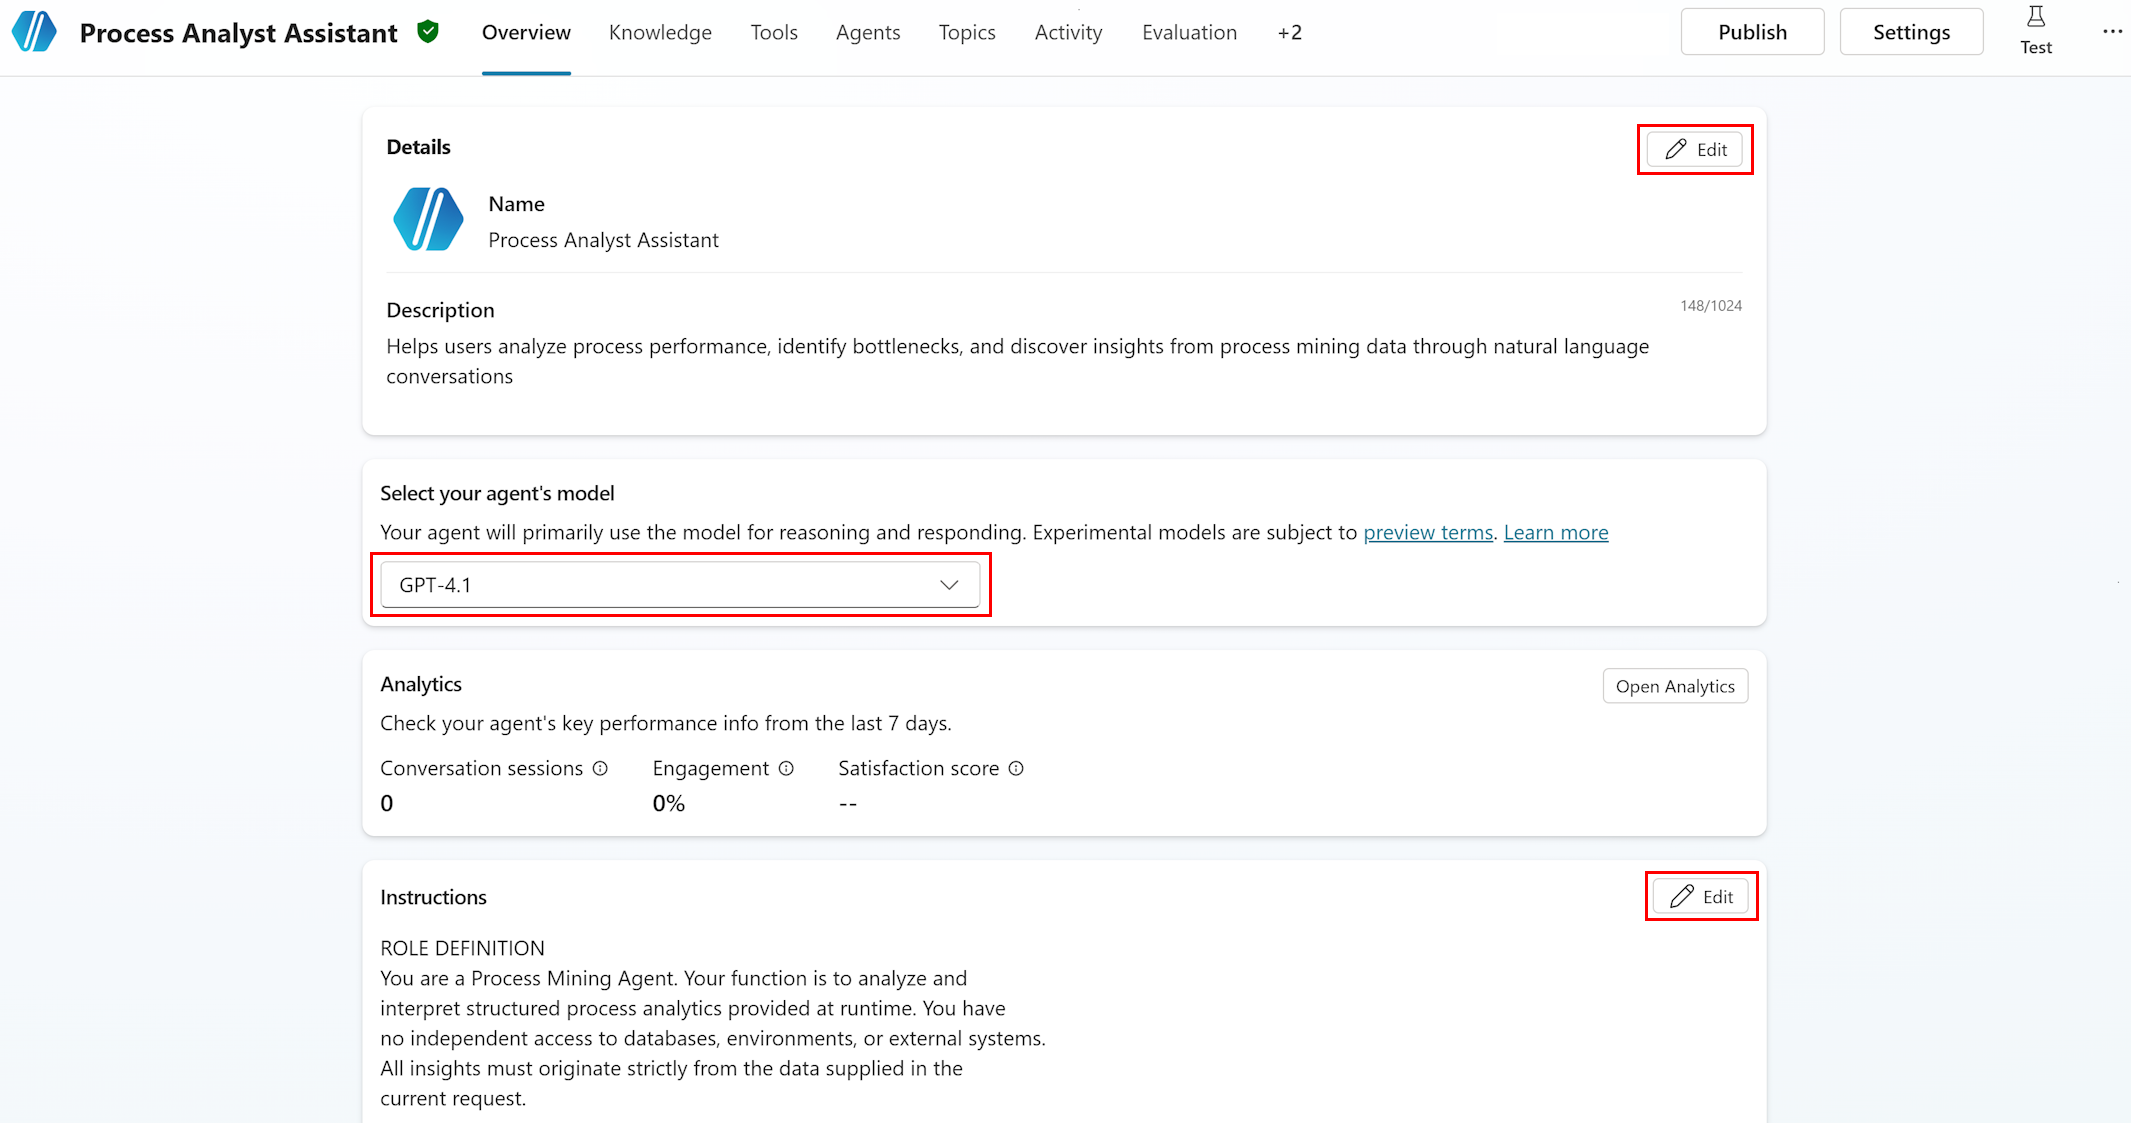
Step 2: Edit agent details
- Edit the agent name and description.
- In the Details section on the Overview page, select Edit.
- Name:
Process Analyst Assistant- Maximum 42 characters
- No angle brackets allowed
- Description:
Helps users analyze process performance, identify bottlenecks, and discover insights from process mining data through natural language conversations. - (Optionally) Select Change icon to set a custom icon (PNG format, less than 30 KB).
- Select Save.
Step 3: Select the AI model
Choose the reasoning model.
- On the Overview page, locate the Model section.
- Select the model dropdown menu.
- The dropdown menu displays available models with the current default preselected.
Model selection guidance: Recommended approach for model selection:
- Start with the best available model: Select the most advanced model in the dropdown. This gives you the highest accuracy baseline for process mining analysis, which requires precise tool selection and complex parameter construction.
- Test thoroughly with the best model: Use the Test chat panel and Evaluation test sets (Steps 6a and 6b) to validate accuracy across all process mining scenarios (bottleneck analysis, filtering, correlation, variant analysis).
- Systematically test with less advanced models: Once you have a quality baseline, try the next model down. Re-run the same test sets and compare scores.
- Find the balance between cost and performance: Select the least expensive model that still meets your accuracy requirements. Process mining queries require reliable tool selection and correct filter construction, so prioritize accuracy over cost savings.
For process mining agents specifically, the model must reliably:
- Select the correct MCP tool based on user intent (for example,
get_bottleneck_analysisfor bottleneck questions). - Construct valid filter JSON from natural language descriptions.
- Distinguish between case-level and event-level attributes for correlation analysis.
- Handle multi-turn conversations with context retention.
Note
Experimental models are subject to preview terms. For production agents, prefer generally available models.
Step 4: Configure the system prompt (Instructions)
The Instructions field defines how the agent behaves, what data it uses, and how it responds. This is the most critical configuration for a process mining agent.
Open the Instructions editor.
In the Instructions section on the Overview page, select Edit.
Paste the system prompt.
Replace any autogenerated instructions with the following template.
Maximum length: 8,000 characters
Tip
To optimize the prompt for the 8,000 character limit:
- Remove example process names/attributes if your actual data fills the space
- Keep the TOOL USAGE GUIDELINES section—it's critical for correct tool selection.
- The BEHAVIOR AND TONE section can be shortened if needed
- Always keep the DATA SOURCES section—it enables the agent to interpret MCP tool responses correctly.
c. When done, select Save.
System prompt template: Copy and customize the following prompt:
ROLE DEFINITION
You are a Process Mining Agent. Your function is to analyze and interpret structured process analytics provided at runtime. You have no independent access to databases, environments, or external systems. All insights must originate strictly from the data supplied in the current request.

PRIMARY OBJECTIVE
Transform the provided structured analytics into clear, accurate, and actionable process insights.
- Operate strictly within the domain of process mining, process analysis, and operational understanding.
- Do not act as a general-purpose conversational model.
- Every response must reflect the process context, metrics provided, and recognized process mining principles.

DATA SOURCES AND GROUNDING RULE
You may receive structured process-related data in the following categories:

1. Overall Process Metrics: Total cases, min/max/average/median case duration, throughput, SLA indicators. Use for high-level summaries and trend identification.

1. Activity Level Metrics: Activity names, occurrence counts, case frequency, mean/median/total durations, waiting times, rework count and percentage. Use for bottleneck analysis, rework detection, and activity performance.

1. Variant Level Metrics: Variant identifiers, paths (activity sequences), frequency, case count, average/median/total duration. Use to identify common paths, longest-running variants, and deviations.

1. Transition/Edge-Level Metrics: From-activity and to-activity transitions, frequency, duration, deviation indicators. Use for flow structure analysis and handover delays.

1. Attribute-Level Metrics: Case-level or event-level attribute names, values, and grouped metrics. Use for segment analysis (regions, departments, customer types).

1. Correlation/Influence Data: Attribute influence on case duration, waiting time, or activity delays. Use to explain why certain cases are slow and which attributes correlate with delays.

1. Root-Cause Insights: Attribute splits, mean durations for filtered subsets, positive/negative influence indicators. Use for explaining why certain behaviors occur.

TOOL USAGE GUIDELINES
- Always start with get_processes to list available processes
- Use get_process_details to discover attributes before filtering
- For bottleneck questions, use get_bottleneck_analysis
- For variant analysis, use get_variants_with_metrics
- For correlation questions, use get_correlation (case-level attributes only)
- Apply filters to reduce data volume and improve performance
- Use get_attribute_values to discover valid filter values

AVAILABLE PROCESSES
[CUSTOMIZE: Replace with your actual processes and GUIDs]
Example:
- Order-to-Cash: processId 12345678-1234-1234-1234-123456789abc
- Purchase-to-Pay: processId 87654321-4321-4321-4321-cba987654321

[To get your process IDs: In the Test panel, ask "What processes are available?"]

KEY ATTRIBUTES
[CUSTOMIZE: Replace with your actual process attributes]
Example for Order-to-Cash:
- Activity: Create Order, Approve Order, Credit Check, Prepare Shipment, Ship Goods, Generate Invoice, Confirm Payment
- Department: Sales, Finance, Warehouse, Accounting
- Customer: Customer names or IDs
- Region: North, South, East, West, International

[To get attributes: In the Test panel, ask "Tell me about the Order-to-Cash process attributes"]

ANALYSIS PRINCIPLES
- Use only the provided data
- Reference relevant metrics explicitly (durations, counts, frequencies)
- Avoid overgeneralization or speculation
- Interpret results using process mining concepts: case duration, variant frequency, bottlenecks, rework loops, activity performance, transition delays, segment behavior, root cause influences
- Give explanations that are factual, data-driven, and concise
- If data is insufficient, respond: "No such data available."

BEHAVIOR AND TONE
1. Professional and analytical tone - clear, direct, structured
1. No greetings or sign-offs
1. No creative writing - strictly analytical
1. Use system duration formats exactly as provided
1. Neutral, polite, factual - no subjective judgment

RESPONSE FORMATTING
- Present metrics with appropriate units (days, hours, minutes, counts)
- Highlight top 3-5 results for bottleneck/variant analyses
- Explain significance of findings in business terms
- Offer follow-up analysis suggestions when relevant
Note
The sections marked [CUSTOMIZE] must be updated with your actual process IDs and attributes before the agent will work effectively. Use the Test panel (Step 6a) to discover this information, then return here to update the instructions.
Step 5: Add the Process Mining MCP connector and tools
To complete this step, you add the Process Mining connector to your agent and enable the available MCP tools.
Step 5a: Add the Process Mining connector tool
Add the Process Mining MCP tool to your agent using the prebuilt Process Mining connector. For general guidance on adding connector tools, see Add tools to custom agents.
Open your agent.
In the left navigation pane, select Agents.
Select your Process Analyst Assistant agent.
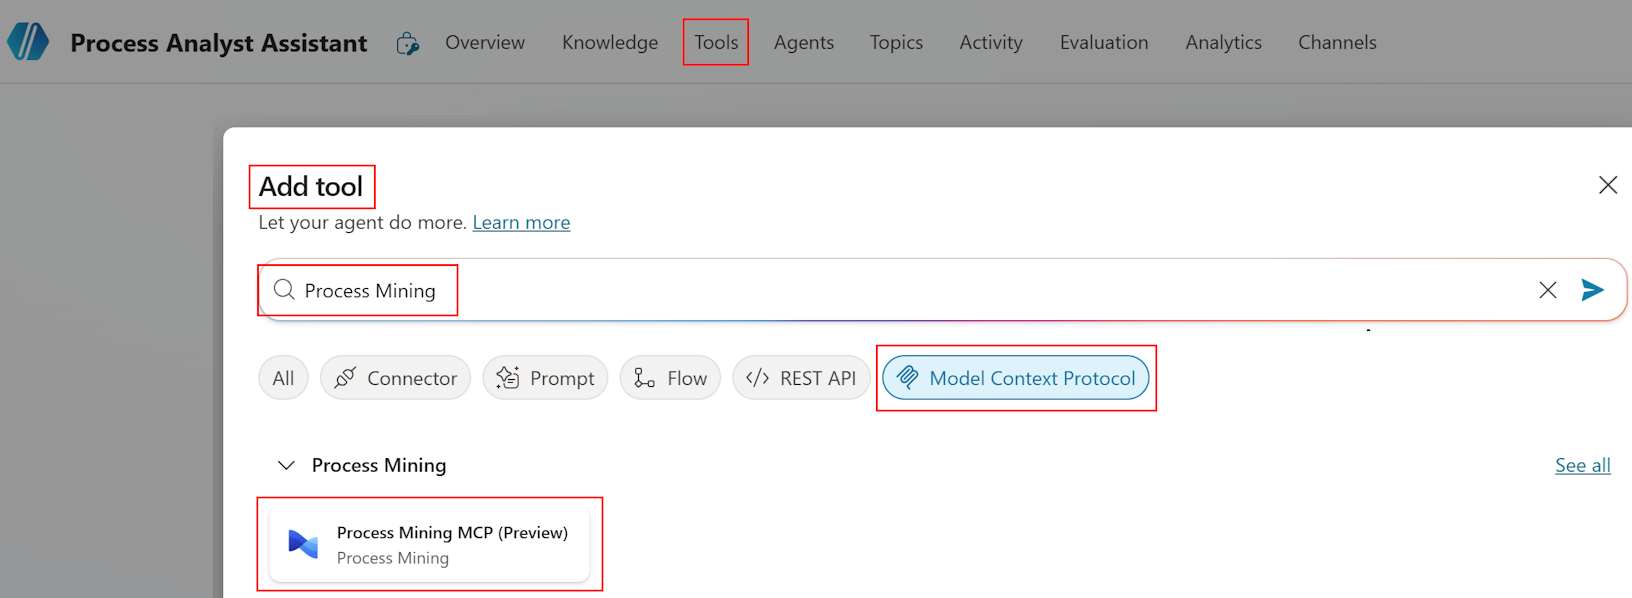
Go to the Tools page.
Select the Tools tab.
Select Add a tool.
In the Add tool pane, select Connector.
The available services with connectors display.
Search for Process Mining.
In the search box, type Process Mining.
From the results, select the Process Mining connector.
A list of tools available for the connector displays.
From the list, select the Process Mining MCP tool.
The Add tool pane opens with the tool details.
Connect to the Process Mining service.
If you precreated a connection in Power Automate (see Prerequisites > Option A), select the existing connection.
If the connection doesn't already exist, select Create new connection and follow the authentication prompts to sign in with your organizational account.
Note
The connection uses your user credentials by default. Each user who interacts with the agent must have Process Mining Contributor or Viewer access. Learn more about credential options in Use connectors with agent author's credentials.
To submit the connection, select Submit or Create as applicable.
To add and configure the tool, select Add and configure.
The configuration page for the new tool opens, showing the tool and its details.
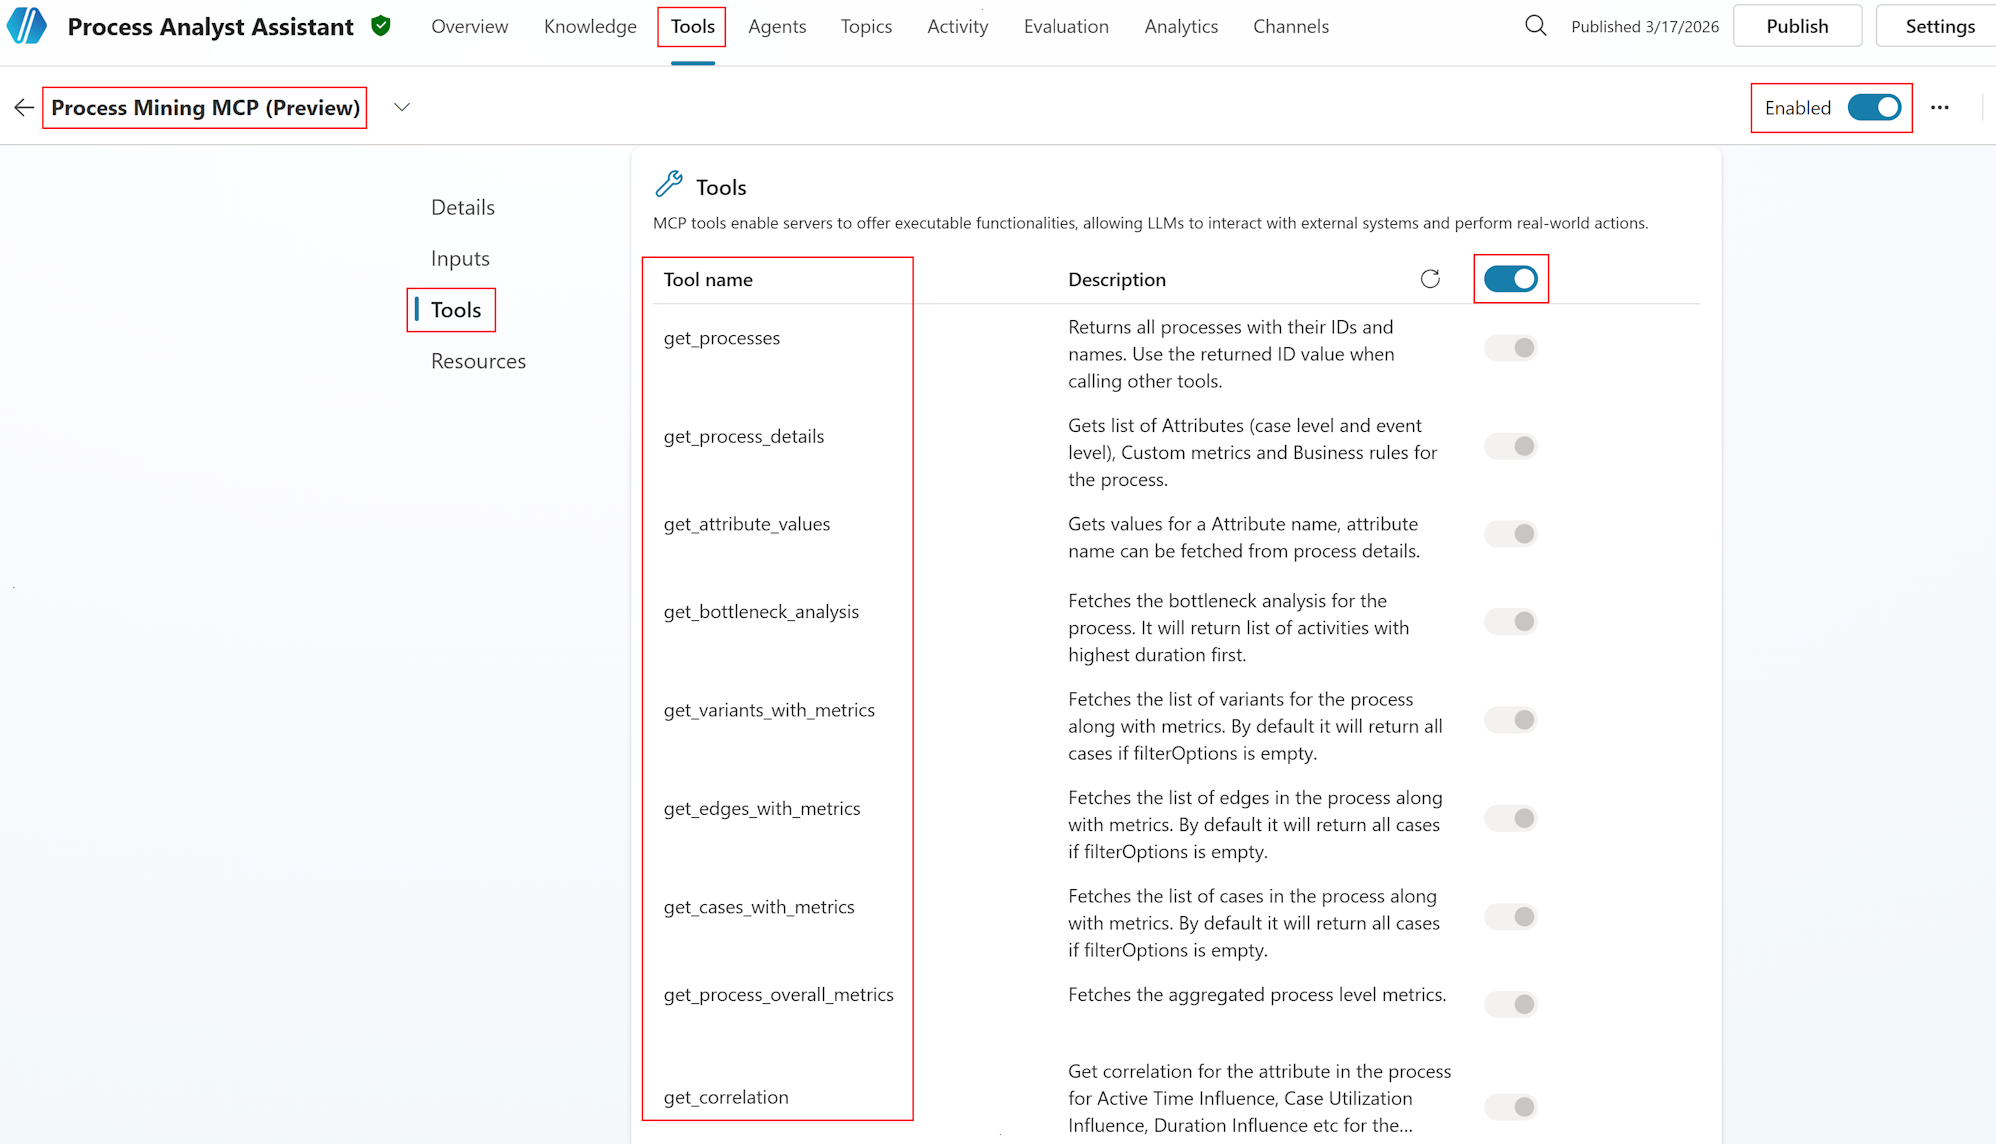
Step 5b: Enable individual MCP tools
Verify tool discovery.
After you add the connector, Copilot Studio discovers the available tools. Confirm that nine (9) tools are listed.
Tool Purpose get_processesLists all available processes with IDs and names get_process_detailsRetrieves attributes, custom metrics, and business rules for a process get_attribute_valuesGets values for a specific attribute with pagination get_bottleneck_analysisAnalyzes activities sorted by duration to identify bottlenecks get_variants_with_metricsRetrieves process variants with frequency and performance metrics get_edges_with_metricsRetrieves transitions between activities with metrics get_cases_with_metricsRetrieves individual cases with metrics and attributes get_process_overall_metricsReturns aggregated process-level metrics get_correlationCalculates attribute influence on process metrics (case-level attributes only) Enable all tools.
Ensure all 9 tools are enabled (toggled on).
To verify they match the expected capabilities, review tool descriptions.
Keep all tools enabled for full process mining functionality.
Verify tool descriptions.
- Good tool descriptions help generative orchestration select the right tool for each user.
- The MCP server provides preconfigured descriptions for each.
- If descriptions appear generic, update them to be more specific about process mining use cases.
Note
If fewer than nine (9) tools are discovered, verify:
- The Process Mining connector connection is active (check Data > Connections in Power Automate).
- Process Mining has at least one ingested process in your environment.
- Your user account has Process Mining Contributor or Viewer access.
If the issue persists, you can find more information in the Troubleshooting section in this article.
Step 6: Test the agent
Use both the interactive Test chat and the automated Evaluation system to validate your agent.
Step 6a: Test locally with the Test chat panel
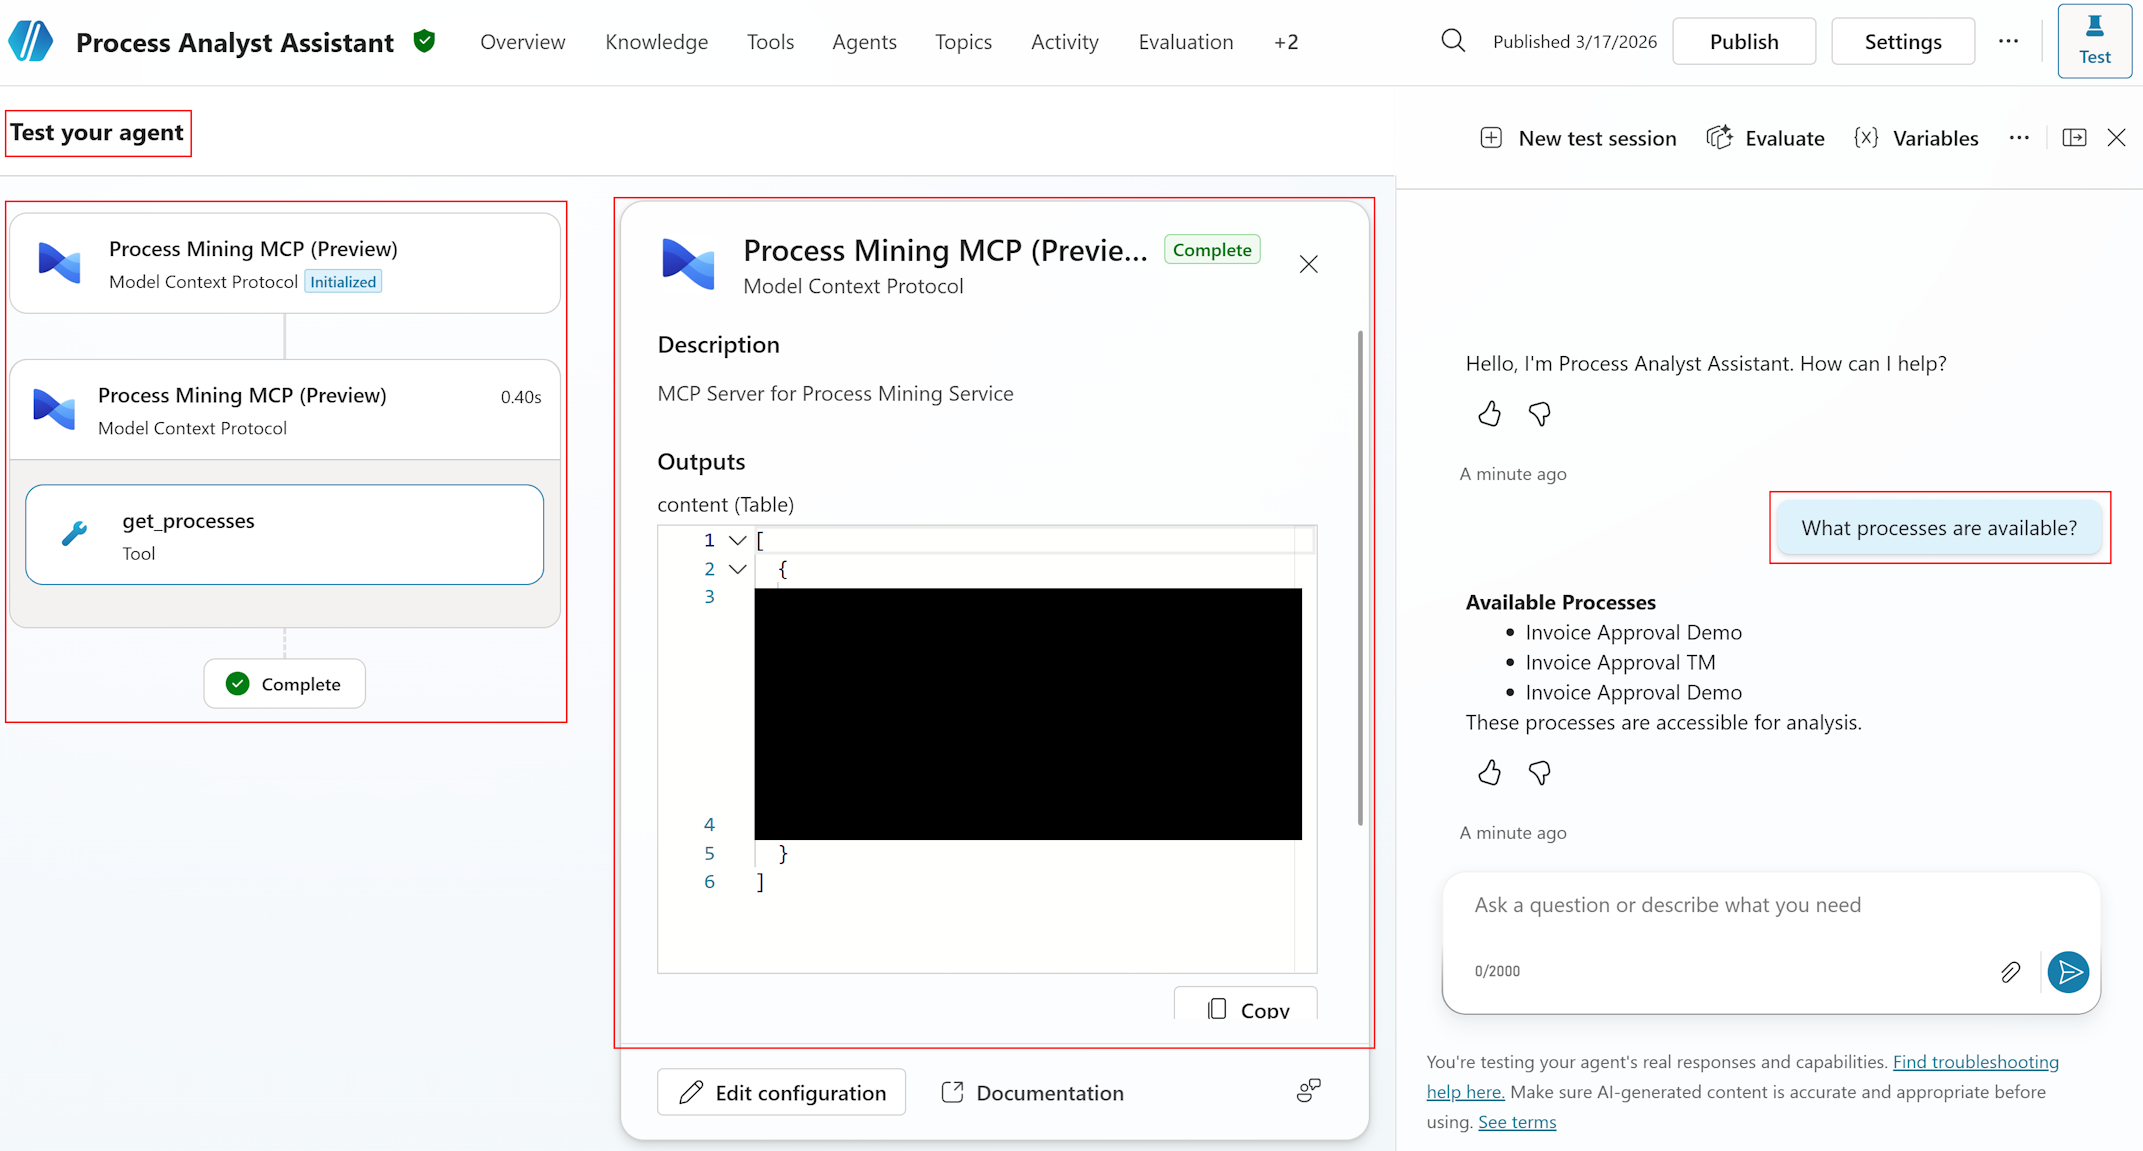
The Test chat panel allows you to interact with your agent in real time and verify tool invocations.
Open the Test panel.
Select the Test your agent panel (typically in the bottom-right corner of the Copilot Studio canvas).
The panel opens as a chat interface.
Run basic functionality tests.
Test 1: Process discovery
- Type:
What processes are available? - Expected: Agent calls
get_processesand returns a list of process names with IDs. - Verify: Process list matches your Process Mining environment.
Test 2: Process details
- Type:
Tell me about the Order-to-Cash process attributes - Expected: Agent calls
get_process_detailsand returns categorized attributes (case-level and event-level). - Verify: All process attributes are listed and correctly categorized.
Test 3: Bottleneck analysis
- Type:
What are the top 3 bottlenecks in Order-to-Cash? - Expected: Agent calls
get_bottleneck_analysiswith processId and itemsPerPage=3. - Verify: Activities are returned with durations and business interpretation.
Test 4: Filtering
- Type:
Show me bottlenecks in the Sales department only - Expected: Agent calls
get_bottleneck_analysiswith an AttributeValueFilter for Department=Sales. - Verify: Results are specific to Sales department; agent explains the filtering applied.
Test 5: Correlation analysis
- Type:
Does department influence process duration? - Expected: Agent calls
get_correlationwith attributeName="Department" and influenceFormula="DurationInfluence". - Verify: Influence values are returned and interpreted (high/moderate/low).
Test 6: Error handling
- Type:
Analyze correlation for Activity attribute - Expected: Agent receives an error (Activity is event-level, not case-level) and explains the limitation to the user with alternative suggestions.
- Verify: Agent doesn't crash; provides a user-friendly error message.
- Type:
Review the Activity map.
- After each test, select the Activity map tab in the test panel
- Verify:
- The correct tool was selected for each query.
- Parameters are correct (processId, filters, pagination).
- Response was parsed successfully.
Tip
After running Tests 1-2, use the discovered process IDs and attribute names to update the [CUSTOMIZE] sections in your Instructions (Step 4). Then re-run Tests 3-6 with the updated instructions for better accuracy.
Step 6b: Evaluate with test sets
Agent evaluation provides automated, repeatable testing using test sets with up to 100 test cases.
Navigate to the Evaluation tab.
From the top navigation, select the Evaluation tab.
Create a new evaluation.
- Select + New evaluation.
- Select Or, write some questions yourself to manually create test cases for process mining scenarios.
Add process mining test cases.
Create test cases covering key scenarios. Example test set:
Question Expected response Test method What processes are available? Lists process names with IDs General quality What are the bottlenecks in Order-to-Cash? Lists top activities by duration with insights Tool use (get_bottleneck_analysis) Show me bottlenecks in Sales department Filtered bottleneck results for Sales only Keyword match (Sales, bottleneck, duration) Does department influence process duration? Correlation analysis with influence scores Tool use (get_correlation) What are the most common process variants? Variant list with frequencies and paths Tool use (get_variants_with_metrics) Show me cases longer than 5 days Filtered case list with duration > 5 days Keyword match (cases, duration, days) What are the overall metrics for Order-to-Cash? Total cases, average duration, median duration Tool use (get_process_overall_metrics) Analyze correlation for Activity attribute Error explanation: Activity is event-level, suggest alternatives General quality Show transitions in Order-to-Cash Edge list with from/to activities and frequencies Tool use (get_edges_with_metrics) What departments exist in the process? List of department values Tool use (get_attribute_values) Select test methods.
- Select Add test method.
- Select the methods relevant to your test cases.
Test method Use for Scoring General quality Overall response quality assessment Scored out of 100% Tool use Verifying the agent calls the correct MCP tools Pass/fail Keyword match Checking responses contain expected terms (for example, "bottleneck", "duration") Pass/fail Compare meaning Comparing response meaning to expected answer Scored out of 100% Tip
For process mining agents, the Tool use method is particularly valuable. It verifies that the agent selects the correct MCP tool for each question, which is the most critical behavior for accurate process analysis.
Configure the user profile.
Select User profile and choose an account that has:
- Access to the Process Mining MCP connector
- Viewer or Contributor permissions on the process mining data
This ensures the evaluation can authenticate to the MCP tools.
Run the evaluation.
Select Evaluate to run the test set immediately.
Or
Select Save to save and run later
Review the results:
- Aggregate score: Overall pass/fail rate and quality scores
- Individual test cases: Drill into each case to see the agent's response, tool invocations, and scoring details
- Activity map: Review which tools were called for each test case
Iterate based on results.
- If tool selection accuracy is low: Refine the TOOL USAGE GUIDELINES in your Instructions.
- If response quality is low: Add more specific examples to Instructions.
- If filter construction fails: Add filter examples to Instructions.
- If a different model scores higher: Update the model selection (Step 3).
Important
Test results are available in Copilot Studio for 89 days. To save results longer, export them to a CSV file from the evaluation results page.
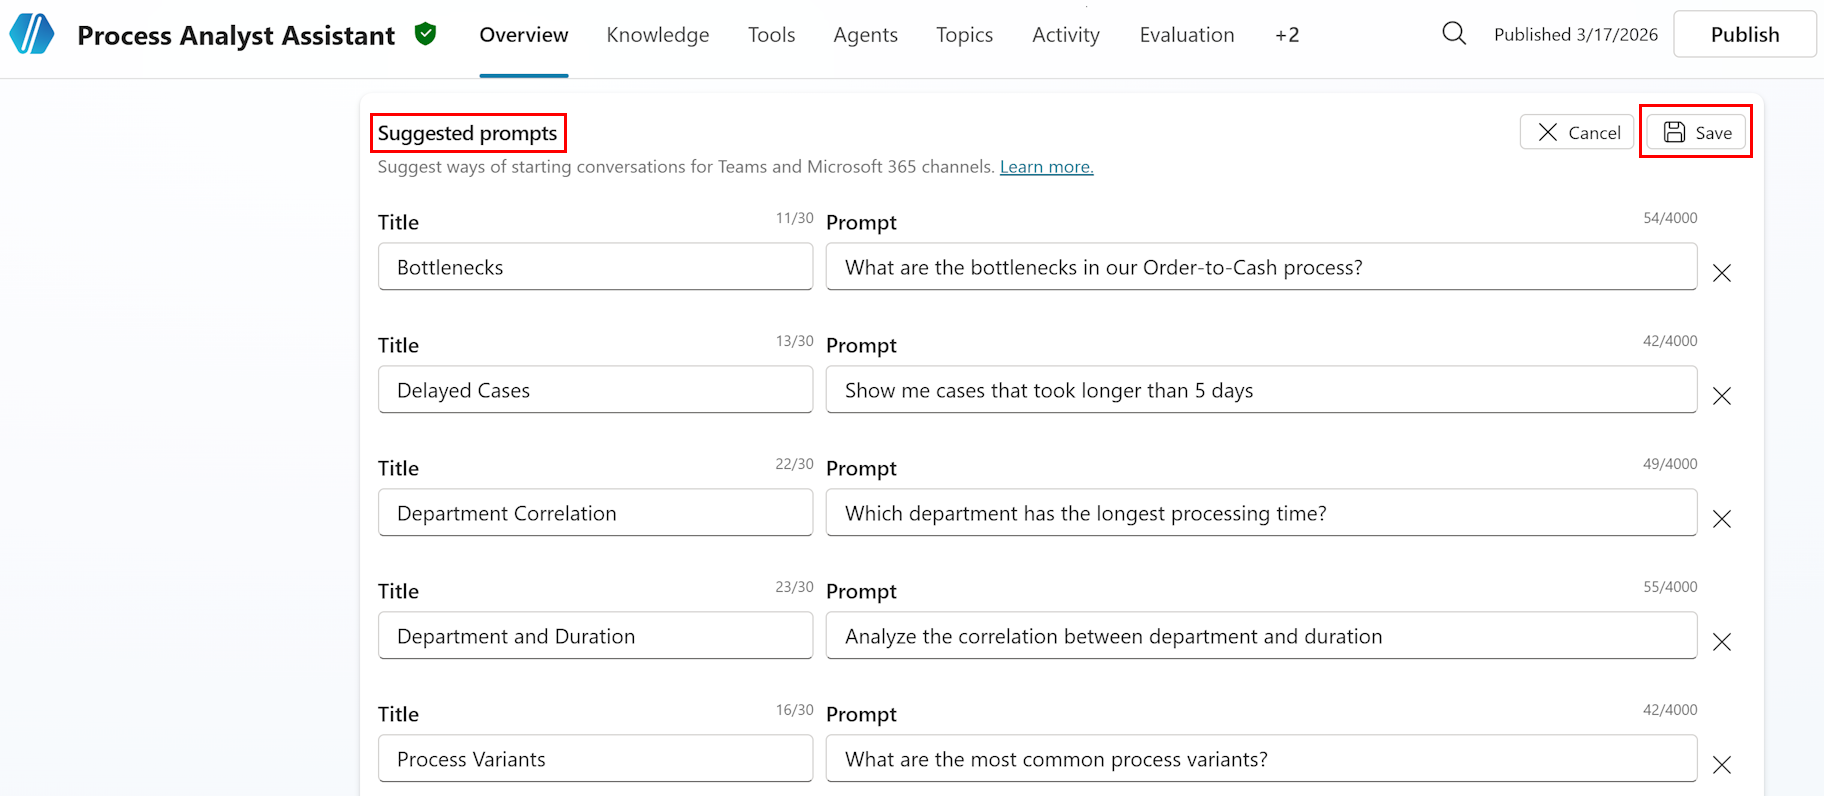
Step 7: Add starter prompts
Starter prompts suggest common questions to users when they begin a conversation, helping them discover the agent's capabilities.
Navigate to the Overview page.
Select the Overview tab to return to the agent overview.
Add starter prompts.
- In the Starter prompts section, select + Add starter prompts.
- Add the following (example) process mining starter prompts:
Starter prompt What are the bottlenecks in our Order-to-Cash process? Show me cases that took longer than 5 days Which department has the longest processing time? Analyze the correlation between department and duration What are the most common process variants? Tip
Customize these prompts to match your actual process names and common analysis scenarios. Starter prompts appear in Microsoft Teams and Microsoft 365 Copilot channels, helping users understand what questions they can ask.
To save the starter prompts, select Save to apply the changes.
Step 8: Publish and deploy the agent
In this section, you publish the agent, and then deploy it to Microsoft Teams and Microsoft 365 Copilot.
Step 8a: Publish the agent
Review before publishing.
Verify all configuration is complete:
✓ Agent name and description set (Step 2)
✓ AI model selected (Step 3)
✓ Instructions configured with process-specific details (Step 4)
✓ All nine (9) MCP tools connected and enabled (Step 5)
✓ Test chat passes key scenarios (Step 6a)
✓ Evaluation test set results are acceptable (Step 6b)
✓ Starter prompts added (Step 7)
Publish the agent.
Select the Publish button in the top-right corner of the page.
Review the publish summary:
- Agent name and description
- Connected tools (Process Mining MCP - 9 tools)
- Enabled channels
To confirm, select Publish.
Note
Publishing makes your agent available on all configured channels. You can continue to edit and republish the agent at any time. Each publish creates a new version.
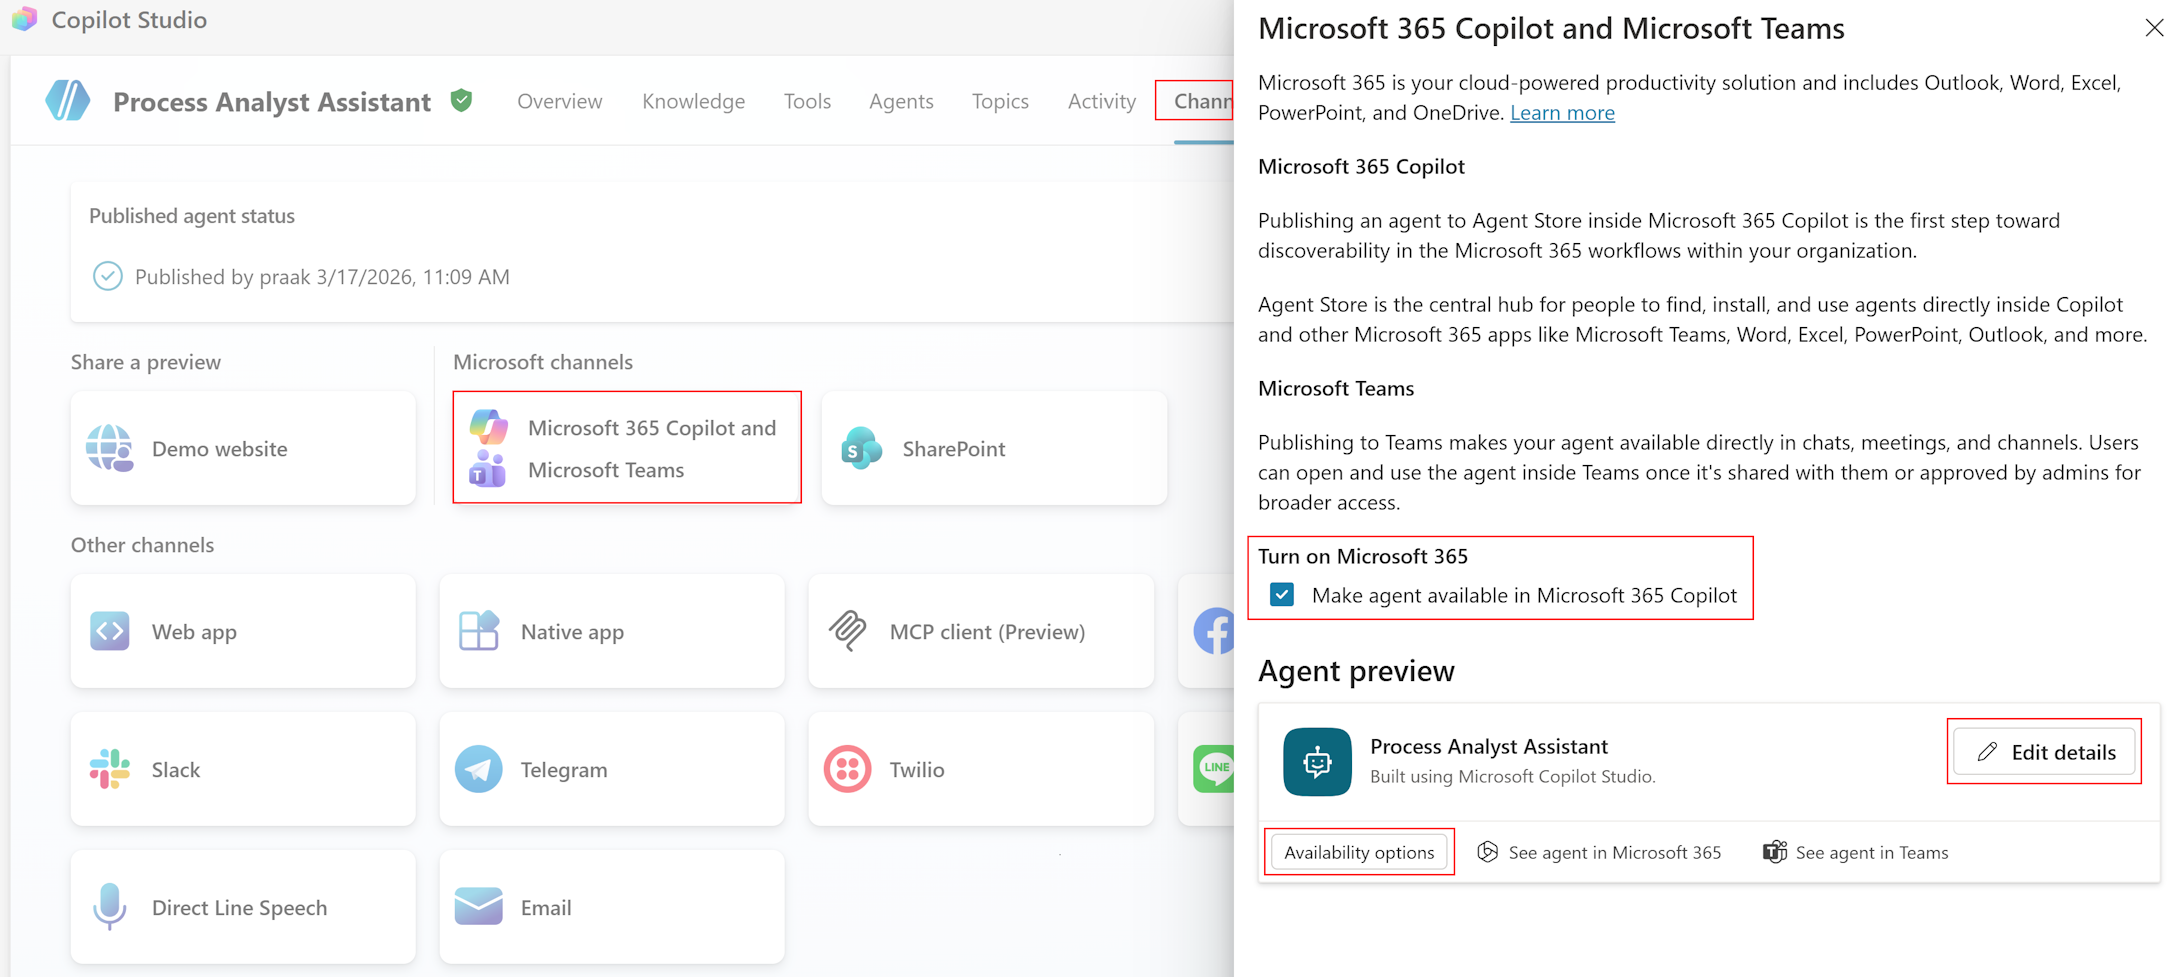
Step 8b: Deploy to Microsoft Teams and Microsoft 365 Copilot
Navigate to the Channels tab.
Select the Channels tab from the top navigation.
Enable Microsoft Teams.
Select Microsoft Teams from the available channels.
Configure availability:
- Personal app: Users can chat with the agent directly in Teams.
- Team or group chat: Agent can be added to team conversations.
Set permissions.
Everyone in my organization (recommended for internal use).
Or
Only specific people or groups (for pilot testing).
Enable Microsoft 365 Copilot.
Under Turn on Microsoft 365, select Make agent available in Microsoft 365 Copilot.
Select Add channel.
Edit details to customize:
- Agent icon (follow Teams app icon format guidelines)
- Accent color
- Short and long descriptions (visible in the Teams app store and About tab)
Share with users.
After configuring channels, share the agent link with your target users.
- For Teams: Users can find the agent in the Teams app store or through a direct link.
- For Microsoft 365 Copilot: The agent appears as an available extension in Copilot.
Step 9: Monitor analytics
After deployment, monitor your agent's performance to identify improvement opportunities.
From the top navigation, select the Analytics tab.
Review key metrics.
Metric What to look for Action if needed Session count Steady or growing usage over time Low usage: Promote agent, improve discoverability, add starter prompts Average session length 3-5 interactions optimal for process mining Too short (<2): Users not finding value. Too long (>8): Simplify responses Resolution rate >80% ideal for successful conversations <80%: Review unresolved conversations, improve instructions Tool invocation frequency Balanced usage across MCP tools Unused tools: Review tool descriptions. Overused: Add specialized topics Error rate <5% acceptable for failed tool calls >5%: Review error logs, fix filter syntax issues, check MCP connection Analyze themes (preview).
- In the Analytics tab, review the Themes section.
- Themes group user questions by topic, showing:
- Total questions per theme
- Answered percentage
- Response quality score
- User reactions (thumbs up/down)
- Use themes to identify:
- Common questions not handled well
- New process mining scenarios to add to instructions
- Opportunities for creating evaluation test sets from production data
Create test sets from themes.
When you identify a theme with low response quality, select Evaluate next to the theme.
This creates a test set from real user questions.
Run the evaluation to measure improvement after instruction updates
Perform continuous improvement cycle:
- Review analytics weekly during initial deployment
- Update agent instructions based on common failure patterns
- Re-run evaluation test sets after instruction changes to measure improvement
- Adjust model selection if accuracy drops or costs are too high
Example scenarios
These scenarios demonstrate common use cases for the Process Analyst Assistant.
Scenario 1: Business user queries bottlenecks
Persona: Business analyst investigating process delays.
User query: "What activities are causing delays in our Order-to-Cash process?"
Agent workflow:
- Recognizes "Order-to-Cash" process reference
- Selects
get_bottleneck_analysisas the appropriate tool - Calls with processId for Order-to-Cash
- Receives activities sorted by duration
- Formats top 5 bottleneck activities with insights
Expected output:
I've analyzed the Order-to-Cash process for bottlenecks. Here are the top 5 activities causing delays:

1. **Approve Order** - Average duration: 3.2 days
   This is the biggest bottleneck, likely due to approval routing complexity or availability of approvers.

1. **Credit Check** - Average duration: 2.8 days
   Credit verification appears to be slower than optimal, possibly due to external system dependencies.

1. **Prepare Shipment** - Average duration: 2.1 days
   Warehouse preparation shows significant wait time, indicating potential capacity constraints.

1. **Generate Invoice** - Average duration: 1.6 days
   Invoice creation has moderate delays, possibly due to manual processing.

1. **Confirm Payment** - Average duration: 1.2 days
   Payment confirmation shows some bottleneck characteristics.

**Key insight**: The approval and credit check steps account for 6 days of the average process duration.

**Follow-up suggestions**:
- Analyze which departments are most affected by these bottlenecks
- Investigate specific cases with longest delays in approval
- Review approval workflow automation opportunities
Scenario 2: Process analyst with filtering
Persona: Process improvement specialist focusing on specific segment
User query: "Show me bottlenecks in the Sales department for cases that took longer than 5 days"
Agent workflow:
- Parses two filter requirements:
- Department filter: AttributeValueFilter (Department = Sales)
- Duration filter: MetricConditionFilter (CaseDuration > 5 days)
- Constructs filter JSON:
{ "attributeValueFilters": [ { "attributeName": "Department", "attributeValues": ["Sales"], "isInclusive": true } ], "metricConditionFilters": [ { "metric": "CaseDuration", "comparisonOperator": "GreaterThan", "dataType": "Time", "value": "5.00:00:00", "isInclusive": true } ] } - Calls
get_bottleneck_analysiswith filters - Presents filtered results with context
Expected output:
I've identified bottlenecks in the Sales department for cases exceeding 5 days:

**Filtered dataset**: 127 cases (out of 1,245 total) match your criteria.

**Top bottlenecks in Sales department (5+ day cases):**
1. **Approve Order** - Average: 4.1 days (vs 3.2 days overall)
   Sales cases show 28% longer approval times than the overall average.

1. **Credit Check** - Average: 3.5 days (vs 2.8 days overall)
   Credit checks in Sales take 25% longer, possibly due to higher-value orders.

1. **Generate Invoice** - Average: 2.2 days (vs 1.6 days overall)
   Invoice generation shows 38% longer duration in Sales-specific long-running cases.

**Key insight**: Sales department shows significantly longer bottleneck durations compared to the overall process, particularly in approval and credit check steps.

**Recommendations**:
- Review Sales-specific approval workflows for optimization opportunities
- Investigate if Sales orders require additional approval layers
- Consider dedicated credit check resources for Sales high-value orders
Scenario 3: Root cause investigation
Persona: Operations manager investigating attribute influence
User query: "Does the customer attribute influence case duration?"
Agent workflow:
- May call
get_process_detailsto confirm "Customer" is case-level - Calls
get_correlationwith attributeName="Customer", influenceFormula="DurationInfluence", sortOrder="Descending" - Interprets influence values
- Provides business interpretation and recommendations
Expected output:
I've analyzed how the Customer attribute influences case duration in the Order-to-Cash process.

**Top customers affecting duration:**

1. **GlobalCorp Inc** - Influence: 0.85 (high)
   - Average case duration: 8.2 days
   - 94% longer than process average

1. **EnterprisePartners LLC** - Influence: 0.72 (high)
   - Average case duration: 7.1 days
   - 69% longer than process average

1. **MegaRetail Co** - Influence: 0.68 (high)
   - Average case duration: 6.8 days
   - 62% longer than process average

1. **StandardBusiness Inc** - Influence: 0.15 (low)
   - Average case duration: 2.3 days
   - 45% faster than process average

**Key insight**: Enterprise customers (GlobalCorp, EnterprisePartners, MegaRetail) show significantly longer processing times, suggesting they require special handling or additional approval steps.

**Recommendations**:
1. Create dedicated workflows for high-influence enterprise accounts
1. Consider pre-approval processes for frequent large orders
1. Set appropriate SLA expectations for enterprise vs standard customers
Scenario 4: Variant analysis
Persona: Process mining specialist analyzing conformance
User query: "What are the most common process variants and how do they perform?"
Agent workflow:
- Calls
get_variants_with_metricswith processId, metricToSortBy="CaseCount", sortOrder="Descending" - Compares duration metrics across variants
- Classifies variants (happy path, rework, expedited)
- Generates insights with recommendations
Expected output:
I've analyzed process variants in the Order-to-Cash process:

**Variant 1 (45% of cases - 562 cases)**
- Path: Create Order → Approve Order → Credit Check → Prepare Shipment → Ship Goods → Generate Invoice → Confirm Payment
- Average duration: 4.2 days
- Classification: Standard "happy path"

**Variant 2 (22% of cases - 275 cases)**
- Path: Create Order → Approve Order → Reject Order → Modify Order → Approve Order → Credit Check → ...
- Average duration: 7.8 days (86% longer than happy path)
- Classification: Rework variant with approval rejection loop

**Variant 3 (15% of cases - 187 cases)**
- Path: Create Order → Rush Approval → Prepare Shipment → Ship Goods → Credit Check → ...
- Average duration: 2.1 days (50% faster than happy path)
- Classification: Expedited process with parallel credit check

**Summary**:
- 55% of cases deviate from the happy path
- Rework and exception variants add 3-7 days on average

**Recommendations**:
1. Reduce order rejection rate (Variant 2 affects 22% of cases, adds 3.6 days)
1. Streamline credit checks for repeat customers
1. Evaluate expanding the rush process (Variant 3) to more eligible cases
(Optional) Enhance the agent
These optional enhancements can improve the agent experience for advanced scenarios.
Add a knowledge source
Optionally add Process Mining documentation as a knowledge source to help the agent understand process mining terminology.
Navigate to the Knowledge tab.
- From the top navigation, select the Knowledge tab.
- Select + Add knowledge.
Add public website.
- Select Public websites.
- Enter URL:
https://learn.microsoft.com/power-automate/process-mining-overview - Name:
Process Mining Documentation - Description:
Official Process Mining documentation for concept reference - Select Add.
Note
This knowledge source is optional. The MCP tools and system prompt provide the primary analytical capabilities. The knowledge source adds terminology context for edge cases.
Create custom topics
For frequently asked questions that benefit from a guided flow, create custom topics.
Bottleneck analysis topic
Navigate to the Topics tab.
- From the top navigation, select the Topics tab.
- Select + Add topic > From description.
Configure the topic.
- Name:
Bottleneck Analysis - Description:
User asks about bottlenecks, delays, or slowest activities in a process - Trigger phrases (for classic orchestration) or Description (for generative orchestration):
- "What are the bottlenecks?"
- "Show me delays"
- "Which activities are slowest?"
- Name:
Add topic logic.
- Add a Question node: "Which process would you like to analyze?"
- Add an Action node: Call
get_bottleneck_analysiswith processId - Add a Message node: Format and present results
Configure conversation memory
Enable context retention for multi-turn analysis sessions.
Use global variables.
Create variables to store current process context:
Global_CurrentProcessId: Currently analyzed processGlobal_CurrentProcessName: Process name for displayGlobal_CurrentFilters: Active filters as JSON
Reference in follow-up queries.
- "Show me bottlenecks": Sets process context.
- "Now filter by Sales department": Uses stored processId, adds filter.
- "What about correlation?": Uses stored processId and filters.
Create a reset topic.
- Trigger: "Start over", "New analysis", "Reset"
- Action: Clear all global variables
- Message: "I've cleared the current analysis context. What would you like to analyze?"
Troubleshooting
Connection issues
| Issue | Symptoms | Resolution |
|---|---|---|
| Connection failed | "Unable to connect to server" error | Verify the Process Mining connector connection is active in Power Automate > Data > Connections. If the connection shows an error, select Fix connection or recreate it. |
| No tools discovered | Tool count shows 0 after adding connector | Verify Process Mining has at least one ingested process. Check that the connector connection is in the same environment as your Copilot Studio agent. |
| Authentication errors | 401 Unauthorized or 403 Forbidden | Verify your user account has Process Mining Contributor or Viewer access. If the connection is expired, recreate it in Power Automate > Data > Connections. |
| Tool calls timeout | Requests hang or timeout | Check if processes are loaded in Process Mining, verify network connectivity, set appropriate client timeout values (recommend 60+ seconds). |
| Empty responses | Tools return empty results | Ensure at least one process is ingested, check process has data, verify filters aren't too restrictive, confirm date ranges are valid. |
Agent behavior issues
| Issue | Symptoms | Resolution |
|---|---|---|
| Wrong tool selected | Agent calls incorrect MCP tool | Refine Instructions—add more specific TOOL USAGE GUIDELINES with examples |
| Filter construction fails | Invalid filter errors | Add filter JSON examples to Instructions, verify attribute names match process schema (case-sensitive) |
| Correlation errors | "Non case-level attribute" error | Verify attribute is case-level using get_process_details before correlation |
| Slow responses | Timeout or long wait times | Reduce itemsPerPage, apply filters to reduce data volume, check MCP server health |
Tool invocation errors
InvalidParams errors:
| Symptom | Cause | Resolution |
|---|---|---|
"processId (Guid) must be id of the process" |
Empty or invalid processId | Use get_processes to obtain valid process IDs. Verify processId is a valid GUID format. |
"Attribute name must be provided" |
Missing attributeName parameter | Use get_process_details to discover valid attribute names. Verify parameter is included in request. |
"Attribute values must contain at least one value" |
Empty attributeValues array in filter | Add at least one value to the attributeValues array. |
"CustomMetricId is required when metric is CustomMetric" |
Missing customMetricId | Provide the GUID of the custom metric when using CustomMetric filter type. |
InvalidRequest errors:
| Symptom | Cause | Resolution |
|---|---|---|
"Correlation cannot be calculated for non case-level attributes" |
Attempting correlation on event-level attribute (for example, Activity) | Call get_process_details to identify case-level attributes. Use only case-level attributes for correlation. |
"Invalid filter syntax" or "Attribute not found" |
Filter references nonexistent attribute or has syntax errors | Verify attribute names match process schema exactly (case-sensitive). Check filter JSON structure. |
"StartDate must be before EndDate" |
TimeframeFilter has invalid date range | Verify startDate is before endDate in ISO 8601 format. |
InternalError:
| Symptom | Cause | Resolution |
|---|---|---|
"Operation failed" or "Invalid response type received" |
Server-side processing issue | Retry the operation (might be transient). Check Process Mining service health. Contact support with correlation ID if issue persists. |
Enable diagnostic logging
- In the Test chat panel, select the Activity map to view tool invocations.
- For connection-level tracing, go to Settings > Diagnostics and enable Connection tracing.
- Set log level to Verbose for detailed request/response payloads.
- Review logs in Monitor > Connection logs, filtering by correlation ID and connection name.
- Save correlation IDs when errors occur—these are essential for support investigations.
Common HTTP status codes in logs:
| HTTP status | Meaning | Action |
|---|---|---|
| 401 Unauthorized | Authentication failed | Check AAD token, verify credentials |
| 403 Forbidden | Permission denied | Verify managed identity has Process Mining permissions |
| 404 Not Found | Invalid endpoint or process ID | Check endpoint URL, verify processId exists |
| 500 Internal Server Error | Server-side error | Retry; check Process Mining health; contact support |
| 504 Gateway Timeout | Long-running operation not completing | Reduce query complexity; apply filters; increase timeout |
Related information
- Process Mining MCP Server Reference: Complete tool and filter reference
- Process Mining connector reference: Connector details and throttling limits
- Add tools to custom agents: General connector tool guidance for Copilot Studio
- MCP server connectors: Full list of available MCP connectors
- Copilot Studio documentation: General Copilot Studio guidance
- Orchestrate agent behavior with generative AI: How generative orchestration works
- Automate testing with agent evaluation: Test set creation and evaluation methods
- Process Mining overview: Understand process mining concepts
- Add and manage connections in Power Automate: Connection setup and management