Time Travel Debugging in WinDbg Preview!
Time Travel Debugging is now available in WinDbg Preview
We are excited to announce that Time Travel Debugging (TTD) features are now available in the latest version of WinDbg Preview. About a month ago, we released WinDbg Preview which provides great new debugging user experiences. We are now publicly launching a preview version of TTD for the first time and are looking forward to your feedback.
What is TTD?
Wouldn't it be great to go back in time and fix a problem? We can't help you go back in time to fix poor life choices; but we can help you go back in time to fix code problems.
Time Travel Debugging (TTD) is a reverse debugging solution that allows you to record the execution of an app or process, replay it both forwards and backwards, and use queries to search through the entire trace. Today's debuggers typically allow you to start at specific point in time and only go forward. TTD improves debugging since you can go back in time to better understand the conditions that lead up to the bug. You can also replay it multiple times to learn how best to fix the problem.
TTD is as easy as 1 - 2 - 3.
- Record: Record the app or process on the machine which can reproduce the bug. This creates a Trace file (.RUN extension) which has all of the information to reproduce the bug.
- Replay: Open the Trace file in WinDbg Preview and replay the code execution both forward and backward as many times as necessary to understand the problem.
- Analyze: Run queries & commands to identify common code issues and have full access to memory and locals to understand what is going on.
Getting Started
I know you are all excited and ready to start using TTD. Here are a few things you should know to get started.
- Install: You can use TTD by installing the WinDbg Preview (build 10.0.16365.1002 or greater) from the Store if you have Windows 10 Anniversary Update or newer at https://aka.ms/WinDbgPreview.
- Feedback: This is a preview release of TTD, so we are counting on your feedback as we continue to finish the product. We are using the Feedback Hub to help us prioritize what improvements to make. You can easily provide feedback directly in WinDbg Preview by clicking the Feedback Hub button on the Home ribbon; otherwise open the Feedback Hub from Start and select Category = Developer Platform and Subcategory = Debugging Tools for Windows (WinDbg, KD, CDB, NTSD). The Windows Insider website has a great overview on how to give good feedback https://insider.windows.com/en-us/how-to-feedback. You can also email us at WinDbgFb.
- Questions: We expect you will have some questions as you work with TTD. So feel free to post them on this blog or send them in the Feedback Hub and we will do our best to answer. We'll be posting an TTD FAQ on our blog shortly.
- Documentation: We've got some initial documentation at /en-us/windows-hardware/drivers/debugger/time-travel-debugging-overview and will be improving our content based upon customer feedback and usage. You can give us feedback or propose edits on the docs.microsoft.com documentation by hitting "Comments" or "Edit" on any page.
- Blogs: Watch for more in-depth TTD updates and tips in the future on our team's blog https://blogs.msdn.microsoft.com/windbg.
- Videos: We went to the Channel 9 studio and recorded a couple of episodes of Defrag Tools to help explain some of the basics of TTD in WinDbg Preview.
- Defrag Tools 185: Ivette and JamesP go over the basics of TTD and demo some features in WinDbg Preview
- Defrag Tools 186: Jordi and JCAB demo more great features of TTD in WinDbg Preview
- YouTube CppCon: Jordi, Ken and JamesM presented TTD in WinDbg Preview at CppCon 2017
- Coming Soon: stay tuned for videos which show the power of queries, using TTD object model and more
How to use TTD
You use TTD directly in the WinDbg Preview app. We have added all of the key TTD features into WinDbg Preview to provide a familiar debugging experience which makes it intuitive to go backwards and forwards in time during your debugging session.
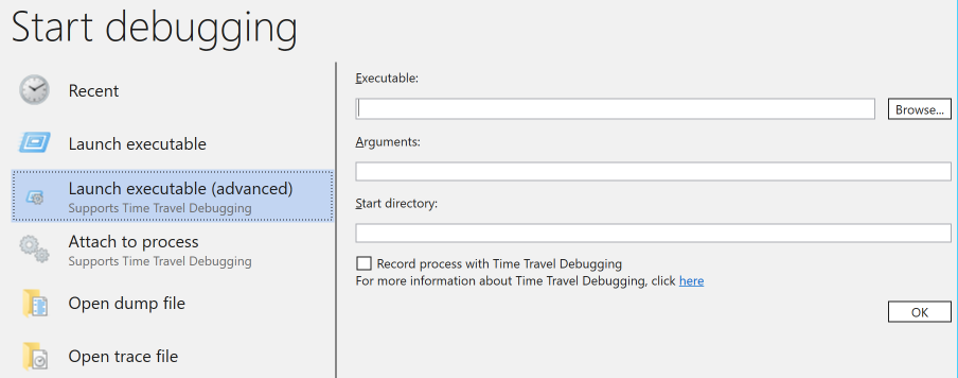
Record a Trace
WinDbg Preview makes it easy to record a trace. Simply click File >> Start Debugging and point to the app or process. You will have an option to Record during attach and launch. See /en-us/windows-hardware/drivers/debugger/time-travel-debugging-overview for more information.
Replay a Trace
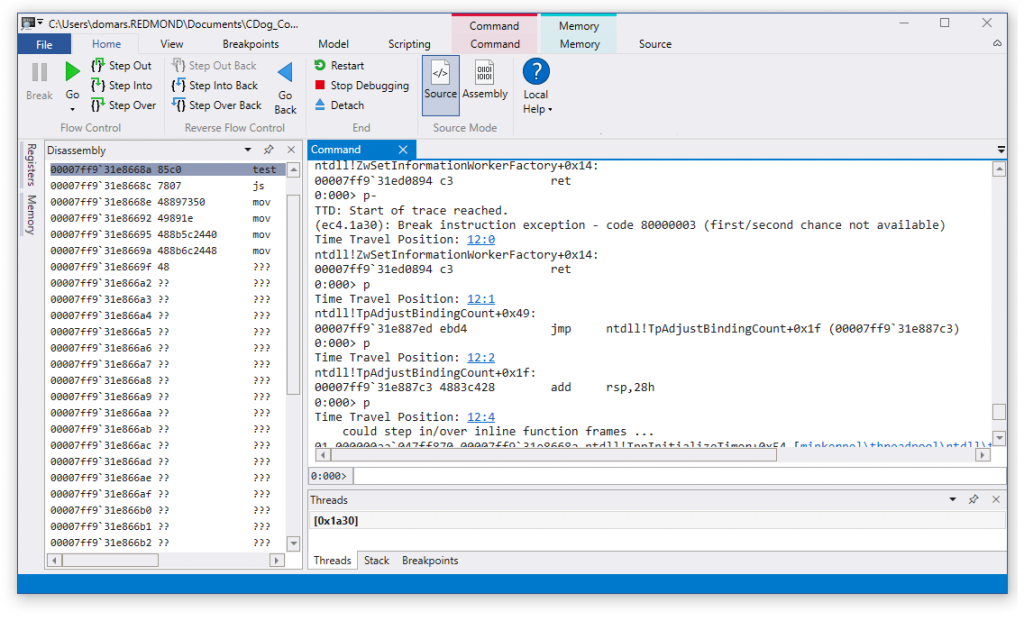
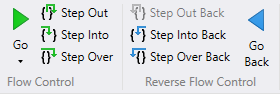
Once the Trace is complete, we automatically load and index the Trace for faster replay and memory lookups. Then simply use the WinDbg ribbon buttons or commands to step forwards and backwards through the code.
Basic TTD Commands
You can use the ribbon or enter the following TTD commands in WinDbg Preview. See /en-us/windows-hardware/drivers/debugger/time-travel-debugging-overview for a complete list of TTD commands.
| Command | Description |
| p | Step forwards (F10) |
| p- | Step backwards |
| g | Go forwards (F5) |
| g- | Go backwards |
| t | Trace forwards (F11) |
| t- | Trace backwards |
| !tt <position> | Travels to the given position in the trace by percentage or using a XX:YY position code |
| !positions | Displays the current position for every thread |
Final Thoughts
We are very excited to get TTD into the hands of our developers; but there are a few things to remember.
- TTD is a preview, so we will be regularly improving performance and features
- This only runs on Windows 10 since WinDbg Preview is a Store app
- See docs.microsoft.com documentation for TTD known issues and compatibility
Welcome to the world of time travel. Our goal is to improve the lives of developers by making debugging easier to increase product quality. Please send us feedback and feature requests in the Feedback Hub to let us know how we are doing!
Comments
- Anonymous
September 25, 2017
This is a fantastic piece of technology to which outside of MS no one had access until now. For C/C++ this works just great with my small sample application. I have to use it on some real problems soon. What I find is still missing is that Windbg has no knowledge about managed code. I understand that sos.dll is meant to solve that but some things like call stacks and source code support are essential to get most out of Windbg. Setting a breakpoint in source code is just so much easier than to glue many sos commands together to simulate a managed stack. With TTT these deficiencies are hurting much more since I cannot switch over to Visual Studio on my developer machine where everything is set up correctly.- Anonymous
September 25, 2017
The comment has been removed - Anonymous
September 26, 2017
RevDeBug is a similar solution for .NET ; have never used it, but it looks quite impressive.https://revdebug.com/ - Anonymous
September 26, 2017
Yes we have received requests for using TTD with managed code. This is something that we are actively looking in to so stay tuned.
- Anonymous
- Anonymous
September 25, 2017
Great, this has been a highly desired feature of mine. Look forward to testing it.- Anonymous
September 26, 2017
Hey Malcolm ... we are looking forward to any feedback you have after testing TTD. See above for best ways to provide us feedback on TTD preview.
- Anonymous
- Anonymous
September 26, 2017
Does it work for CLR too via sos.dll?- Anonymous
September 26, 2017
Yep, nearly everything that works during a live session works with TTD sessions, SOS works fine. You might hit a problem when replaying a trace of 32-bit managed code though. We're looking into that.- Anonymous
October 01, 2017
Yes. Unfortunately for 32 bit, I cannot load sos.dll
- Anonymous
- Anonymous
- Anonymous
September 26, 2017
"The trace file can get big and the user of TTD needs to make sure that there is adequate free space available. If you record a program for even a few minutes, the trace files can quickly grow to be several gigabytes."I heard that UndoDB have smaller log files (compared to the builtin GDB support)."Other utilities that attempt to block memory access, can also be problematic, for example, the Microsoft Enhanced Mitigation Experience Toolkit. For more information about EMET, see The Enhanced Mitigation Experience Toolkit."You mind telling me WHICH mitigations are problematic?- Anonymous
September 27, 2017
In general, anything that would prevent live debugging would also impact TTD recording. This list cannot be an exhaustive since we don't know every available product. The following are known to be problematic:Anti Debugging techniques: anything that an app or process does to prevent debugging○ Examples include hardware breakpoints, timer checks (ensure no gaps), security features to prevent alterations, external control processesAntivirus (AV) and similar real-time monitors ○ Some AVs may work better than others and TTD recording will often succeed even with a real-time monitor embedded in the process○ Workaround is to disable AV and real-time monitors prior to TTD recording Code Shimming○ If the app or process shims the small set of APIs that TTD relies on○ If necessary, contact WindbgFb@microsoft.com to discuss a workaround- Anonymous
September 27, 2017
Thanks for the reply, but it's not really an answer.You ignored the question about EMET. I don't know all the things it does (I never used the Application Configuration, for example), but it seems to me that most things are global settings like and ASLR that shouldn't pose a problem (and if something like ASLR or the fonts mitigation conflicts with TTD - that is a problem) and even the application-specific ones seem like IFEO settings. No shims. So what's the problem?You say there's a problem "if the app or process shims the small set of APIs that TTD relies on", but:(1) Why does it matter? As long as the shim/hook doesn't block the call it should work? Or not? How does TTD work?(2) You never specify what is this set. Chrome hooks NtMapViewOfSection on itself. Will TTD work with Chrome or not? Whatever the answer is, it'd be nice to know in advance what are the limitations ("small set of APIs that TTD relies on") that have something not work and then debug the debugger to find what's the problem. I debugged the debugger a couple times. It's not something that I like to do without a good reason.And regarding protected process. If I "elevate" the debugger to be "protected" by setting the right bits in the EPROCESS using kd, will it work? I guess not because you not only need the power the do regular live debugging, but also inject a DLL (which probably isn't signed with the appropriate EKU). Is there a way to solve this?
- Anonymous
- Anonymous
- Anonymous
September 26, 2017
Very cool. As a heavy WinDbg user, I suspect I'll run into cases now and then where it will be usable and will make me very happy.- Anonymous
September 27, 2017
Thanks for taking the time to post a comment. We are excited to bring TTD features to you and please use Feedback Hub if you find something we could better to make debugging easier.
- Anonymous
- Anonymous
September 26, 2017
Microsoft still produces one of the most advanced/user-friendly Visual Studio IDE.Rather than going towards WinDbg, Store Apps, etc,do the right thing and put the feature in the new VS2017.You guys have a really good control of the stack of the crash, etc you just need to allow the developer to go back in time if they want, interactively.- Anonymous
September 27, 2017
We know that devs choose different tools depending on need and preference. We are looking at including Time Travel Debugging features in a future version of Visual Studio. Please email TTDVS@microsoft.com if you would like to see Time Travel Debugging in Visual Studio. The voice of our customers does impact feature prioritization ... we are listening so make your voice heard.
- Anonymous
- Anonymous
September 26, 2017
Does TTD work both locally and remotely? Does it require a kernel mode connection or can it work in user mode? Thank you.- Anonymous
September 27, 2017
TTD is user-mode only for now, and does not work over remotes.
- Anonymous
- Anonymous
September 27, 2017
That's awesome, but when do we see xcopy deploy so it can be utilized by all?- Anonymous
September 27, 2017
For now, the only supported way to record using TTD is via WinDbg Preview in the Store. We are looking at other deployment methods so we recommend you submit a request via the Feedback Hub to provide additional visibility for Xcopy ability.
- Anonymous
- Anonymous
September 27, 2017
Great. Very useful :-) - Anonymous
September 27, 2017
Does TTD work wow64 application? I use TTD to launch C:\Windows\SysWOW64\notepad.exe to record. After click "stop and debug" , I can not find wow64.dll in the loaded module list (!lmu) and it shows following message when I try to set break point on wow64!wow64SystemServiceEx. 0:000> bp wow64!wow64SystemServiceEx Bp expression 'wow64!wow64SystemServiceEx' could not be resolved, adding deferred bp- Anonymous
September 28, 2017
TTD recording of 32 bit process through the Wow64 compatibility layer and setting a breakpoint in the Wow64 subsystem is not a supported scenario. Wow64 does not show up in the 32 bit debugger since it is marked as a 64 bit module. You can use TTD to record the 32 bit process without Wow64 and debug it in WinDbg. What is the problem you are trying to solve?
- Anonymous
- Anonymous
October 02, 2017
You say that installation of WinDbg Preview requires Window 10 Anniversary edition. Will you be providing a way to record an app running on an earlier version of Windows; to playback on a computer that does have W10A?- Anonymous
October 03, 2017
We’re planning on including TTD in WinDbg in the SDK/WDK in the future. We’re using the Store for now because it lets us get updates and fixes out much faster than any other option.
- Anonymous
- Anonymous
October 10, 2017
Please consider giving an alternative direct download link (outside of the store) (like previous versions of WinDBG)In many commercial organizations Windows App store is blocked due to all the other items present.- Anonymous
October 10, 2017
Thanks for the feedback. We have heard this request a few times on previous blog posts and are evaluating solutions. Please add this request to the Feedback Hub (Category = Developer Platform and Subcategory = Debugging Tools for Windows (WinDbg, KD, CDB, NTSD)) to help prioritize feature requests appropriately.
- Anonymous
- Anonymous
October 14, 2017
The comment has been removed- Anonymous
October 20, 2017
We are not ready to provide more details on how TTD records yet. For now we will keep the "secret sauce" a secret.
- Anonymous
- Anonymous
October 16, 2017
Great news! Is there any chance getting DWARF supported by WinDbg?- Anonymous
October 20, 2017
Today TTD supports PE binary and PDB symbol files. We are looking at supporting other files like ELF and DWARF in the future. Please use Feedback Hub to let us know that supporting other files are important to you.
- Anonymous
- Anonymous
November 10, 2017
Does TTD support tracing child process now ? if not ,when will this features be added ?- Anonymous
November 17, 2017
We have an internal version of TTD with the ability to record child processes. We are currently testing this feature and will be including it in a future release. So stay tuned.
- Anonymous
- Anonymous
August 03, 2018
Any update on when TTD will be released? You have my vote for adding it to VS too? Will the recording tool be available as a separate installer so we could distribute to our customers when trying to debug issues on their machine? Will the recording tool work on Win7?