Note
Access to this page requires authorization. You can try signing in or changing directories.
Access to this page requires authorization. You can try changing directories.
![]()
What is Time Travel Debugging?
Time Travel Debugging (TTD) is a tool that captures a trace of your process as it executes and replays it later both forwards and backwards. TTD helps you debug issues by letting you "rewind" your debugger session, instead of having to reproduce the issue until you find the bug.
TTD allows you to go back in time to better understand the conditions that lead up to the bug and replay it multiple times to learn how best to fix the problem.
TTD has advantages over crash dump files, which often miss the state and execution path that led to the ultimate failure.
If you can't figure out the issue yourself, you can share the trace with a coworker so they can look at exactly what you're looking at. This feature makes collaboration easier than live debugging, as the recorded instructions are the same, whereas the address locations and code execution differ on different PCs. You can also share a specific point in time to help your coworker figure out where to start.
TTD is efficient and works to add as little overhead as possible as it captures code execution in trace files.
TTD includes a set of debugger data model objects that you can use to query the trace with LINQ. For example, you can use TTD objects to locate when a specific code module was loaded or locate all of the exceptions.
Requirements
Time Travel Debugging is integrated with WinDbg, providing a seamless recording and replay experience.
To use TTD, you need to run the debugger with elevated permissions. Install WinDbg by using an account that has administrator privileges and use that account when recording in the debugger. To run the debugger with elevated permissions, select and hold (or right-click) the WinDbg icon in the Start menu, then select More > Run as Administrator.
Release notes
TTD continues to evolve. For the latest information, see Time travel debugging release notes.
The recording may contain personally identifiable or security related information
The created trace file that contains the recording may contain personally identifiable or security related information, including but not necessarily limited to file paths, registry, memory or file contents. Exact information depends on target process activity while it was recorded. Be aware of this when sharing recording files with other people.
TTD.exe command line recording utility
In addition to recording traces in the WinDbg UI, there is a TTD.exe command line utility available to record a trace.
You may have scenarios where only the TTD command line recorder is required: recording on a PC without installing the debugger, advanced recording scenarios, test automation, etc. In these scenarios you can install just the TTD command line recorder through a URL. For more information, see Time Travel Debugging - TTD.exe command line utility.
Comparison of Debugging Tools
This table summarizes the pros and cons of the different debugging solutions available.
| Approach | Pros | Cons |
|---|---|---|
| Live debugging | Interactive experience, sees flow of execution, can change target state, familiar tool in familiar setting. | Disrupts the user experience, may require effort to reproduce the issue repeatedly, may impact security, not always an option on production systems. With repro difficult to work back from point of failure to determine cause. |
| Dumps | No coding upfront, low-intrusiveness, based on triggers. | Successive snapshot or live dumps provide a simple "over time" view. Overhead is essentially zero if not used. |
| Telemetry & logs | Lightweight, often tied to business scenarios / user actions, machine learning friendly. | Issues arise in unexpected code paths (with no telemetry). Lack of data depth, statically compiled into the code. |
| Time Travel Debugging (TTD) | Great at complex bugs, no coding upfront, offline repeatable debugging, analysis friendly, captures everything. | Large overhead at record time. May collect more data that is needed. Data files can become large. |
Video training
To learn more about TTD, see these videos.
Defrag Tools 185 - Ivette and JamesP go over the basics of TTD and demo some features in WinDbg
Defrag Tools 186 - Jordi and JCAB demo more great features of TTD in WinDbg
CppCon (YouTube) - Jordi, Ken, and JamesM presented TTD in WinDbg at CppCon 2017
Trace file basics
Trace file size
The trace file can get big. You need to make sure that there's enough free space available. If you record a program for even a few minutes, the trace files can quickly grow to be several gigabytes. TTD doesn't set a maximum size for trace files to allow for complex long running scenarios. Quickly re-creating the issue keeps the trace file size as small as possible.
Trace and index files
A trace file (.run) stores the code execution during recording.
When you stop the recording, the system creates an index file (.idx) to optimize access to the trace information. WinDbg also automatically creates index files when it opens trace files.
Index files can be large, typically twice as large as the trace file.
You can recreate the index file from the trace file by using the !tt.index command.
0:000> !tt.index
Successfully created the index in 10ms.
Recording errors and other recording output go to a WinDbg log file.
You store all of the output files in a location you configure. The default location is in the user's document folder. For example, for User1, the TTD files are stored here:
C:\Users\User1\Documents
For more information on working with trace files, see Time Travel Debugging - Working with trace files.
Things to look out for
Anti-virus incompatibilities
You might encounter incompatibilities because of how TTD hooks into processes to record them. Typically, issues arise with anti-virus or other system software that attempts to track and shadow system memory calls. If you run into issues with recording, such as an insufficient permission message, try temporarily disabling any anti-virus software.
Other utilities that attempt to block memory access can also be problematic. For example, the Microsoft Enhanced Mitigation Experience Toolkit.
Another example of an environment that conflicts with TTD is the Electron application framework. In this case, the trace might record, but a deadlock or crash of the process being recorded is also possible.
User mode only
TTD currently supports only user mode operation, so you can't trace a kernel mode process.
Read-only playback
You can travel back in time, but you can't change history. You can use read memory commands, but you can't use commands that modify or write to memory.
System protected processes
Some Windows system protected processes, such as Protected Process Light (PPL) process, are protected. TTD can't inject itself into the protected process to allow for the recording of the code execution.
Performance impact of recording
Recording an application or process impacts the performance of the PC. The actual performance overhead varies based on the amount and type of code being executed during recording. You can expect about a 10x-20x performance hit in typical recording scenarios. Sometimes there isn't a noticeable slowdown in the UI. But for the more resource intensive operations, such as the File Open dialog, you see the impact of recording.
Trace file errors
Trace file errors can occur. For more information, see Time Travel Debugging - Troubleshooting.
Advanced features of Time Travel Debugging
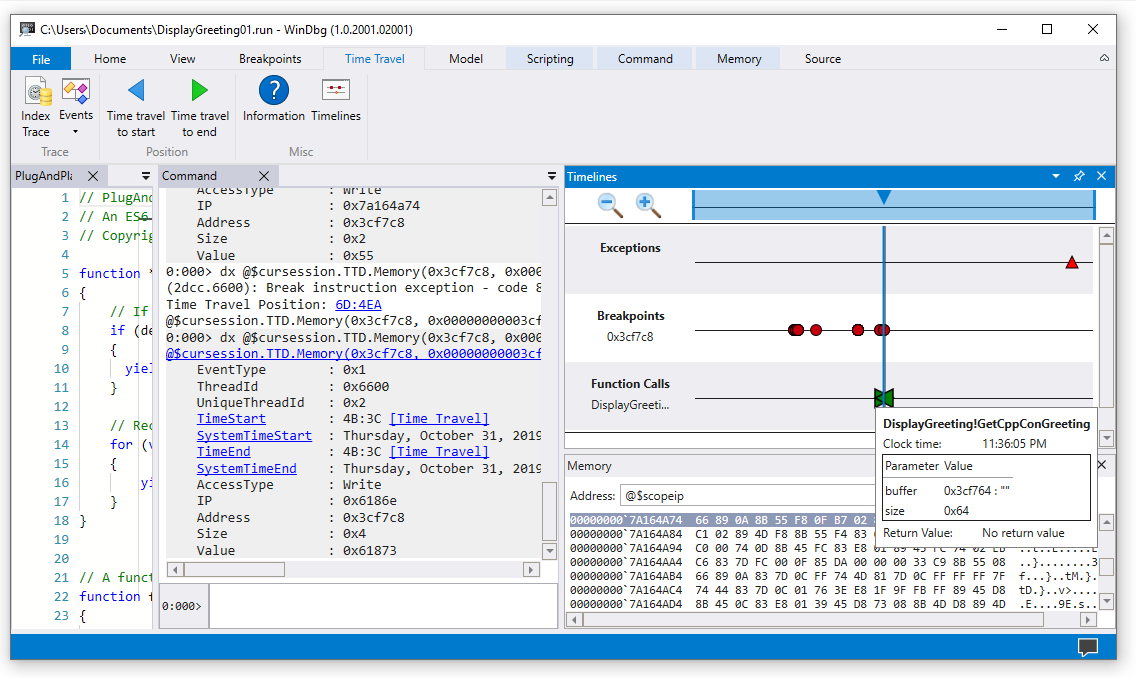
Timelines
Timelines are a visual representation of events that happen during the execution. These events can be locations of: breakpoints, memory read/writes, function calls and returns, and exceptions. For more information about timelines, see WinDbg - Timelines.
Debugger data model support
- Built in data model support - TTD includes data model support. Using LINQ queries to analyze application failures can be a powerful tool. You can use the data model window in WinDbg to work with an expandable and browsable version of
dxanddx -g, letting you create tables using NatVis, JavaScript, and LINQ queries.
For general information about the debugger data model, see WinDbg - Data model. For information about working with the TTD debugger object model, see Time Travel Debugging - Introduction to Time Travel Debugging objects.
Scripting support
- Scripting Automation - Scripting support for JavaScript and NatVis allows for the automation of problem investigation. For more information, see Time Travel Debugging - JavaScript Automation.
For general information about working with JavaScript and NatVis, see WinDbg - Scripting.
TTD.exe Command line utility
The TTD.exe command line utility to record traces is available. For more information, see Time Travel Debugging - TTD.exe command line utility.
Managed code TTD support
You can use the SOS debugging extension (sos.dll) running in 64-bit mode to debug managed code using TTD in WinDbg. For more information, see Debugging Managed Code Using the Windows Debugger.
Getting started with TTD
Start here
If you're new to TTD, follow this learning path:
- Record a trace - Capture your first execution trace
- Replay a trace - Navigate and analyze your recording
- Sample App Walkthrough - Step-by-step debugging example
Need help?
- Working with trace files - Manage and optimize trace files
- Troubleshooting - Resolve common issues
Advanced features
- TTD debugger objects - Query traces with LINQ
- JavaScript Automation - Automate problem investigation