Note
Access to this page requires authorization. You can try signing in or changing directories.
Access to this page requires authorization. You can try changing directories.
Applies to:  Database connectors
Important
This feature is in Public Preview.
This feature is rolling out gradually. If you don't see the Data freshness column in your pipeline, the feature isn't available in your workspace.
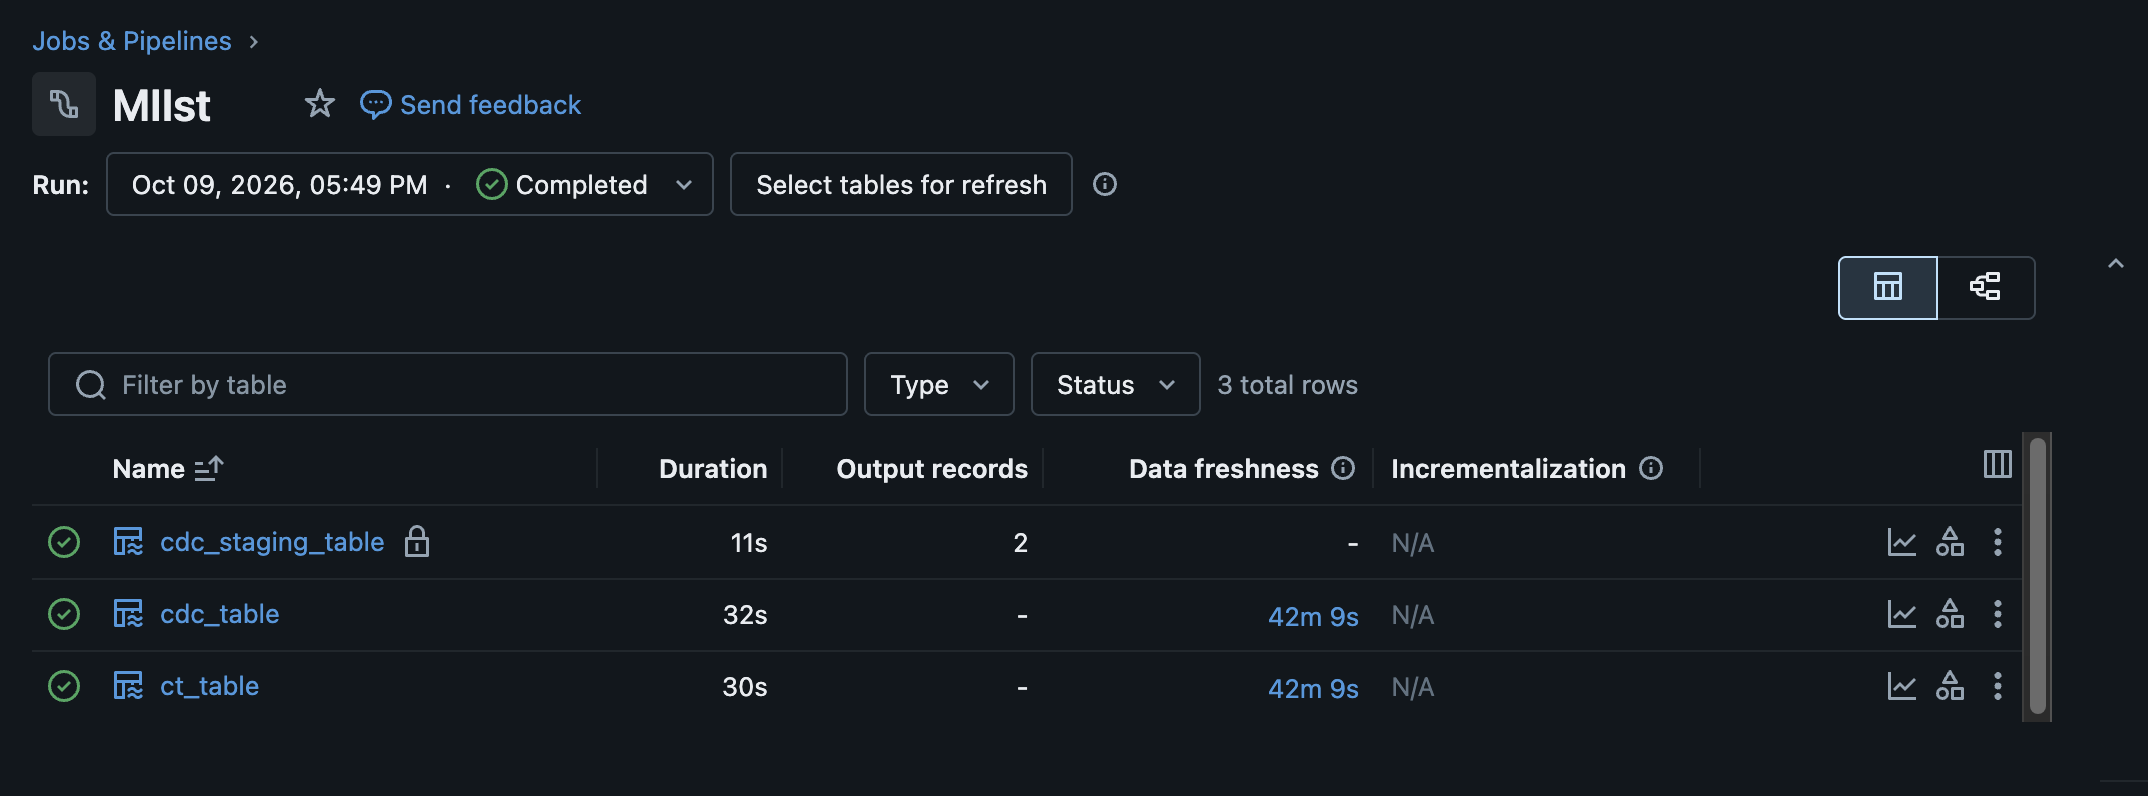
Data freshness shows how current the data in each destination table is compared to the source database. For each table in a database connector pipeline, the pipeline UI shows how much time has passed since the most recent source change that the pipeline ingested.
Data freshness is available for SQL Server, PostgreSQL, MySQL, and Oracle sources.
Use data freshness to:
- See how far behind the source each destination table is, without querying the event log.
- Identify tables that are falling behind the rest of the pipeline.
- Distinguish tables that are actively receiving changes from tables that are idle on the source.
How data freshness is calculated
Data freshness is calculated for each table from the following values:
| Value | Definition |
|---|---|
| Source commit time | The time when a transaction was committed on the source database. |
| Latest source commit time | The most recent source commit time among the changes that the pipeline has ingested for the table. |
| Data freshness | The current time minus the latest source commit time. |
For example, if the latest change ingested for a table was committed on the source 3 minutes ago, the table's data freshness is 3m. A lower value means the destination table is closer to the current state of the source.
Data freshness measures how current the destination table is. It differs from the CDC latency metrics in the gateway's event log, such as discovery_latency_ms, which measure only the path from the source database to the staging volume. See CDC latency.
View data freshness
- In your Azure Databricks workspace, click Jobs & Pipelines in the sidebar.
- Click the name of your ingestion pipeline.
- In the tables list, find the Data freshness column.
The column shows a value for each table, in hours, minutes, and seconds (for example, 3m 23s or 45h 32m 4s).
How data freshness behaves
- Running updates: Data freshness updates continuously. The value increases as time passes and decreases when the pipeline ingests newer changes from the source.
- Stopped or completed updates: Data freshness stops updating when the update ends. The column keeps showing the value from when the update ended, so you can still see the freshness of each table after the pipeline stops.
- Idle tables: Data freshness reflects the last change that the pipeline received from the source. If a source table has no new commits, its data freshness keeps increasing, even when the pipeline is healthy and fully caught up.
Interpret data freshness
Because idle source tables also show increasing data freshness, compare the value with the activity on the source before you treat it as a delay.
| Pattern | What it means |
|---|---|
| Low and steady on all tables | The pipeline is caught up with the source. |
| Increasing on one or more tables | The source tables might be idle, with no new commits. If the source tables are receiving changes, the pipeline is delayed. See Find where a delay comes from. |
Empty (-) |
The pipeline hasn't ingested any changes for the table since it started, for example while the initial snapshot is running. See Limitations. |
Find where a delay comes from
For pipelines that use an ingestion gateway, compare the latest source change that the gateway has read with the latest source commit time that the ingestion pipeline has ingested. The gateway reports event_time:max in its event log. The ingestion pipeline reports upstream_time:max in its event log. See Query data freshness from the event log.
Gateway event_time:max |
Ingestion pipeline upstream_time:max |
What it means |
|---|---|---|
| Advancing | Advancing | Changes are flowing through the pipeline. |
| Advancing | Not advancing | The ingestion pipeline is behind the gateway. Check the ingestion pipeline's status and its schedule. |
| Not advancing | Not advancing | The source is idle, or the gateway has lost its connection to the source. To diagnose the gateway, see CDC latency. |
Query data freshness from the event log
The ingestion pipeline's event log, not the gateway's event log, records the metrics that data freshness is based on. Query the event log to track data freshness over time, compare tables, or create alerts.
Each flow_progress event for a CDC flow reports the following fields under details:flow_progress:streaming_metrics:
| Field | Type | Description |
|---|---|---|
upstream_time:max |
String | The latest source commit time among the changes in the batch, as an ISO 8601 timestamp in UTC. |
upstream_time:min |
String | The earliest source commit time among the changes in the batch, as an ISO 8601 timestamp in UTC. |
stream_latency_ms |
Integer | The end-to-end lag for the batch, in milliseconds. The lag is measured from the source commit time of the oldest change in the batch to when the batch was committed to the destination table. |
In each query, replace <ingestion-pipeline-id> with the ID of your ingestion pipeline. The gateway's event log doesn't report these fields.
Data freshness and latest lag per table
The following query returns the latest source commit time, data freshness, last batch time, and end-to-end lag of the most recent batch for each table. Results are sorted so the least fresh tables appear first.
The query includes only the tables in the pipeline's latest update. Without this filter, tables that you removed from the pipeline stay in the event log, and their data freshness keeps increasing.
WITH latest_update AS (
  SELECT origin.update_id AS update_id
  FROM event_log('<ingestion-pipeline-id>')
  WHERE event_type = 'create_update'
  ORDER BY timestamp DESC
  LIMIT 1
),
current_flows AS (
  SELECT DISTINCT origin.flow_name AS flow_name
  FROM event_log('<ingestion-pipeline-id>')
  WHERE event_type = 'flow_progress'
    AND origin.flow_name IS NOT NULL
    AND origin.update_id = (SELECT update_id FROM latest_update)
)
SELECT
  origin.flow_name AS flow_name,
  MAX(details:flow_progress:streaming_metrics:upstream_time:max::timestamp) AS latest_source_commit_time,
  TIMESTAMPDIFF(
    MINUTE,
    MAX(details:flow_progress:streaming_metrics:upstream_time:max::timestamp),
    current_timestamp()
  ) AS data_freshness_minutes,
  MAX(timestamp) AS last_batch_time,
  MAX_BY(details:flow_progress:streaming_metrics:stream_latency_ms::bigint, timestamp) AS latest_lag_ms
FROM event_log('<ingestion-pipeline-id>')
WHERE event_type = 'flow_progress'
  AND origin.flow_name IN (SELECT flow_name FROM current_flows)
  AND details:flow_progress:streaming_metrics:upstream_time:max IS NOT NULL
GROUP BY origin.flow_name
ORDER BY data_freshness_minutes DESC
End-to-end lag over time
The following query returns the hourly maximum end-to-end lag for each table over the last 24 hours. Use it to find when lag increased.
SELECT
  DATE_TRUNC('HOUR', timestamp) AS ts_hour,
  origin.flow_name AS flow_name,
  ROUND(MAX(details:flow_progress:streaming_metrics:stream_latency_ms::bigint) / 1000.0 / 60.0, 1) AS max_lag_minutes
FROM event_log('<ingestion-pipeline-id>')
WHERE event_type = 'flow_progress'
  AND origin.flow_name IS NOT NULL
  AND details:flow_progress:streaming_metrics:stream_latency_ms IS NOT NULL
  AND timestamp >= current_timestamp() - INTERVAL 24 HOURS
GROUP BY DATE_TRUNC('HOUR', timestamp), origin.flow_name
ORDER BY origin.flow_name, ts_hour
Create an alert on data freshness
To get notified when a table falls behind, create a Databricks SQL alert on a data freshness query. For example, the following query returns the number of tables in the pipeline's latest update whose data freshness is more than 120 minutes. Replace 120 with your threshold, and configure the alert to trigger when stale_tables is greater than 0.
WITH latest_update AS (
  SELECT origin.update_id AS update_id
  FROM event_log('<ingestion-pipeline-id>')
  WHERE event_type = 'create_update'
  ORDER BY timestamp DESC
  LIMIT 1
),
current_flows AS (
  SELECT DISTINCT origin.flow_name AS flow_name
  FROM event_log('<ingestion-pipeline-id>')
  WHERE event_type = 'flow_progress'
    AND origin.flow_name IS NOT NULL
    AND origin.update_id = (SELECT update_id FROM latest_update)
),
per_table_freshness AS (
  SELECT
    origin.flow_name AS flow_name,
    TIMESTAMPDIFF(
      MINUTE,
      MAX(details:flow_progress:streaming_metrics:upstream_time:max::timestamp),
      current_timestamp()
    ) AS data_freshness_minutes
  FROM event_log('<ingestion-pipeline-id>')
  WHERE event_type = 'flow_progress'
    AND origin.flow_name IN (SELECT flow_name FROM current_flows)
    AND details:flow_progress:streaming_metrics:upstream_time:max IS NOT NULL
  GROUP BY origin.flow_name
)
SELECT
  COUNT_IF(data_freshness_minutes > 120) AS stale_tables
FROM per_table_freshness
Tables that have no data freshness value yet, such as tables whose initial snapshot is running, aren't counted.
The query compares the latest source commit time with the current time, so its value keeps increasing for idle source tables and while the pipeline isn't running. Unlike the value in the UI, it doesn't stop changing when an update ends. To avoid alerts that fire when the data is current:
- Set the threshold based on how often your source tables receive changes.
- For a pipeline that runs on a schedule, set the threshold higher than the interval between scheduled runs.
- If your tables receive changes at very different rates, create a separate alert for each group of tables with similar rates, and filter each query on
flow_name.
See Databricks SQL alerts and Create an alert.
Limitations
- Tables without changes: If a table has received no changes since the pipeline started, data freshness is empty. The UI shows a dash (
-), and the event log has noupstream_timevalue for the table. This includes tables whose initial snapshot is running. - SQL Server sources: When the source commit time isn't available for a change, the gateway uses a cached commit time that it refreshes every 120 seconds. Until the cached value refreshes, data freshness can be higher than the actual delay.
- Oracle sources: For Oracle tables with large object (LOB) columns, such as
BLOB,CLOB, orNCLOB, data freshness can be negative. A negative value means that the recorded source commit time is later than the current time. It doesn't mean that the data is fresher than the source. If you see negative values, contact Azure Databricks support.