Note
Access to this page requires authorization. You can try signing in or changing directories.
Access to this page requires authorization. You can try changing directories.
Automatic tracing instruments 30+ frameworks with a single call. Use manual tracing when you need to instrument code that autolog doesn't cover — custom agent logic, proprietary frameworks, or any execution path you want to observe precisely. The same APIs work whether your agent runs on Databricks or on external infrastructure.
Which method?
| Method | Use when | Auto parent-child | Exception handling |
|---|---|---|---|
@mlflow.trace decorator |
Tracing an entire Python function | Yes | Automatic |
mlflow.start_span() context manager |
Tracing a code block within a function | Yes | Automatic |
Node.js mlflow.trace() wrapper |
Tracing TypeScript or JavaScript functions | Yes | Automatic |
Low-level MlflowClient API |
Custom trace IDs, integration with an external observability system | No — manual | Manual |
Prerequisites
Python
%pip install --upgrade "mlflow[databricks]>=3.1.0"
dbutils.library.restartPython()
Node.js
npm install mlflow-tracing
Requires Node.js 14 or later. For automatic OpenAI tracing, also install:
npm install mlflow-openai
The @mlflow.trace decorator
The @mlflow.trace decorator creates a span for any Python function. It automatically captures the function name, inputs, outputs, and execution time, and manages parent-child relationships and exception recording with no extra code.
import mlflow


@mlflow.trace(span_type="func", attributes={"key": "value"})
def add_1(x):
    return x + 1


@mlflow.trace(span_type="func", attributes={"key1": "value1"})
def minus_1(x):
    return x - 1


@mlflow.trace(name="Trace Test")
def trace_test(x):
    step1 = add_1(x)
    return minus_1(step1)


trace_test(4)
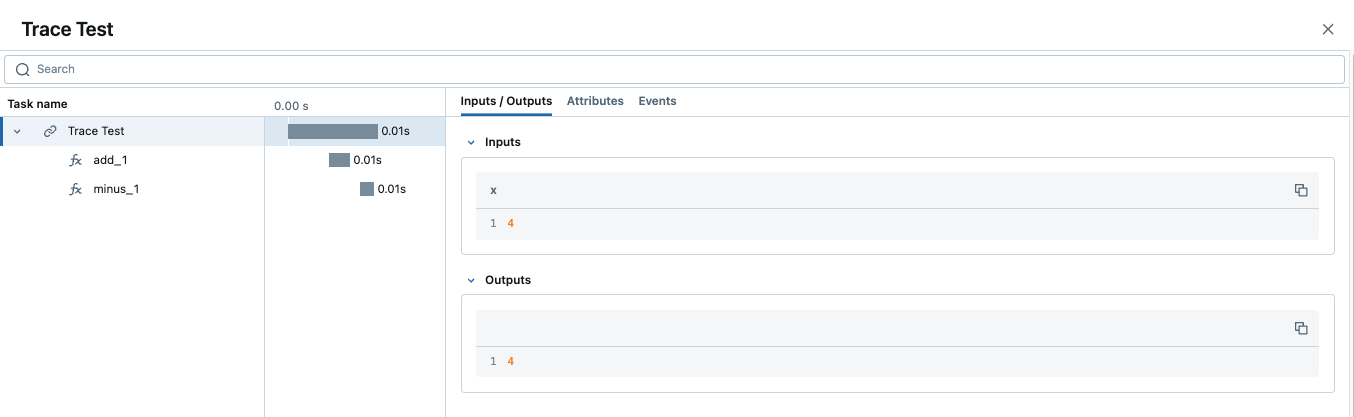
Note
When a trace contains multiple spans with the same name, MLflow appends an auto-incrementing suffix — _1, _2, and so on.
Customize spans
The decorator accepts three optional arguments:
name— overrides the default span name (the function name)span_type— sets the span type; use a built-in Span Type or a custom stringattributes— adds key-value metadata to the span
To update attributes dynamically from inside the function, call mlflow.get_current_active_span():
from mlflow.entities import SpanType

@mlflow.trace(span_type=SpanType.LLM)
def invoke(prompt: str):
    model_id = "gpt-4o-mini"
    span = mlflow.get_current_active_span()
    span.set_attributes({"model": model_id})
    return client.invoke(messages=[{"role": "user", "content": prompt}], model=model_id)
Use with other decorators
Place @mlflow.trace as the outermost decorator. If it isn't first, it may miss modifications made by inner decorators and produce incomplete traces.
# Correct: @mlflow.trace is outermost
@mlflow.trace(name="my_function")
@other_decorator
def my_function(x, y):
    return x + y
Add trace tags and UI previews
Use mlflow.update_current_trace() inside a traced function to customize the Request / Response preview columns in the Traces UI. The same call can attach tags; for the full tags-and-metadata workflow, see Enrich traces: tags, context, and feedback.
@mlflow.trace(name="Summarization Pipeline")
def summarize_document(document_content: str, user_instructions: str):
    mlflow.update_current_trace(tags={"environment": "production"})

    request_p = f"Doc: {document_content[:30]}... Instr: {user_instructions[:30]}..."
    mlflow.update_current_trace(request_preview=request_p)

    summary = generate_summary(document_content, user_instructions)

    mlflow.update_current_trace(response_preview=f"Summary: {summary[:50]}...")
    return summary
Exception handling
When an exception is raised inside a traced function, the span is automatically marked as failed and the exception details are recorded in the span's Events tab.
Multi-threading
MLflow tracing is thread-safe and isolates traces per thread by default. To create one trace that spans multiple threads, copy the execution context from the main thread into each worker:
import contextvars
from concurrent.futures import ThreadPoolExecutor, as_completed
import mlflow
import openai

client = openai.OpenAI()
mlflow.openai.autolog()


@mlflow.trace
def worker(question: str) -> str:
    messages = [
        {"role": "system", "content": "You are a helpful assistant."},
        {"role": "user", "content": question},
    ]
    response = client.chat.completions.create(
        model="gpt-4o-mini", messages=messages, temperature=0.1, max_tokens=100
    )
    return response.choices[0].message.content


@mlflow.trace
def main(questions: list[str]) -> list[str]:
    results = []
    with ThreadPoolExecutor(max_workers=2) as executor:
        futures = []
        for question in questions:
            ctx = contextvars.copy_context()               # copy context in main thread
            futures.append(executor.submit(ctx.run, worker, question))  # run in copy
        for future in as_completed(futures):
            results.append(future.result())
    return results


main(["What is the capital of France?", "What is the capital of Germany?"])
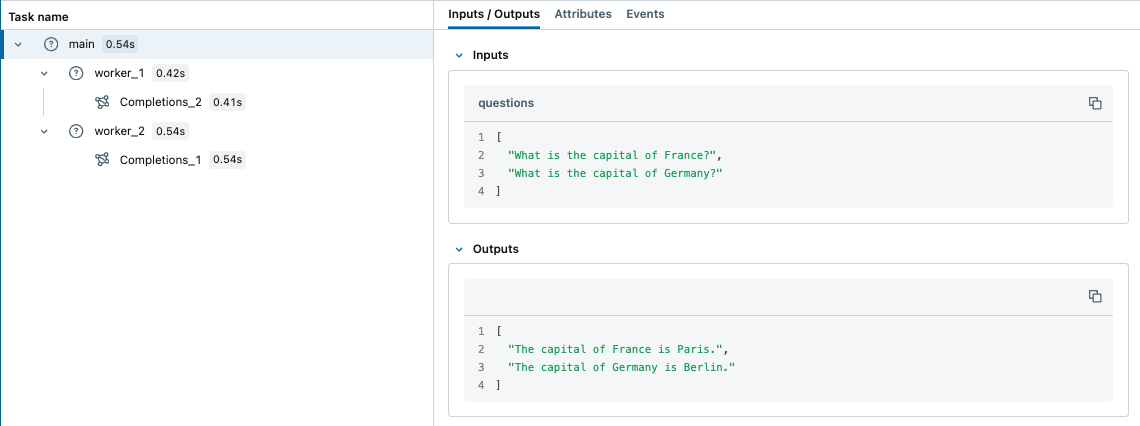
Tip
asyncio tasks inherit the context automatically — no manual copy needed for async/await code.
Streaming outputs
The decorator supports generator and async generator functions (MLflow 2.20.2+). By default, MLflow collects all yielded values as a list in the span output. Pass an output_reducer to aggregate stream chunks into a single value — the reducer receives the full list once iteration is complete:
@mlflow.trace(output_reducer=lambda chunks: "".join(chunks))
def stream_text():
    for word in ["Hello", " ", "World", "!"]:
        yield word
# Span output: "Hello World!"
Raw chunks remain visible in the span's Events tab for debugging, regardless of whether you use a reducer. For provider SDK streams whose chunks aren't plain strings — such as OpenAI's ChatCompletionChunk objects — write a reducer that accumulates the deltas into a single response object.
Tip
For OpenAI in production, prefer automatic tracing for OpenAI, which handles streaming automatically.
Supported function types:
| Function type | Supported |
|---|---|
| Sync | All versions |
| Async | MLflow 2.16.0+ |
| Generator (sync or async) | MLflow 2.20.2+ |
The mlflow.start_span() context manager
Use mlflow.start_span() to trace any code block within a function. Like the decorator, it manages parent-child relationships and exception recording automatically. Unlike the decorator, you set the span's name, inputs, and outputs through the LiveSpan object it returns.
import mlflow

with mlflow.start_span(name="my_span") as span:
    x, y = 1, 2
    span.set_inputs({"x": x, "y": y})
    z = x + y
    span.set_outputs(z)
Span events
SpanEvent objects record specific occurrences during a span's lifetime — with the current timestamp, a specific timestamp in nanoseconds, or from an exception:
from mlflow.entities import SpanEvent, SpanType
import time

with mlflow.start_span(name="pipeline_step", span_type=SpanType.CHAIN) as span:
    span.add_event(SpanEvent(
        name="validation_completed",
        attributes={"records_validated": 1000, "errors_found": 3},
    ))
    span.add_event(SpanEvent(
        name="data_checkpoint",
        timestamp=int(time.time() * 1e9),
        attributes={"checkpoint_id": "ckpt_123"},
    ))
    try:
        raise ValueError("Invalid input format")
    except Exception as e:
        # SpanEvent.from_exception captures exception.message, exception.type, exception.stacktrace
        mlflow.get_current_active_span().add_event(SpanEvent.from_exception(e))
Span status
SpanStatus marks whether a span succeeded or failed. The context manager overwrites the status on exit (OK on clean exit, ERROR on exception), so set it before the with block closes if you need custom status:
from mlflow.entities import SpanStatus, SpanStatusCode, SpanType

with mlflow.start_span(name="my_span", span_type=SpanType.CHAIN) as span:
    span.set_status(SpanStatus(SpanStatusCode.OK))
    # String shortcuts also work: span.set_status("OK") or span.set_status("ERROR")
Query status from a completed span:
trace = mlflow.get_trace(mlflow.get_last_active_trace_id())
for span in trace.data.spans:
    print(span.status.status_code)
RETRIEVER spans
Use SpanType.RETRIEVER when your span retrieves documents from a data store. RETRIEVER spans must output a list of Document objects so the UI renders them correctly:
from mlflow.entities import Document, SpanType


@mlflow.trace(span_type=SpanType.RETRIEVER)
def retrieve_documents(query: str):
    span = mlflow.get_current_active_span()
    documents = [
        Document(
            page_content="The content of the document...",
            metadata={"doc_uri": "path/to/document.md", "relevance_score": 0.95},
            id="doc_123",
        ),
        Document(
            page_content="Another relevant section...",
            metadata={"doc_uri": "path/to/other.md", "relevance_score": 0.87},
        ),
    ]
    span.set_outputs(documents)
    return [doc.to_dict() for doc in documents]


retrieve_documents(query="What is ML?")
Node.js / TypeScript
The mlflow-tracing npm package brings MLflow tracing to TypeScript and JavaScript agents. The API mirrors the Python approach: a function-wrapping API (equivalent to the decorator), a block-tracing API (equivalent to start_span), and a class method decorator for TypeScript 5.0+.
Set up
import * as mlflow from 'mlflow-tracing';

mlflow.init({
  trackingUri: 'databricks',
  experimentId: '<your-experiment-id>',
});
Find the experiment ID in your Databricks workspace under AI/ML > Experiments > GenAI apps & agents by clicking the  icon. Configure credentials with environment variables:
export DATABRICKS_TOKEN=<personal-access-token>
export DATABRICKS_HOST=https://<workspace>.cloud.databricks.com
Trace a function
Wrap any function with mlflow.trace() to create a traced version. MLflow captures inputs, outputs, exceptions, and latency automatically. Nested traced calls produce a multi-span trace reflecting the call hierarchy.
const getWeather = async (city: string) => `The weather in ${city} is sunny`;
const tracedGetWeather = mlflow.trace(getWeather, { name: 'get-weather' });
const result = await tracedGetWeather('San Francisco');
Class method decorator (TypeScript 5.0+)
class MyAgent {
  @mlflow.trace({ spanType: mlflow.SpanType.LLM })
  generateText(prompt: string) {
    return "It's sunny in Seattle!";
  }
}
Trace a code block
Use mlflow.withSpan() to trace a block of code — the TypeScript equivalent of mlflow.start_span():
const result = await mlflow.withSpan(async (span: mlflow.Span) => "It's sunny in Seattle!", {
  name: 'generateText',
  spanType: mlflow.SpanType.TOOL,
  inputs: { prompt: question },
});
Automatic tracing for OpenAI
Wrap the OpenAI client with tracedOpenAI to trace all calls automatically:
import { OpenAI } from 'openai';
import { tracedOpenAI } from 'mlflow-openai';

const client = tracedOpenAI(new OpenAI());
const response = await client.chat.completions.create({
  model: 'gpt-4o-mini',
  messages: [{ role: 'user', content: "What's the weather in Seattle?" }],
});
For a complete working example, see the TypeScript full-stack example on GitHub.
Combine automatic and manual tracing
Automatic tracing and manual tracing compose. Enable autolog() for each framework your agent uses and MLflow captures those calls in one trace; add @mlflow.trace to group them under a single parent span or to instrument your own functions — pre/post-processing, business logic, routing — that autolog doesn't see.
Trace multiple frameworks in one trace
Enable autolog for each framework and MLflow stitches their calls into a single cohesive trace. Use this when your agent combines direct LLM calls with an orchestration layer:
import mlflow

mlflow.openai.autolog()
mlflow.langchain.autolog()

# All OpenAI and LangChain calls in the same execution appear in one trace
To group calls from multiple frameworks under a single parent span, wrap the workflow with @mlflow.trace:
import mlflow
import openai
from langchain_openai import ChatOpenAI
from langchain_core.prompts import ChatPromptTemplate

mlflow.openai.autolog()
mlflow.langchain.autolog()

client = openai.OpenAI()

@mlflow.trace
def multi_provider_workflow(query: str):
    # Direct OpenAI call — auto-traced as a child span
    topics = client.chat.completions.create(
        model="gpt-4o-mini",
        messages=[
            {"role": "system", "content": "Extract key topics from the query."},
            {"role": "user", "content": query},
        ],
    ).choices[0].message.content

    # LangChain chain — also auto-traced as a child span
    chain = ChatPromptTemplate.from_template(
        "Topics: {topics}\nRespond to: {query}"
    ) | ChatOpenAI(model="gpt-4o-mini")
    return chain.invoke({"topics": topics, "query": query})

multi_provider_workflow("Explain quantum computing")
Add manual spans alongside autolog
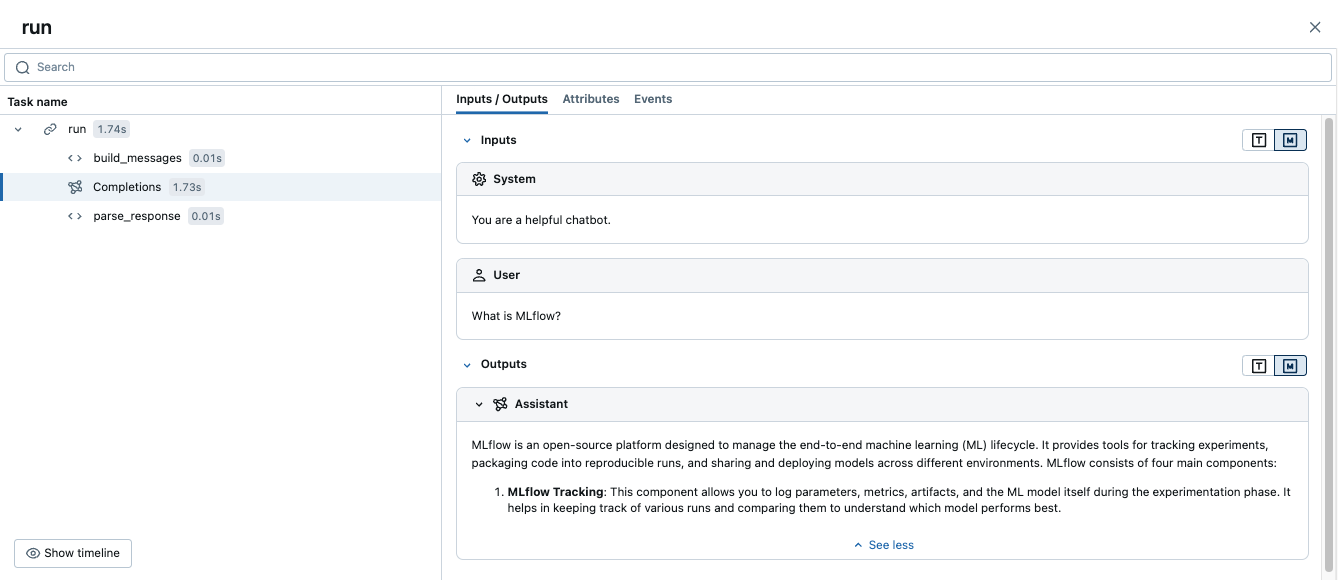
Add @mlflow.trace to your own functions to capture logic that autolog doesn't cover. MLflow merges these spans with the auto-captured ones into a single trace:
import mlflow
import openai

mlflow.openai.autolog()
client = openai.OpenAI()

@mlflow.trace
def run(question):
    messages = build_messages(question)
    response = client.chat.completions.create(  # auto-traced by autolog
        model="gpt-4o-mini", max_tokens=100, messages=messages,
    )
    return parse_response(response)

@mlflow.trace
def build_messages(question):
    return [
        {"role": "system", "content": "You are a helpful chatbot."},
        {"role": "user", "content": question},
    ]

@mlflow.trace
def parse_response(response):
    return response.choices[0].message.content

run("What is MLflow?")
This produces one trace: a run parent span with build_messages and parse_response children, plus the OpenAI span captured automatically.
Deploy outside Databricks
Tracing an agent deployed outside Databricks uses the same instrumentation. Set the following environment variables before starting the agent process, then instrument your code with any of the methods above:
export DATABRICKS_HOST="https://your-workspace.cloud.databricks.com"
export DATABRICKS_TOKEN="your-databricks-token"
export MLFLOW_TRACKING_URI=databricks
export MLFLOW_EXPERIMENT_NAME="/Shared/production-genai-agent"
For production deployments, prefer the lightweight mlflow-tracing package (pip install mlflow-tracing) over the full mlflow[databricks]. For Docker, Kubernetes, and UC storage setup, see Trace agents deployed outside of Databricks.
Advanced: low-level client API
The MlflowClient API gives you direct control over every aspect of the trace lifecycle. Most agents don't need it — use the decorator or context manager instead. Reach for the client API when you need custom trace ID schemes or integration with an existing observability system.
Important
Client APIs don't interoperate with the decorator or mlflow.start_span(). Use one style consistently within a given trace.
Lifecycle
Every start_trace or start_span call must have a matching end_trace or end_span. Unclosed spans produce incomplete traces.

| Identifier | Description | Use |
|---|---|---|
request_id |
Unique trace identifier | Links all spans in the trace |
span_id |
Unique span identifier | Identifies which span to end |
parent_id |
Parent span's span_id |
Creates the parent-child hierarchy |
Basic usage
from mlflow import MlflowClient

client = MlflowClient()

root_span = client.start_trace(
    name="my_agent_flow",
    inputs={"user_id": "123", "action": "generate_report"},
    attributes={"environment": "production", "version": "1.0.0"},
)
request_id = root_span.request_id

data_span = client.start_span(
    name="fetch_user_data",
    request_id=request_id,
    parent_id=root_span.span_id,
    inputs={"user_id": "123"},
    attributes={"database": "users_db"},
)

client.end_span(
    request_id=data_span.request_id,
    span_id=data_span.span_id,
    outputs={"record_count": 42},
    status="OK",
)

client.end_trace(
    request_id=request_id,
    outputs={"report_url": "https://example.com/report/123"},
    status="OK",
)
Error handling
Always close spans even when exceptions occur. A reusable context manager makes this safe and concise:
from contextlib import contextmanager

@contextmanager
def traced_span(client, name, request_id, parent_id=None, **kwargs):
    span = client.start_span(name=name, request_id=request_id, parent_id=parent_id, **kwargs)
    try:
        yield span
    except Exception as e:
        client.end_span(request_id=span.request_id, span_id=span.span_id,
                        status="ERROR", attributes={"error": str(e)})
        raise
    else:
        client.end_span(request_id=span.request_id, span_id=span.span_id, status="OK")

# Usage
with traced_span(client, "my_operation", request_id, parent_id) as span:
    result = perform_operation()
Common pitfalls
- Forgetting to end spans — always use try/finally or the context manager pattern above.
- Incorrect parent IDs — verify you're passing the right
span_idasparent_id. - Hardcoded trace IDs — always generate unique IDs.
- Thread safety — client APIs are not thread-safe by default; manage concurrency explicitly.
- Using
mlflow.log_metric()— this writes to an MLflow Run, not to the current span. Usespan.set_attribute()orspan.set_attributes()instead.
Custom OpenTelemetry instrumentation
Note
Custom OTel instrumentation sending traces to Azure Databricks uses the OTel tracing preview. Make sure this preview is enabled in your workspace before proceeding.
If your agent uses the OTel SDK directly rather than a pre-built integration, set the span attributes described in this section so MLflow renders span types, inputs, outputs, and token counts correctly. Pre-built integrations set these attributes automatically.
Note
The OTel attribute mappings for Azure Databricks managed MLflow differ from those for OSS MLflow. For the OSS attribute mapping, see the MLflow documentation.
Requirements
This section requires a Unity Catalog-backed experiment with an OTel trace location and the OTel tracing preview enabled in your workspace. See Requirements.
Set span type
Set gen_ai.operation.name to identify the operation type. MLflow reads this attribute and displays the corresponding MLflow span type in the trace UI. The value follows the OpenTelemetry GenAI Semantic Convention.
OTel gen_ai.operation.name value |
MLflow span type |
|---|---|
chat |
CHAT_MODEL |
text_completion |
LLM |
generate_content |
LLM |
response |
LLM |
embeddings |
EMBEDDING |
execute_tool |
TOOL |
create_agent |
AGENT |
invoke_agent |
AGENT |
span.set_attribute("gen_ai.operation.name", "chat")
Set inputs and outputs
Set gen_ai.input.messages and gen_ai.output.messages on each span that should display inputs and outputs. Setting them on the root span also populates the trace-level request and response previews.
| OTel attribute | MLflow attribute |
|---|---|
gen_ai.input.messages |
mlflow.spanInputs |
gen_ai.output.messages |
mlflow.spanOutputs |
Values can be plain strings or JSON-serialized strings. JSON arrays of message objects with role and content fields enable richer rendering in the MLflow UI (labeled "User" and "Assistant" bubbles):
import json

# Plain string — displays as-is in the UI
span.set_attribute("gen_ai.input.messages", "What is the weather today?")

# JSON message array — renders with role labels in the UI
span.set_attribute("gen_ai.input.messages", json.dumps([
    {"role": "system", "content": "You are a helpful assistant."},
    {"role": "user", "content": "What is the weather today?"}
]))
span.set_attribute("gen_ai.output.messages", json.dumps([
    {"role": "assistant", "content": "It is sunny and 72°F in San Francisco."}
]))
Set token usage
Set gen_ai.usage.input_tokens and gen_ai.usage.output_tokens on the root span to display token counts in the UI trace summary. MLflow reads these values from the root span because it aggregates counts at the trace level.
OTel gen_ai.usage.* attribute |
MLflow token field |
|---|---|
gen_ai.usage.input_tokens |
Input token count |
gen_ai.usage.output_tokens |
Output token count |
| (not set — calculated automatically) | Total token count |
root.set_attribute("gen_ai.usage.input_tokens", 150)
root.set_attribute("gen_ai.usage.output_tokens", 42)
Set session and user
Set session.id and user.id to associate traces with a specific session or user. MLflow reads these from the root span and displays them as trace-level metadata. Setting session.id enables the session tab in the MLflow UI.
| OTel attribute | MLflow metadata field |
|---|---|
session.id |
Session or conversation identifier |
user.id |
Agent end-user identifier |
span.set_attribute("session.id", "conversation-123")
span.set_attribute("user.id", "user-456")
Full example: a Python agent with an LLM child span
The following example puts all four attribute categories together in a simple agent with an LLM child span. It assumes you have already configured the OTLP exporter to send traces to Azure Databricks.
import json
from opentelemetry import trace

tracer = trace.get_tracer("my-agent")

def run_agent(query: str) -> str:
    with tracer.start_as_current_span("agent-run") as root:
        # Child LLM span — set gen_ai attributes for this individual call
        with tracer.start_as_current_span("chat") as llm:
            llm.set_attribute("gen_ai.operation.name", "chat")
            messages = [
                {"role": "system", "content": "You are a helpful assistant."},
                {"role": "user", "content": query}
            ]
            response = call_llm(messages)
            llm.set_attribute("gen_ai.input.messages", json.dumps(messages))
            llm.set_attribute("gen_ai.output.messages", json.dumps([
                {"role": "assistant", "content": response}
            ]))
            llm.set_attribute("gen_ai.usage.input_tokens", 150)
            llm.set_attribute("gen_ai.usage.output_tokens", 42)

        # Root span — MLflow reads inputs, outputs, token usage, and session ID
        # from the root span to populate the trace summary in the UI.
        root.set_attribute("gen_ai.operation.name", "chat")
        root.set_attribute("session.id", "conversation-123")
        root.set_attribute("user.id", "user-456")
        root.set_attribute("gen_ai.input.messages", json.dumps([
            {"role": "user", "content": query}
        ]))
        root.set_attribute("gen_ai.output.messages", json.dumps([
            {"role": "assistant", "content": response}
        ]))
        root.set_attribute("gen_ai.usage.input_tokens", 150)
        root.set_attribute("gen_ai.usage.output_tokens", 42)
        return response
Verify in the MLflow UI
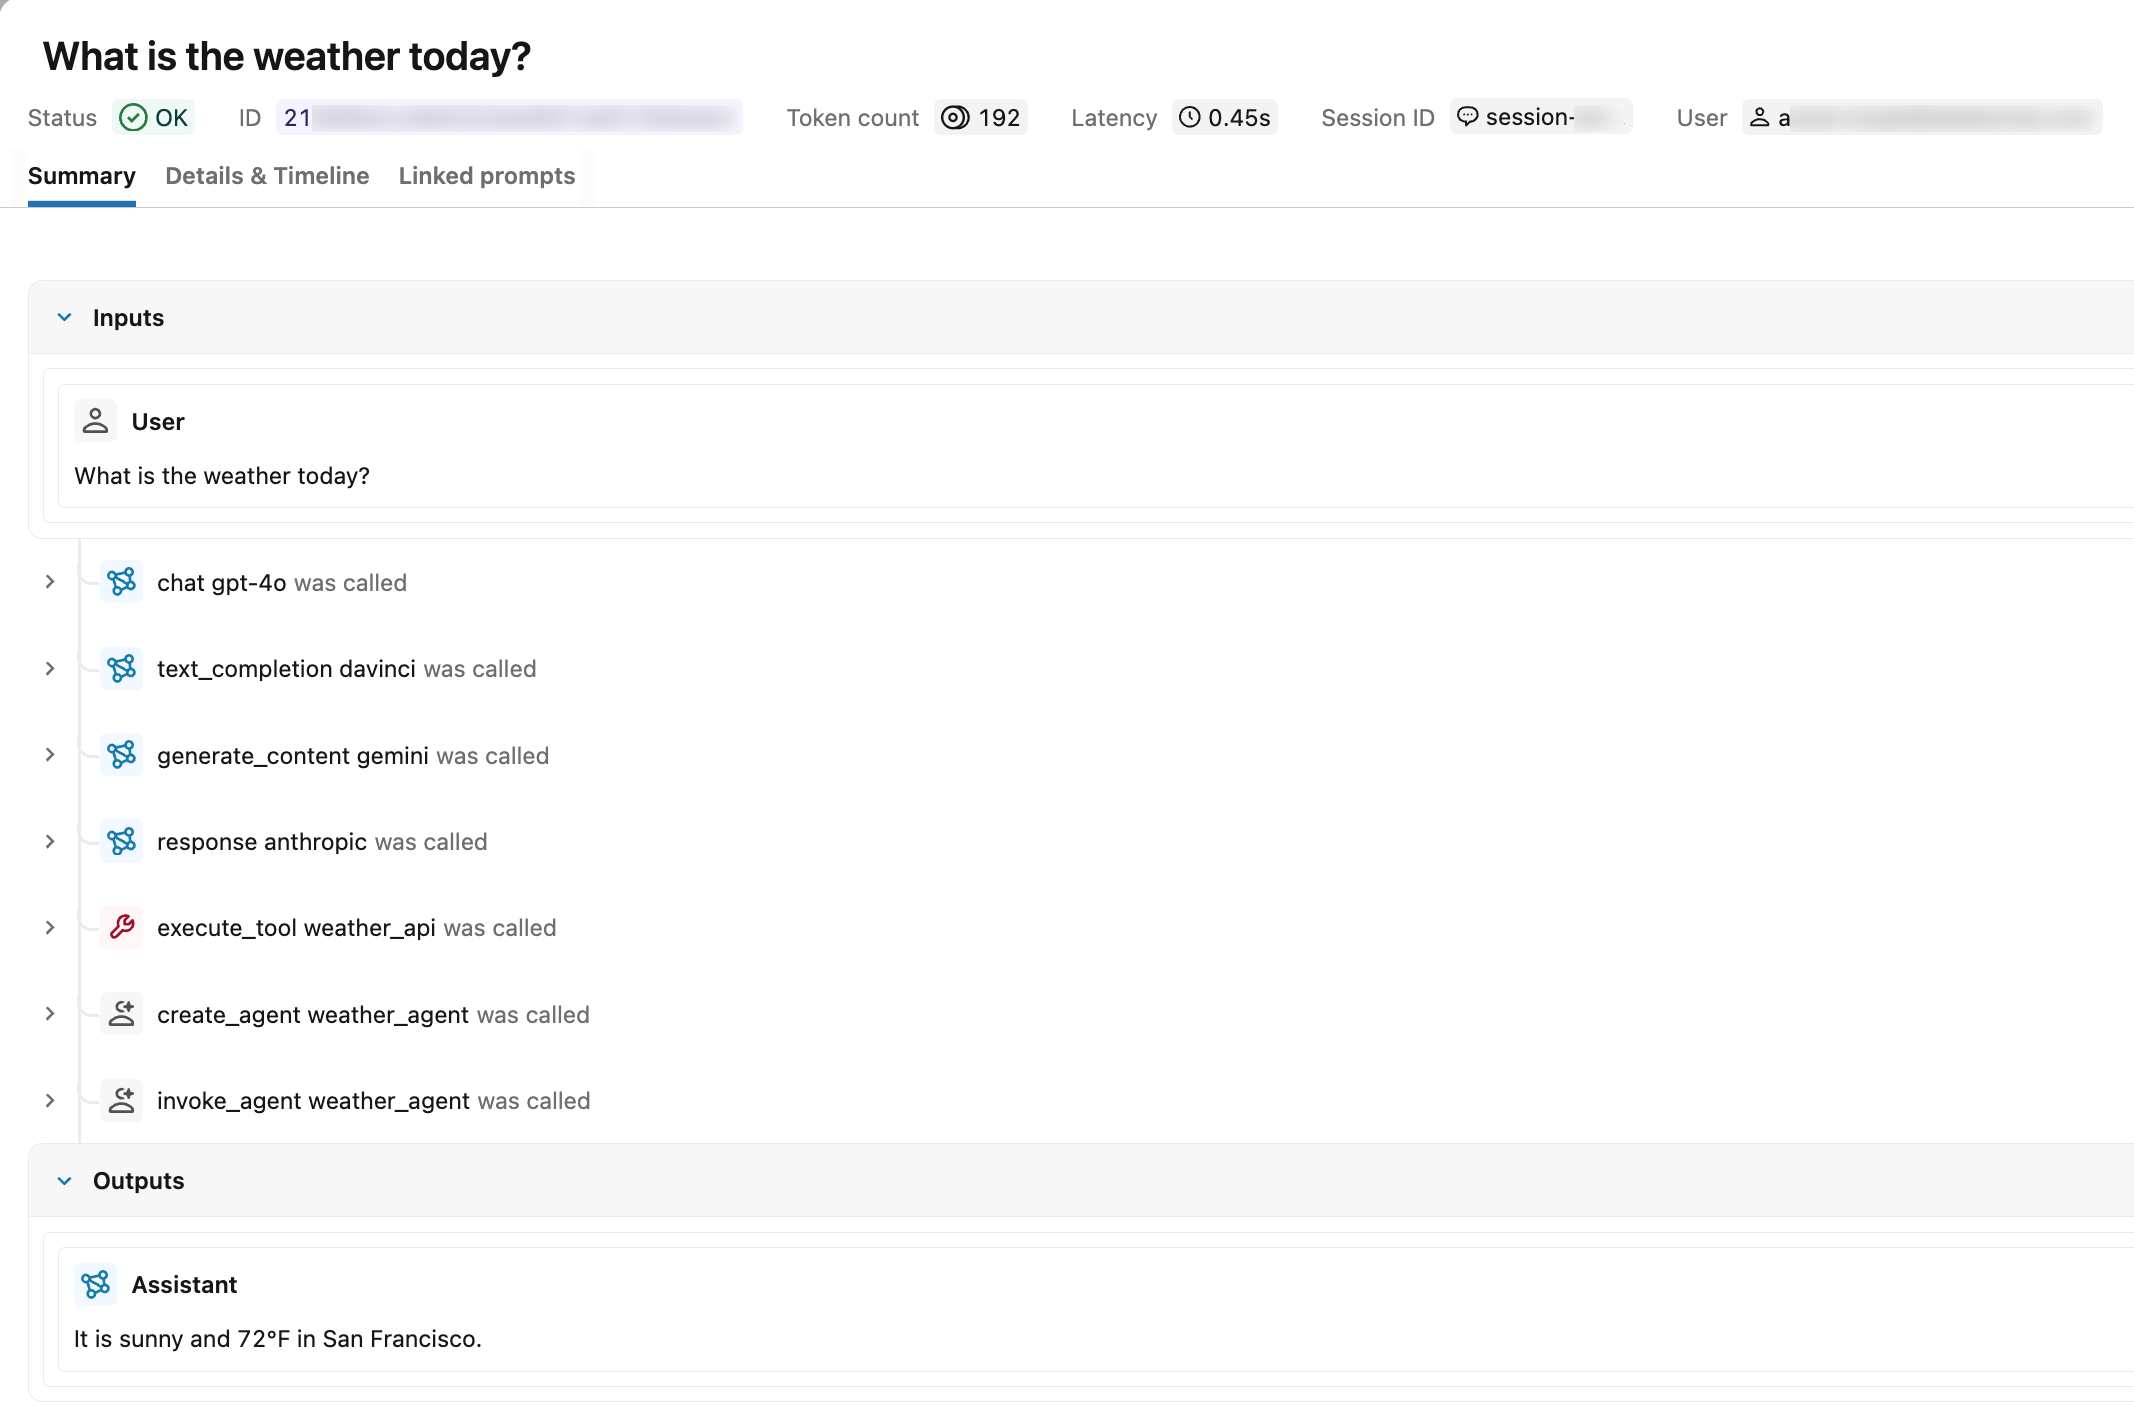
After you call run_agent(), open the Traces tab in your MLflow experiment. A correctly instrumented trace shows:
- Span types: Each span displays its type label (for example,
chat) instead ofUNKNOWN. - Request and response: The root span shows the input and output messages.
- Token usage: The trace summary displays input, output, and total token counts.
- Session and user: The trace appears in the session tab under the specified session identifier, and the user ID appears in the trace metadata.
Search for traces by OTel span attributes
After traces are ingested into Unity Catalog — whether from Langfuse or from a custom OTel-instrumented agent — use the span.attributes.* prefix in mlflow.search_traces() to filter by the OTel attribute values you set. The attribute name after the prefix is the same name passed to span.set_attribute().
import mlflow

# experiment_id is visible in the MLflow UI URL and experiment details panel
mlflow.set_experiment(experiment_id="<experiment-id>")

# Find traces from a specific session (set using session.id)
traces = mlflow.search_traces(
    filter_string="span.attributes.session.id = 'conversation-123'"
)

# Find traces from a specific user (set using user.id)
traces = mlflow.search_traces(
    filter_string="span.attributes.user.id = 'user-456'"
)

# Find traces from a specific model (set using gen_ai.request.model)
traces = mlflow.search_traces(
    filter_string="span.attributes.gen_ai.request.model LIKE '%gpt%'"
)

# Find traces by operation type (set using gen_ai.operation.name)
traces = mlflow.search_traces(
    filter_string="span.attributes.gen_ai.operation.name = 'chat'"
)

# Find high-token traces (set using gen_ai.usage.input_tokens)
traces = mlflow.search_traces(
    filter_string="span.attributes.gen_ai.usage.input_tokens > 1000"
)
For the full filter_string syntax including supported operators and comparators, see Programmatic access to traces.
Limitations
Custom OTel span attributes are not surfaced as MLflow trace tags. Attributes set with span.set_attribute() outside the recognized OTel-to-MLflow mappings do not appear in:
- The Tags column or the unified trace view in the MLflow UI.
- The
_traces_unifiedUnity Catalog table. - The
tagsfield returned bymlflow.search_traces().
These attributes are preserved on the underlying span. They remain visible in the Attributes tab of the trace UI and are queryable through the <prefix>_otel_spans.attributes field of the OTel spans table.
To attach searchable tags that appear in the unified trace view, use the MLflow tag APIs. See Enrich traces: tags, context, and feedback.
Trace data model reference
The span attributes, span types, and lifecycle concepts below apply to any span you create, whether through a decorator, a context manager, or the low-level client.
Span attributes
Attributes are key-value pairs that provide insight into an operation's configuration and execution context.
You can add platform-specific attributes to enrich observability. For example, you can add the Unity Catalog objects the span touched, the model serving endpoint, or the compute resource.
For example, set attributes on a span that wraps an LLM call:
span.set_attributes({
    "ai.model.name": "claude-3-5-sonnet-20241022",
    "ai.model.version": "2024-10-22",
    "ai.model.provider": "anthropic",
    "ai.model.temperature": 0.7,
    "ai.model.max_tokens": 1000,
})
Span types
MLflow provides predefined SpanType values for common operations. For specialized cases, pass a custom string value as the span type.
| Type | Description |
|---|---|
CHAT_MODEL |
Query to a chat model (specialized LLM interaction) |
CHAIN |
Chain of operations |
AGENT |
Autonomous agent operation |
TOOL |
Tool execution (typically by agents), such as search queries |
EMBEDDING |
Text embedding operation |
RETRIEVER |
Context retrieval operation such as vector database queries |
PARSER |
Parsing operation transforming text to structured format |
RERANKER |
Re-ranking operation ordering contexts by relevance |
MEMORY |
Memory operation persisting context in long-term storage |
UNKNOWN |
Default type used when no other type is specified |
You assign a span type when you create the span. See Customize spans for how to set span_type on the decorator, or the context manager for a span block.
Active vs. finished traces and spans
An active trace is one that MLflow is currently writing, for example, while a function decorated with @mlflow.trace is running. After the decorated function exits, the trace is finished, but you can still annotate it with new data.
Spans follow the same lifecycle. An active span, represented by LiveSpan, is produced by a decorated function or a span context manager. After the function exits or the context manager closes, the span is finished and becomes an immutable Span.
To work with active or recent traces and spans, use these methods:
mlflow.get_active_trace_id(): Returns the ID of the currently active trace.mlflow.get_last_active_trace_id(): Returns the ID of the most recent finished trace.mlflow.get_current_active_span(): Returns the active span so you can modify it.
Additional resources
- Automatic tracing and integrations — Instrument a supported framework with one line of code
- Observe and find issues — View and analyze your collected traces
- Store OpenTelemetry traces in Unity Catalog — Governed Unity Catalog trace storage for production
- Enrich traces: tags, context, and feedback — Attach tags, user session IDs, and user feedback to traces
- Evaluate agent quality — Run evaluations on your traces
Next step: Enrich traces: tags, context, and feedback