Note
Access to this page requires authorization. You can try signing in or changing directories.
Access to this page requires authorization. You can try changing directories.
Important
This feature is in Beta. Workspace admins can control access to this feature from the Previews page. See Manage Azure Databricks previews.
Diagnosing a slow query, a failed schema change, or a capacity problem usually means knowing which Postgres system view to check and what a normal value looks like versus a problem. AI-assisted troubleshooting puts that knowledge into Genie instead: Lakebase tells you when something is wrong and helps you fix it, without requiring you to be a Postgres expert. It applies the same idea as Genie ZeroOps for jobs and pipelines, but for your Postgres database.
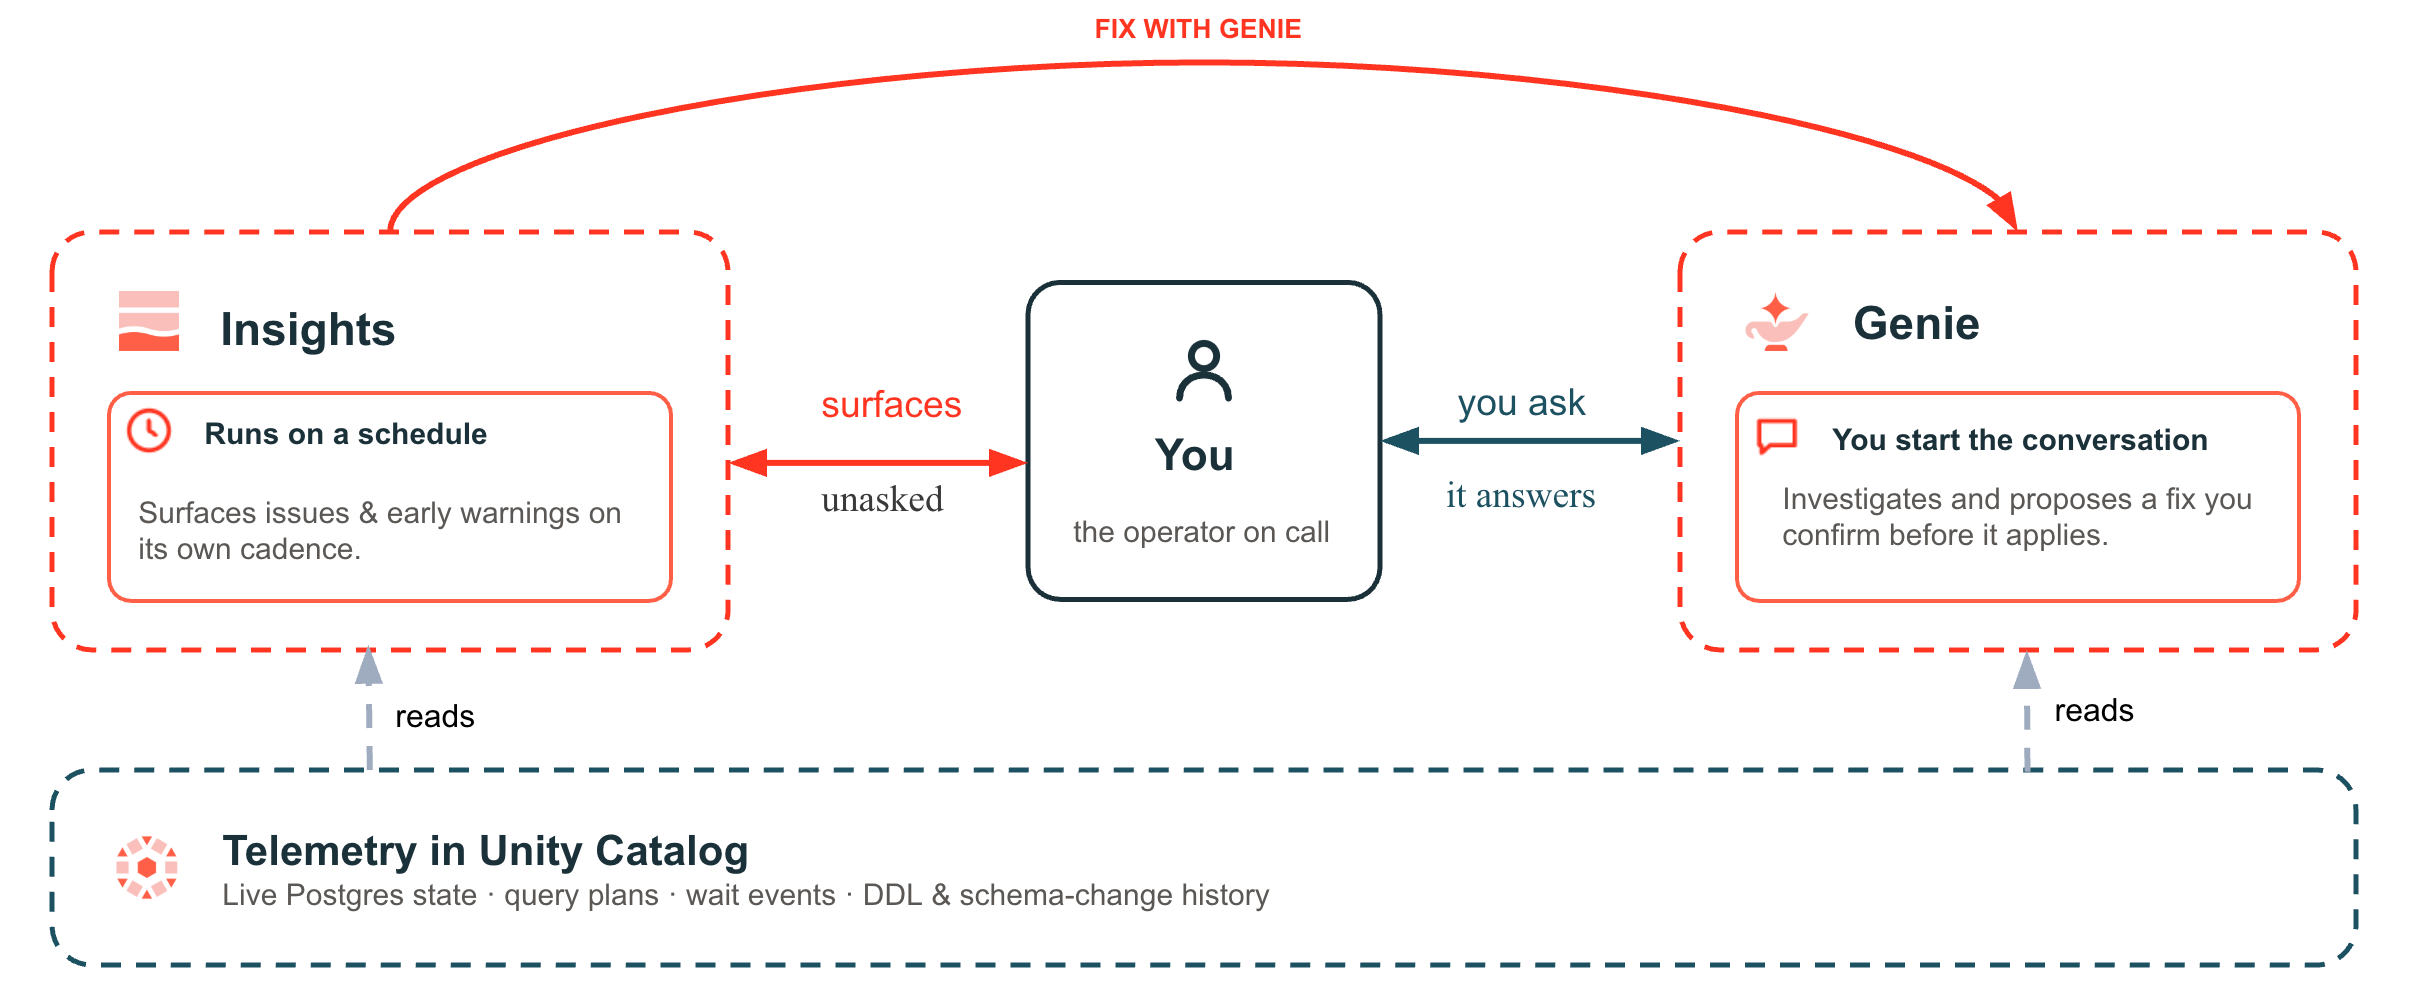
Insights and Genie differ in when they start and what they hand you:
| Insights | Genie | |
|---|---|---|
| How it starts | Automatic. Runs in the background on a schedule. | You ask. Open Genie and describe a problem. |
| What it's for | Catching issues and early warnings, before or as they affect you. | Investigating a specific issue, in your own words, right now. |
| What it gives you | A severity, a plain-language summary, supporting evidence, and recommendations. | A conversational investigation where you approve each step, ending in a proposed fix you confirm before it's applied. |
| Example | An insight titled "Idle session locked out 4 updates," pointing at a session that held a lock while idle, blocking other queries for minutes. | You ask "why is the error rate up?" and Genie traces it to a column a recent schema change dropped. |
Both read the same underlying telemetry, and you can move between them. For example, click Fix with Genie on an insight to keep investigating conversationally.
How it works
Lakebase runs a managed exporter for your project that captures Postgres diagnostics and exports them to Delta tables in the Unity Catalog catalog and schema you choose. Genie also queries your compute directly for live Postgres state when you ask it to investigate something.
Lakebase captures the signals an experienced DBA would look for, landing in a handful of tables you can query directly once they're exported:
| What's captured | Where it lands |
|---|---|
| Active sessions and wait events | active_session_history, wait_event_counters |
| Query plans and per-query execution stats | plan_history, pg_stat_statements_counters |
| Schema changes: what changed, when, and by whom | ddl_history |
| Database statistics: size, rows read and modified, and session counts | database_counters, database_gauges |
| Compute resource usage: CPU, memory, cache, connections | compute_counters, compute_gauges |
| Raw Postgres log messages, including the error behind a failure | postgres_logs |
Insights and Genie read this data to ground their answers in what actually happened in your database. For every column in each of these tables, see Telemetry table reference.
Because this telemetry lands as Delta tables in your own Unity Catalog, it's yours to keep, query, and build on with any Azure Databricks tool, rather than being locked inside a separate observability product.
Where your data lives
Your raw telemetry lives in Unity Catalog, and the findings Insights generates from it live in a Workspace folder. The Lakebase UI is a view over both.
| Where | What lives there | How you reach it |
|---|---|---|
| Your Postgres compute | Where telemetry originates. Genie can query it directly for live state | Nothing to open. It's live, queried in place |
| Unity Catalog | Raw telemetry, as the Delta tables above, in the catalog and schema you chose | Catalog Explorer, or any Azure Databricks SQL tool |
| A Workspace folder | The findings Insights generates, saved as files, not in Unity Catalog | In the Azure Databricks Workspace of the identity your configuration writes as. See Find and resolve issues with Insights. |
| The Lakebase UI | Where you work day to day | Insights: the workspace-wide list at the top level of Lakebase (all projects), or a single project's Monitoring > Insights tab. Genie: opened from within an individual project. |
Prerequisites
- A Lakebase Autoscaling project. See Get a Postgres database.
- A Unity Catalog catalog and schema to receive telemetry. Don't select a catalog or schema that uses Default storage, which isn't supported as an export destination.
- A running compute. A compute suspended by scale to zero doesn't emit telemetry until a query wakes it up.
- A decision about the identity that runs the telemetry export. Lakebase writes telemetry to Unity Catalog as this identity, so it determines which destination catalogs and schemas the export can write to and where the Workspace folder of Insights findings is saved. Choose it up front. A shared service principal is the durable choice; your own user credentials are faster for testing. See Capture telemetry to the Lakehouse.
Note
The features that make up this workflow — telemetry export to Unity Catalog, Insights, and Genie troubleshooting — are available on AWS and Azure.
Set up observability
Both Insights and Genie depend on an observability configuration that sends your project's telemetry to Unity Catalog. Create one before you use either. A single configuration can be shared across several projects, and it's also what turns on Insights.
See Capture telemetry to the Lakehouse.
Limitations
Warning
If you create roles for connecting applications, use SCRAM-authenticated passwords rather than raw passwords. This reduces the chance credentials end up in logs.
During the beta, the following limitations apply:
Available on AWS and Azure.
COPYoperations aren't currently captured in query plan history.A query executed inside a PL/pgSQL function or procedure isn't captured in query-level telemetry unless it also runs as a top-level statement. Postgres's own statement tracking only counts top-level statements by default.
Branches and endpoints appear in exported telemetry and insights by internal ID (for example,
br-odd-mud-y2icrn1h), not by a display name like "production." Cross-reference the ID in the Lakebase UI if you must confirm which branch or endpoint an insight or table row refers to.GUCs that enable telemetry capture might not propagate automatically to an existing compute. If telemetry doesn't appear after you configure observability, connect to the project and check:
SHOW neon_monitor.log_capture_enabled;
SHOW databricks.o11y_exporter_enabled;
Both must return
on. If either returnsoff, restart the compute endpoint.
Next steps
- Capture telemetry to the Lakehouse — send telemetry to Unity Catalog and turn on Insights.
- Find and resolve issues with Insights — turn on proactive monitoring and learn how to read what it finds.
- Diagnose and fix issues with Genie — investigate a problem conversationally and walk through a recovery end to end.
- Observe Lakebase projects: Track performance, resource usage, and query analysis with the rest of the observability tools. See Observability.