Note
Access to this page requires authorization. You can try signing in or changing directories.
Access to this page requires authorization. You can try changing directories.
Applies to: Azure Logic Apps (Consumption + Standard)
To get richer data for debugging and diagnosing your workflows in Azure Logic Apps, you can log workflow runtime data and events, such as trigger events, run events, and action events, that you can send to a Log Analytics workspace, Azure storage account, Azure event hub, another partner destination, or all these destinations when you set up and use Azure Monitor Logs.
Note
Azure Monitor Resource Logs aren't 100% lossless. Resource Logs are based on a store and forward architecture designed to affordably move petabytes of data per day at scale. This capability includes built-in redundancy and retries across the platform, but doesn't provide transactional guarantees. Transactional monitoring might reduce the reliability and performance of the monitored service. Also, transient logging errors must halt the upstream service when unable to confirm log delivery. Whenever the Azure Monitor team can confirm a persistent source of data loss, the team considers resolution and prevention its highest priority. However, small data losses might still happen due to temporary, non-repeating service issues distributed across Azure, and not all can be caught.
The store and forward architecture also implies that data transmission doesn't strictly happen in real time. Sometimes, you might get delays up to tens of minutes. For more information, see Resource logs.
This how-to guide shows how to complete the following tasks, based on whether you have a Consumption or Standard logic app resource.
At Consumption logic app creation, enable Log Analytics and specify your Log Analytics workspace.
-or-
For an existing Consumption logic app, install the Logic Apps Management solution in your Log Analytics workspace. This solution provides aggregated information for your logic app runs and includes specific details such as status, execution time, resubmission status, and correlation IDs.
Prerequisites
An Azure account and subscription. If you don't have a subscription, sign up for a free Azure account.
For a Consumption logic app resource, you need Azure subscription Owner or Contributor permissions so you can install the Logic Apps Management solution from the Azure Marketplace. For more information, see the following documentation:
The destination resource for where you want to send diagnostic data:
Your logic app resource and workflow
Enable Log Analytics
For a Consumption logic app, you need to first enable Log Analytics.
Enable Log Analytics at logic app creation
In the Azure portal, on the Create Logic App pane, follow these steps:
Under Plan, make sure to select Consumption so that only the options for Consumption workflows appear.
For Enable log analytics, select Yes.
From the Log Analytics workspace list, select the workspace where you want to send the data from your workflow run.
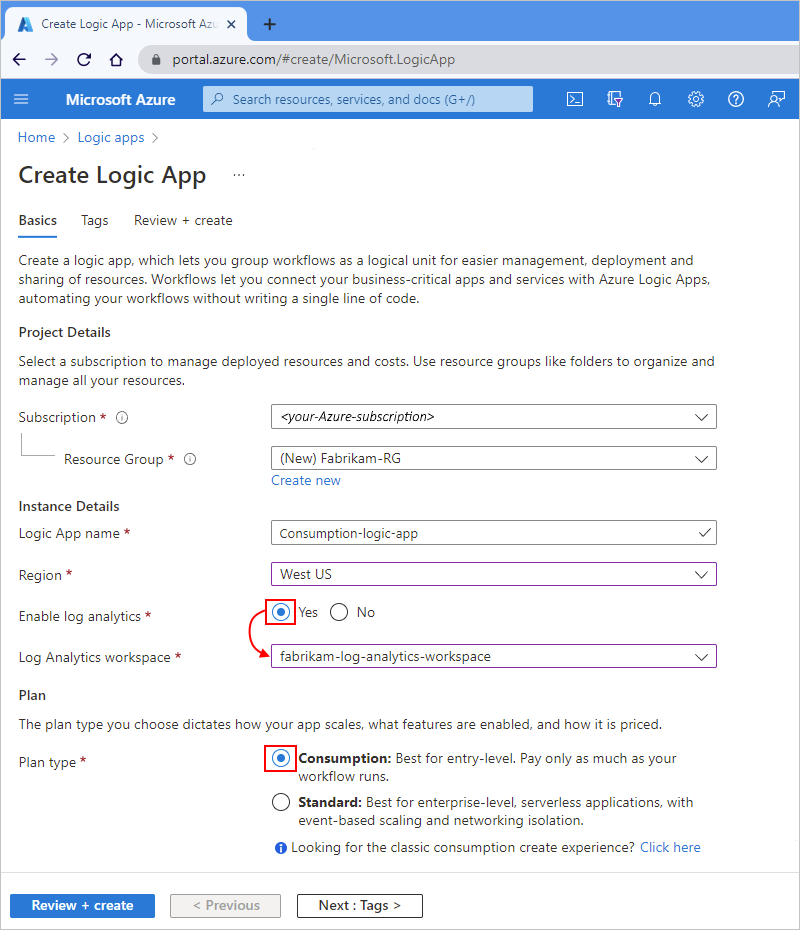
Finish creating your logic app resource.
When you're done, your logic app is associated with your Log Analytics workspace. This step also automatically installs the Logic Apps Management solution in your workspace.
After you run your workflow, view your workflow run status.
Install Logic Apps Management solution
If you turned on Log Analytics when you created your logic app resource, skip this section. You already have the Logic Apps Management solution installed in your Log Analytics workspace. Otherwise, continue with the following steps for an existing Consumption logic app:
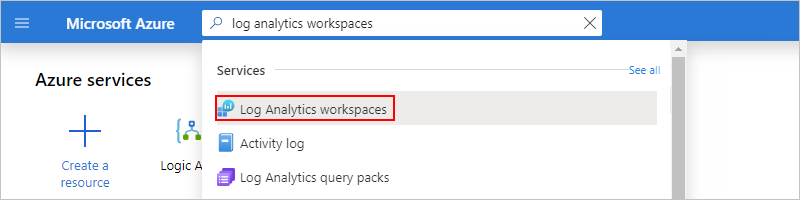
In the Azure portal search box, enter log analytics workspaces, and select Log Analytics workspaces from the results.
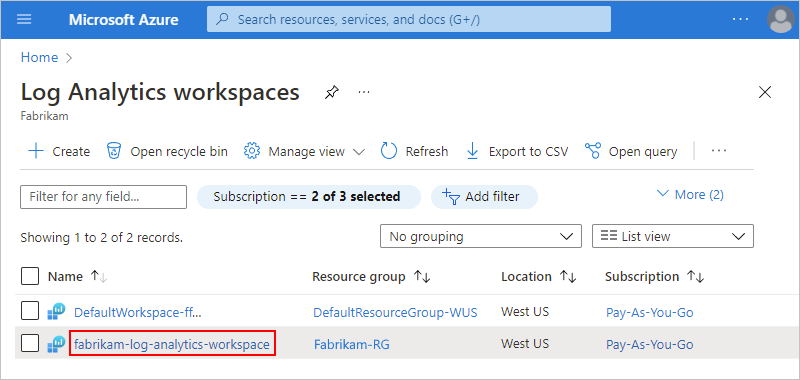
Under Log Analytics workspaces, select your workspace.
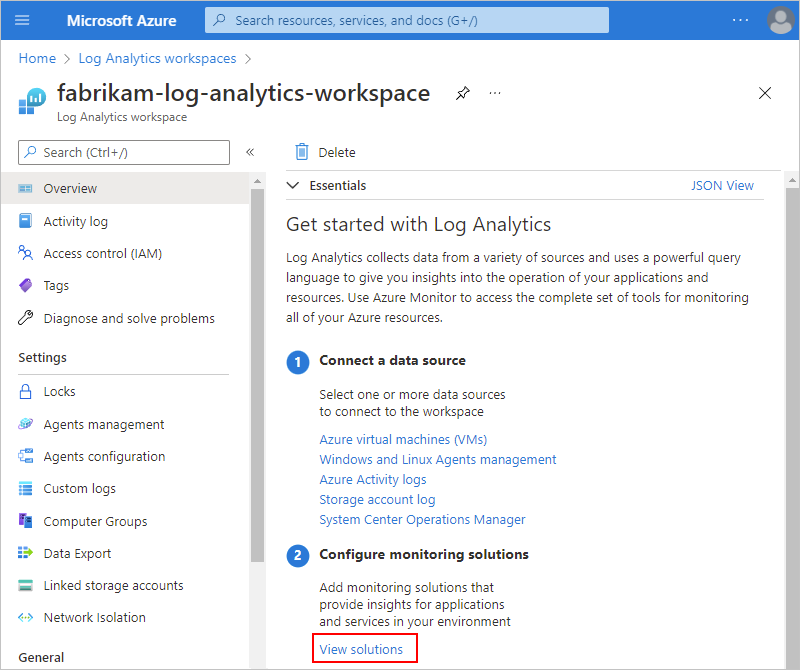
On the Overview pane, under Get started with Log Analytics > Configure monitoring solutions, select View solutions.
Under Overview, select Add, which adds a new solution to your workspace.
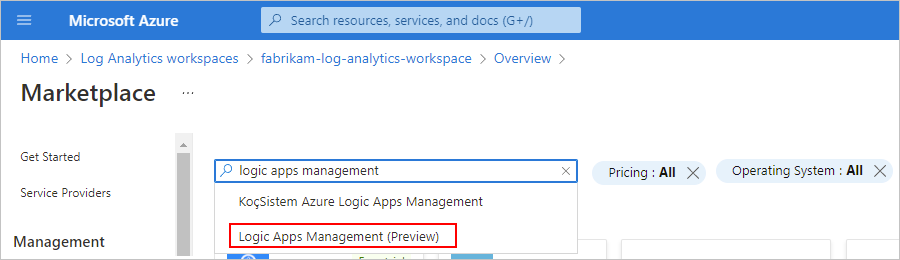
After the Marketplace page opens, in the search box, enter logic apps management, and select Logic Apps Management.
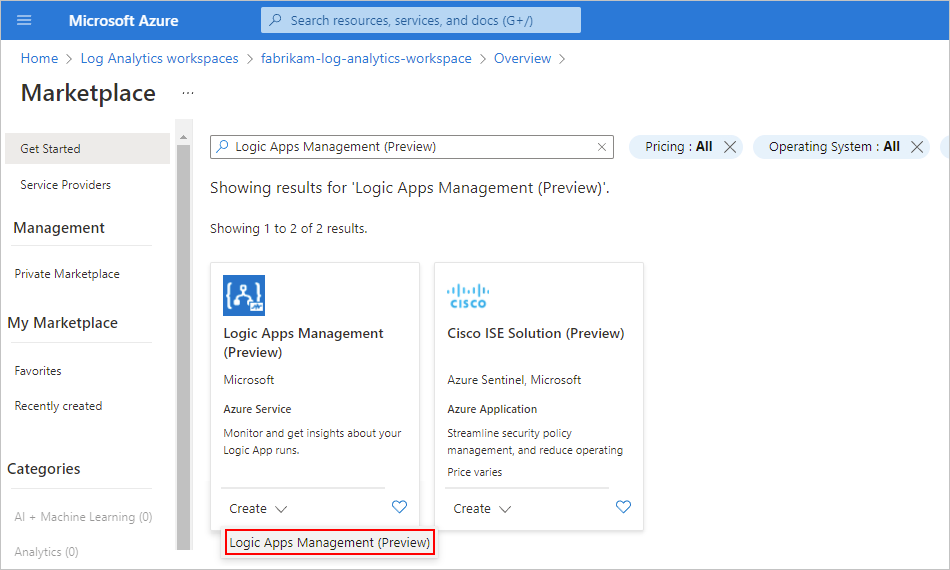
On the Logic Apps Management tile, from the Create list, select Logic Apps Management.
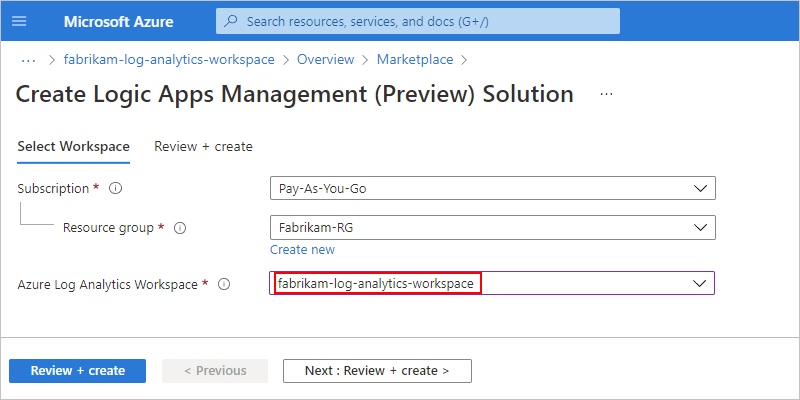
On the Create Logic Apps Management (Preview) Solution pane, select the Log Analytics workspace where you want to install the solution. Select Review + create, review your information, and select Create.
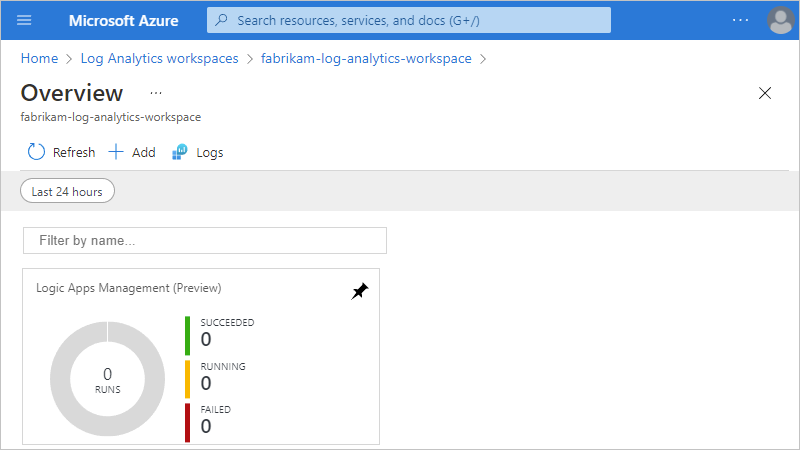
After Azure deploys the solution to the Azure resource group that contains your Log Analytics workspace, the solution appears on your workspace summary pane under Overview.
Add a diagnostic setting
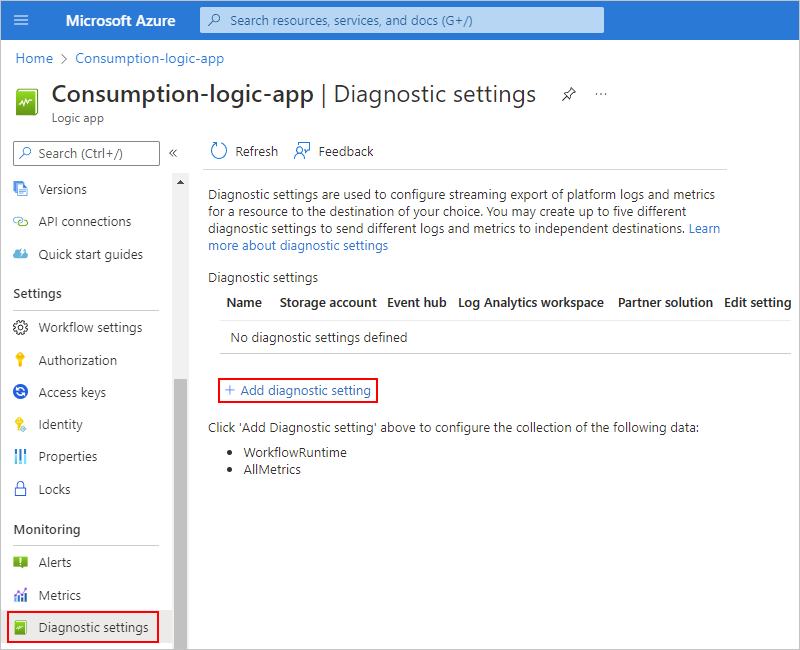
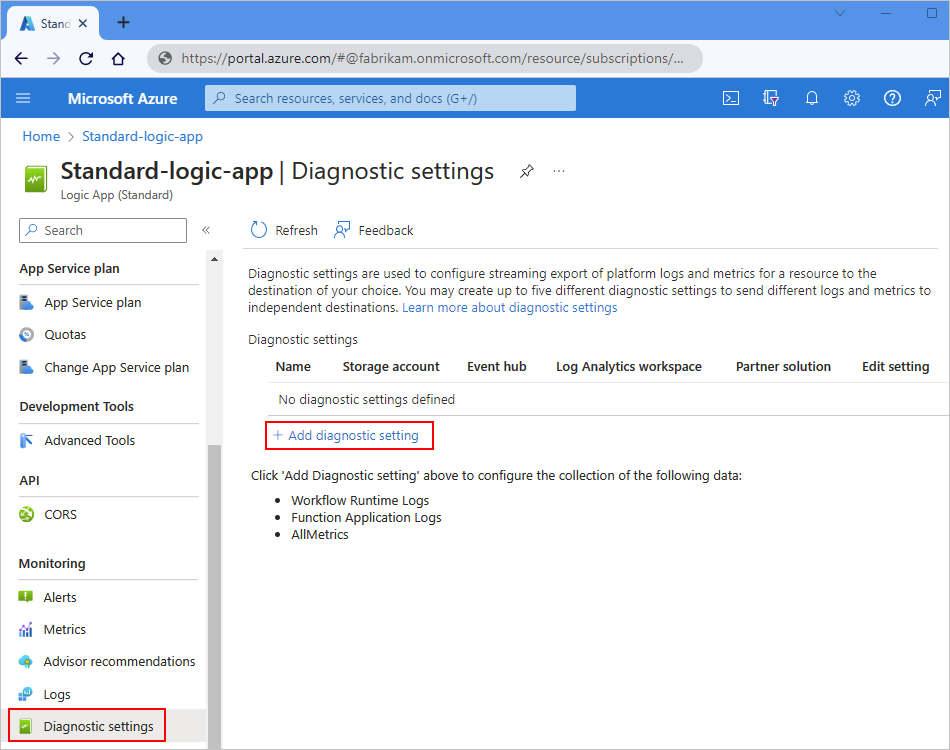
In the Azure portal, open your Consumption logic app resource.
On the logic app resource menu, under Monitoring, select Diagnostic settings. On the Diagnostic settings page, select Add diagnostic setting.
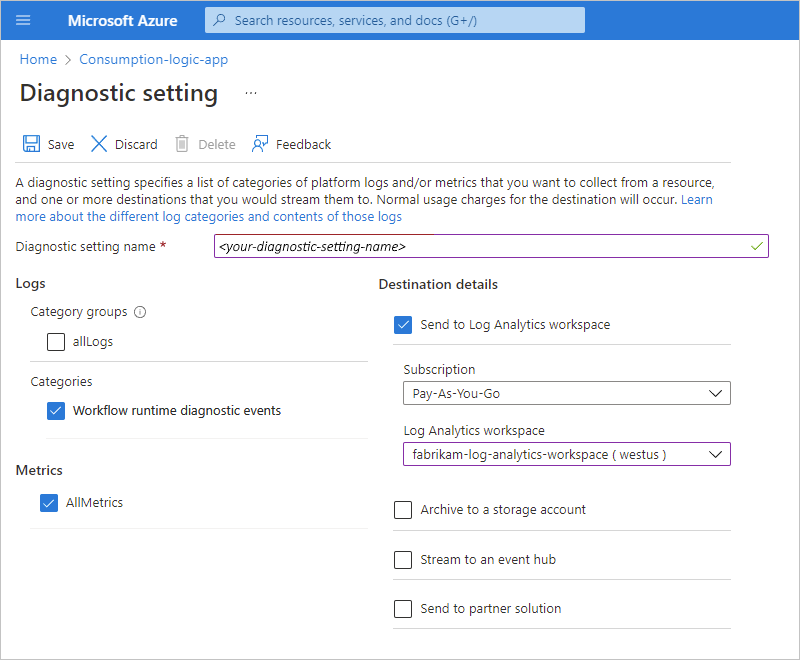
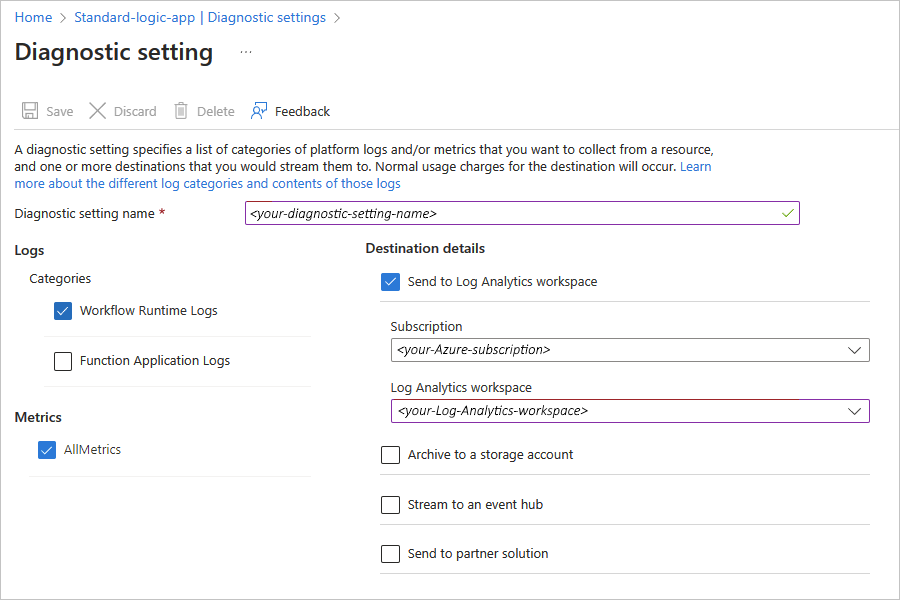
For Diagnostic setting name, provide the name that you want for the setting.
Under Logs > Categories, select Workflow runtime diagnostic events. Under Metrics, select AllMetrics.
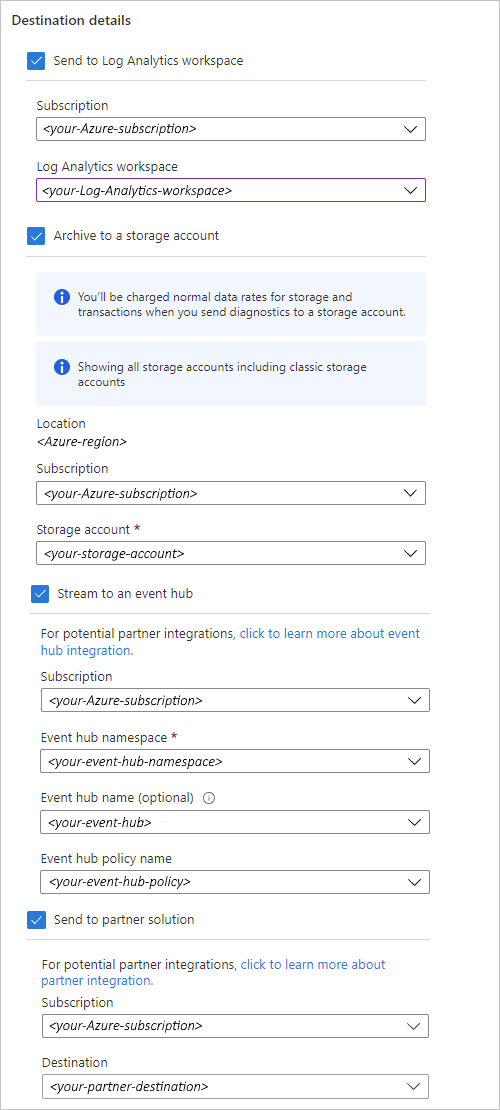
Under Destination details, select one or more destinations, based on where you want to send the logs.
Destination Directions Send to Log Analytics workspace Select the Azure subscription for your Log Analytics workspace and the workspace. Archive to a storage account Select the Azure subscription for your Azure storage account and the storage account. For more information, see Send diagnostic data to Azure Storage and Azure Event Hubs. Stream to an event hub Select the Azure subscription for your event hub namespace, event hub, and event hub policy name. For more information, see Send diagnostic data to Azure Storage and Azure Event Hubs and Azure Monitor partner integrations. Send to partner solution Select your Azure subscription and the destination. For more information, see Azure Native ISV Services overview. The following example selects a Log Analytics workspace as the destination:
To finish adding your diagnostic setting, select Save.
View workflow run status
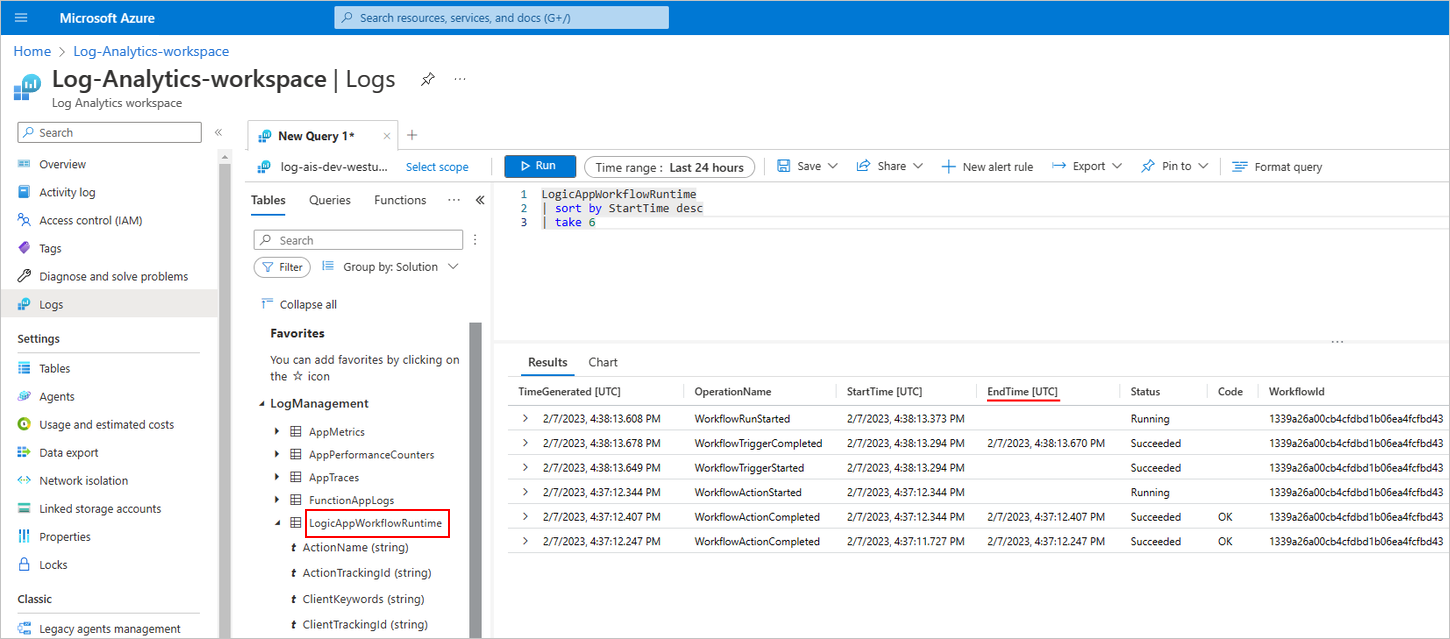
After your workflow runs, you can view the data about those runs in your Log Analytics workspace.
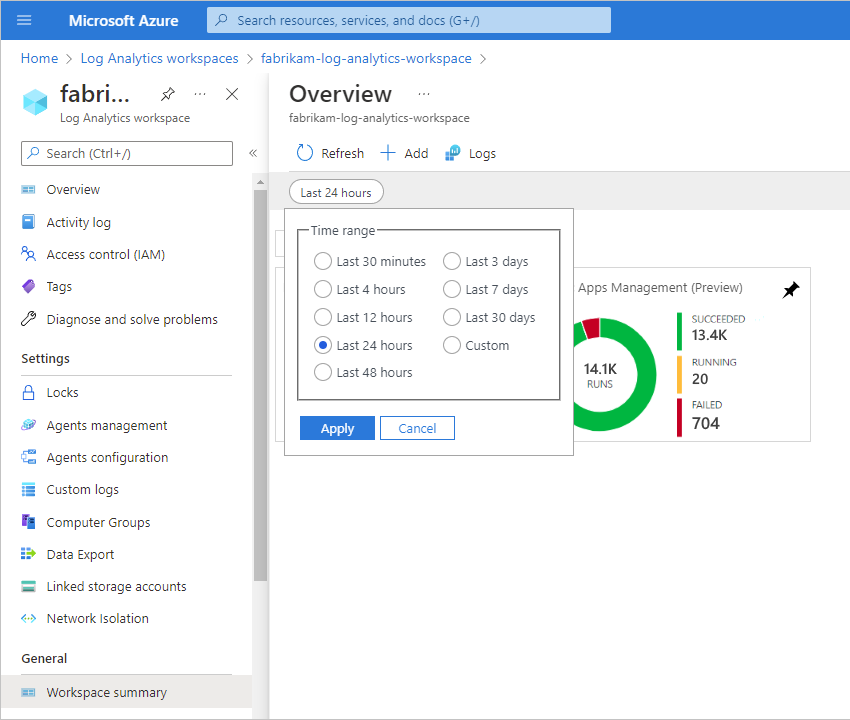
In the Azure portal, open your Log Analytics workspace.
On your workspace menu, under Classic, select Workspace summary. On the Overview page, select Logic Apps Management.
Note
If the Logic Apps Management tile doesn't immediately show results after a run, try selecting Refresh or wait for a short time before trying again.
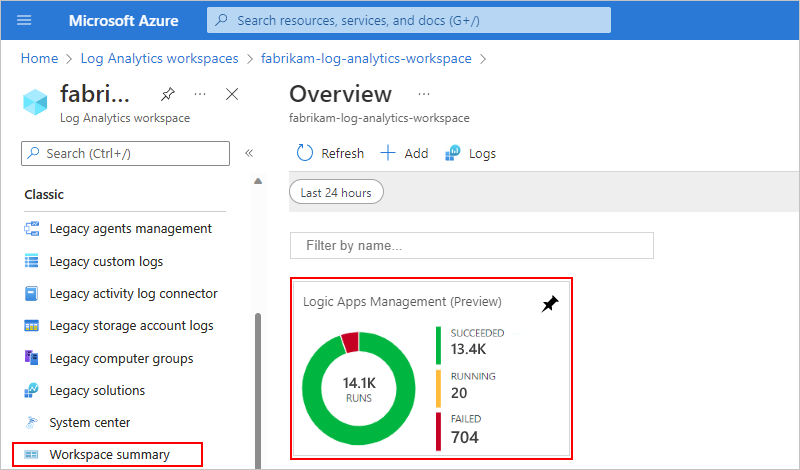
The summary page shows workflows grouped by name or by execution status. The page also shows details about failures in the actions or triggers for the workflow runs.
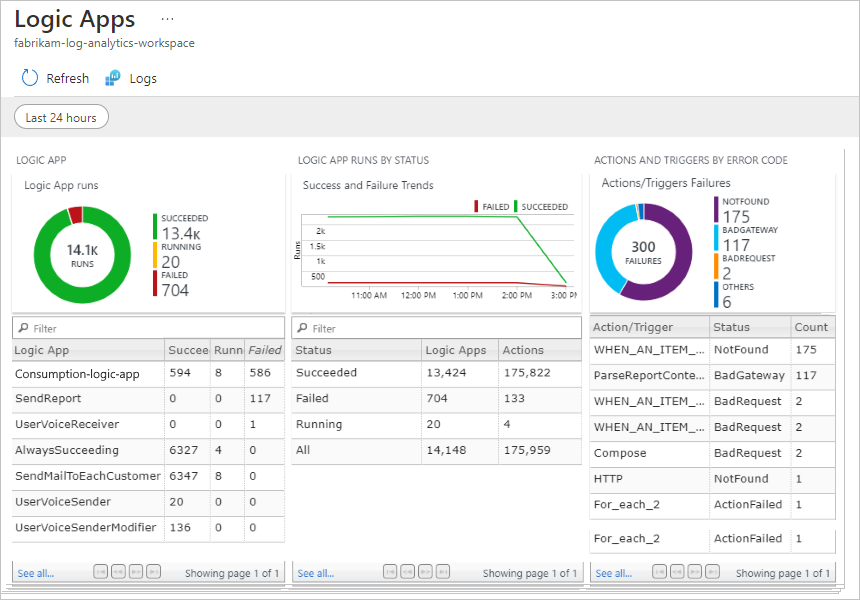
To view all the runs for a specific workflow or status, select the row for that workflow or status.
This example shows all the runs for a specific workflow:
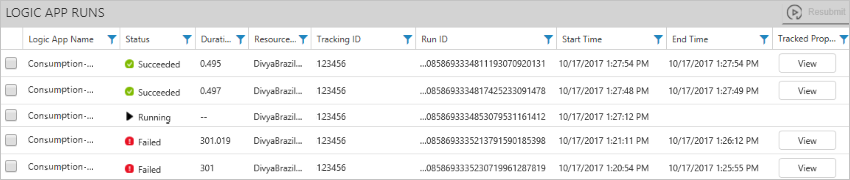
For actions where you added tracked properties, you can search for the tracked properties using the column filter. To view the properties, in the Tracked Properties column, select View.
To filter your results, you can perform both client-side and server-side filtering.
Client-side filter: For each column, select the filters that you want, for example:
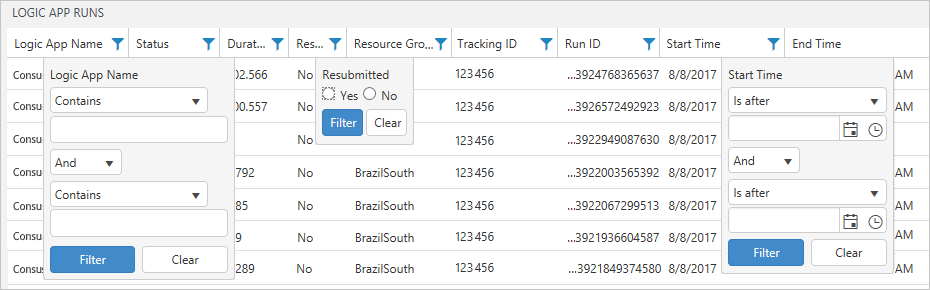
Server-side filter: To select a specific time window or to limit the number of runs that appear, use the scope control at the top of the page. By default, only 1,000 records appear at a time.
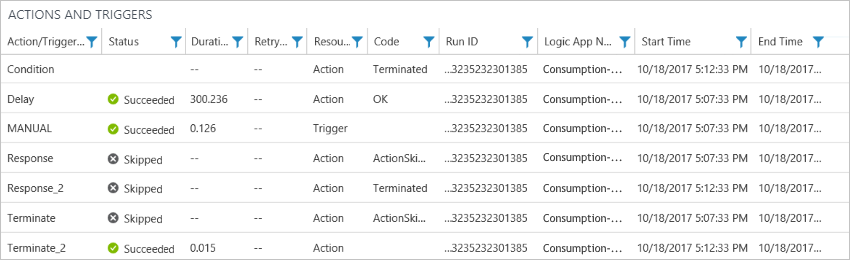
To view all the actions and their details for a specific run, select the row for a logic app workflow run.
The following example shows all the actions and triggers for a specific logic app workflow run:
Send diagnostic data to Azure Storage and Azure Event Hubs
Along with Azure Monitor Logs, you can send the collected data to other destinations, for example:
You can then get real-time monitoring by using telemetry and analytics from other services, such as Azure Stream Analytics and Power BI, for example:
- Stream data from Event Hubs to Stream Analytics
- Analyze streaming data with Stream Analytics and create a real-time analytics dashboard in Power BI
Note
Retention periods apply only when you use a storage account.
Include custom properties in telemetry
In your workflow, triggers and actions have the capability for you to add the following custom properties so that their values appear along with the emitted telemetry in your Log Analytics workspace.
Custom tracking ID
Most triggers have a Custom Tracking Id property where you can specify a tracking ID using an expression. You can use this expression to get data from the received message payload or to generate unique values, for example:
If you don't specify this custom tracking ID, Azure automatically generates this ID and correlates events across a workflow run, including any nested workflows that are called from the parent workflow. You can manually specify this ID in a trigger by passing a x-ms-client-tracking-id header with your custom ID value in the trigger request. You can use a Request trigger, HTTP trigger, or webhook-based trigger.
Tracked properties
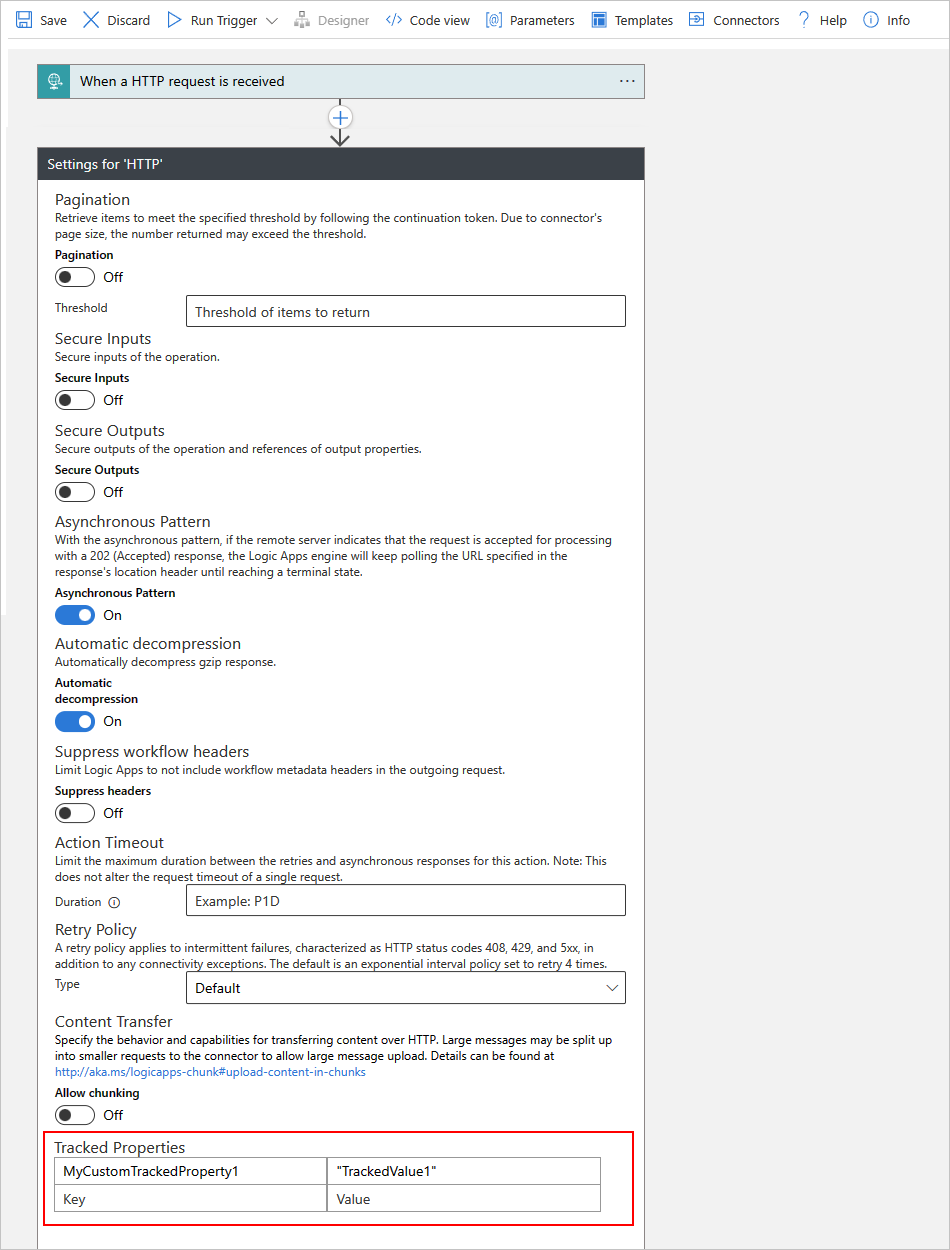
Each action has a Tracked Properties section where you can specify the name and value for a custom property by entering an expression or hardcoded value to track specific inputs or outputs that you want to emit from your workflow and include in diagnostic telemetry.
Tracked properties aren't allowed on a trigger or action that has secure inputs, secure outputs, or both. They're also not allowed to reference another trigger or action that has secure inputs, secure outputs, or both.
Tracked properties can track only a single action's inputs and outputs, but you can use the
correlationproperties of events to correlate across actions in a workflow run.Tracked properties can only reference the parameters, inputs, and outputs for its own trigger or action.
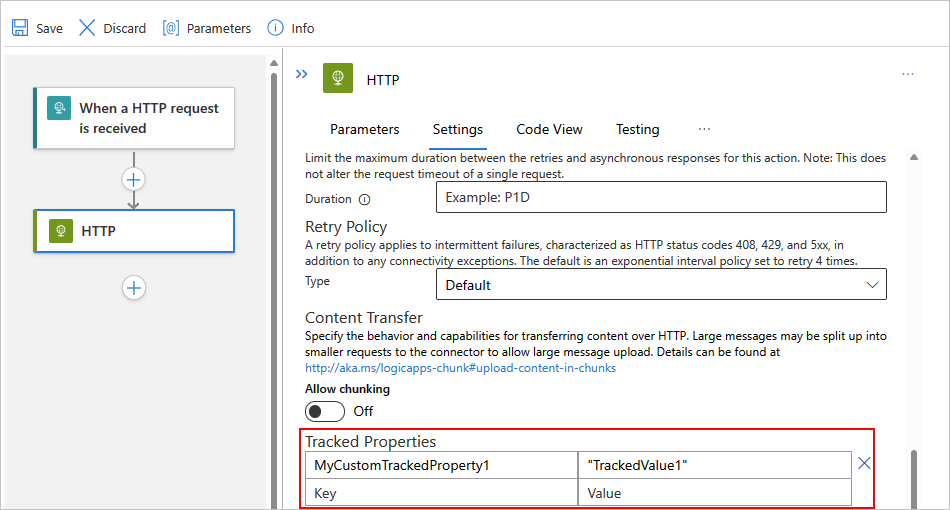
Based on whether you have a Consumption or Standard logic app workflow, the following screenshots where you can find the Tracked Properties section on an action:
In your workflow's underlying JSON definition, the JSON object is named trackedProperties and appears as a sibling to the action's type and runAfter properties, for example:
{
   "Http": {
      "inputs": {
         "method": "GET",
         "uri": "https://www.bing.com"
      },
      "runAfter": {},
      "type": "Http",
      "trackedProperties": {
         "responseCode": "@action().outputs.statusCode",
         "uri": "@action().inputs.uri"
      }
   }
}
The following examples show where custom properties appear in your Log Analytics workspace:
On your Log Analytics workspace menu, under Classic, select Workspace summary. On the Overview page, select Logic Apps Management.
Select the row for the workflow that you want to review.
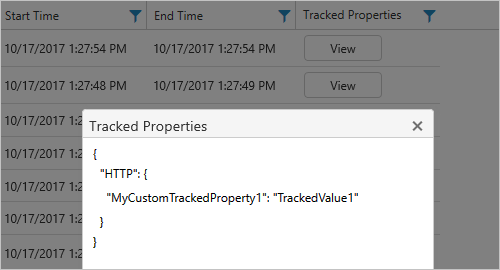
On the Runs page, in the Logic App Runs table, find the Tracking ID column and the Tracked Properties column.
To search the tracked properties, use the column filter. To view the properties, select View.
