Събитие
Световно първенство по Power BI DataViz
14.02, 16 ч. - 31.03, 16 ч.
С 4 шанса да участвате, можете да спечелите конферентен пакет и да стигнете до големия финал на ЖИВО в Лас Вегас
Научете повечеТози браузър вече не се поддържа.
Надстройте до Microsoft Edge, за да се възползвате от най-новите функции, актуализации на защитата и техническа поддръжка.
Knowing how your content is being used helps you demonstrate your impact and prioritize your efforts. Your usage metrics may show that one of your reports is used daily by a huge segment of the organization. It may show that nobody is viewing a dashboard you created at all. This type of feedback is invaluable in guiding your work efforts.
If you create reports in workspaces, you have access to improved usage metrics reports. They enable you to discover who's using those reports throughout your organization, and how they're using them. You can also identify high-level performance issues. The improved usage reports for shared workspaces replace the usage metrics reports documented in Monitor report usage metrics.

Бележка
You can only run usage metrics reports in the Power BI service. However, if you save a usage metrics report or pin it to a dashboard, you can open and interact with that report on mobile devices.
Only users with admin, member, or contributor permissions can view the usage metrics report. Viewer permissions aren't enough. If you're at least a contributor in a workspace in which your report resides, you can use the following procedure to display the usage metrics:
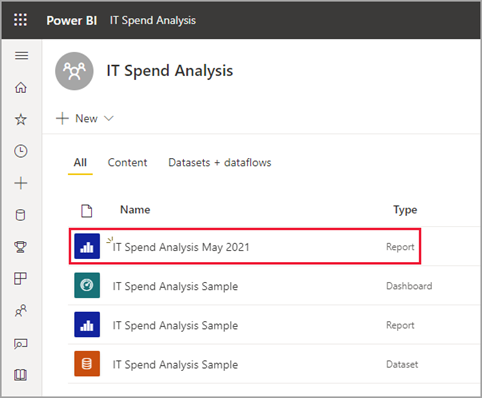
Open the workspace that contains the report for which you want to analyze the usage metrics.
From the workspace content list, select More options (...) for the report and select View usage metrics report.
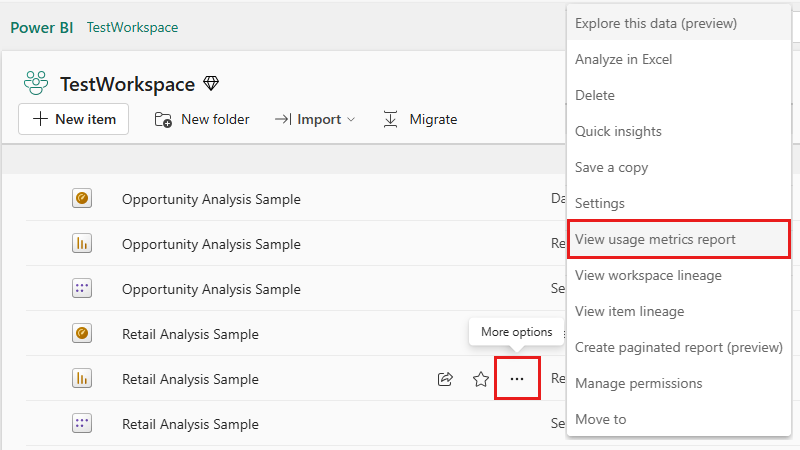
Or open the report, then on the command bar, select More options (...) > Open usage metrics.

The first time you do this, Power BI creates the usage metrics report and lets you know when it's ready.
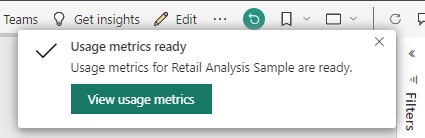
To see the results, select View usage metrics.
If this is the first time you've viewed a usage metrics report, Power BI might open the old usage metrics report. To display the improved usage metrics report, in the upper right corner, toggle the New usage report switch to On.

When you display the usage metrics report, Power BI generates a pre-built report. It contains usage metrics for that content for the last 30 days. The report looks similar to the Power BI reports you're already familiar with. You can slice based on how your end users received access, whether they accessed via the web or mobile app, and so on. As your reports evolve, so too will the usage metrics report. It updates every day with new data.
Бележка
Usage metrics reports don't show up in Recent, Workspaces, Favorites, or other content lists. They can't be added to an app. If you pin a tile from a usage metrics report to a dashboard, you can't add that dashboard to an app.
When you first launch the usage metrics report, Power BI automatically creates a Usage Metrics Report semantic model. The usage metrics report relies on that semantic model. Power BI then refreshes this semantic model daily. Although you can't change the refresh schedule, you can update the credentials that Power BI uses to refresh the usage metrics data.
You may need to resume scheduled refresh if one of the following occurs:
Бележка
While still in preview, the usage metrics semantic model may have minor changes which affect custom reports.
The improved usage metrics report includes the following report pages:
| Page | Metric | Description |
|---|---|---|
| Report usage | Report views/Report opens | A Report View is recorded each time someone opens a report and represents unique landings on the report. It answers the question, "How often is the report accessed?" This definition of a Report View differs from previous usage metrics reports. Changing report pages is no longer considered an additional Report View. Instead, changing report pages counts for the next metric, Report Page Views. Activities such as sharing and pinning are no longer considered in usage metrics. |
| Report usage | Report Page views | A Report Page View is recorded every time someone views a report page. It represents total views across any pages. It answers the question, "How often are report pages accessed?" So changing report pages counts for Report Page Views. See Considerations and Limitations for important details. |
| Report usage | Unique viewers | A viewer is someone who opened the report at least once during the time period, based on the Microsoft Entra user account. |
| Report usage | View trend | The view trend reflects view count changes over time. It compares the first half of the selected time period with the second half. |
| Report usage | Date slicer | You can change the time period on the Report usage page, such as to calculate week-over-week or biweekly trends. In the lower left corner of the Report usage page, you can set the earliest and latest date for which usage data is available for the selected report. |
| Report usage | Rank | Based on view count, the rank shows the popularity of a report in comparison to all other reports in the organization. A rank of one would mean the report has the most views of all reports in the organization. |
| Report usage | Report views per day | Usage is counted at the report level and doesn't consider Report Page Views. |
| Report usage | Report viewers per day | Total number of different users who viewed the report, based on the Microsoft Entra user account. |
| Report usage | Distribution method | How users got access to the report, such as by being members of a workspace, having the report shared with them, or installing an app. |
| Report usage | Platform slicer | If users accessed the report via the Power BI service (powerbi.com), Power BI Embedded, or a mobile device. |
| Report usage | Users with report views | Shows the list of users who opened the report sorted by view count. |
| Report usage | Pages | If the report has more than one page, slice the report by the pages that were viewed. "Blank" means either a report page was added within 24 hours of the new page appearing in the slicer list, or report pages have been deleted. "Blank" captures these types of situations. |
| Report performance | Typical opening time | The typical report opening time corresponds to the 50th percentile of the time it takes to open the report. In other words, it is the time below which 50% of the open-report actions are completed. The Report performance page also breaks down the typical report opening time by consumption method and browser type. At present, we measure the performance for the initial report load and first page viewed. The measurement starts when the report is requested and ends when the last visual completes rendering. Report interactions such as slicing, filtering, or changing pages aren't included in performance metrics. |
| Report performance | Opening time trend | The opening time trend reflects open-report performance changes over time. It compares the opening times for the report of the first half of the selected time period with the opening times of the second half. |
| Report performance | Date slicer | You can change the time period on the Report performance page, such as to calculate week-over-week or biweekly trends. In the lower left corner of the Report performance page, you can determine the earliest and latest date for which usage data is available for the selected report. |
| Report performance | Daily performance | The performance for 25%, 50%, and 75% of the open report actions calculated for each individual day. |
| Report performance | seven-day performance | The performance for 25%, 50%, and 75% of the open report actions calculated across the past seven days for each date. |
| Report performance | Consumption method | How users opened the report, such as via the Power BI service (powerbi.com), Power BI Embedded, or a mobile device. |
| Report performance | Browsers | What browser the users used to open the report, such as Firefox, Edge, and Chrome. |
| Report list | Active reports | What reports are being used across the workspace. |
| Report list | Total views | Total report opens across the workspace. |
| Report list | Total viewers | Total report viewers across the workspace. |
| Report list | View trend | The view trend reflects view count changes over time. It compares the first half of the selected time period with the second half. |
| Report list | Unused reports | Count of reports that have not been opened over time. |
| Report list | Report usage (table) | Shows which reports contribute to individual counts shown in cards. Shows report open percentages, users interacting with report, viewing trends and days. |
| Report list | Distribution method | How users got access to the report, such as being members of a workspace, having the report shared with them, or installing an app. |
| Report list | Platform slicer | If the report was accessed via the Power BI service (powerbi.com), Power BI Embedded, or a mobile device. |
| Report list | Unique viewers | A viewer is someone who opened the report at least once during the time period (based on the Microsoft Entra user account). Shows number of report opens by individual viewers. |
Suppose we have four reports that are accessed by three users as follows:
| Report Name | Usage Pattern |
|---|---|
| KPI Report |
|
| HR Report |
|
| Finance Report |
|
| Sales Report |
|
Assuming all client telemetry reaches Power BI, the resulting metrics would be:
| Report Name | Report Views | Report Page Views | Viewers |
|---|---|---|---|
| KPI Report | 1 | 1 | 1 |
| HR Report | 1 | 5 | 1 |
| Finance Report | 3 | 5 | 3 |
| Sales Report | 3 | 4 | 2 |
If semantic model owners in your workspace leave, are no longer a part of your organization, or if the credentials expire, the semantic models may become stale and refreshes may fail. In such cases, you can use the following procedure to take over a Usage Metrics Report semantic model and update the credentials.
Бележка
Updating credentials doesn't apply to My Workspace, because each user owns their own My Workspace, and they never need to transfer ownership of the semantic model.
Open the workspace that contains the report for which you want to update the Usage Metrics Report semantic model.
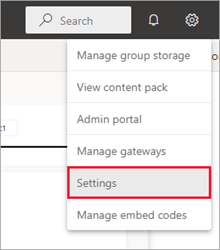
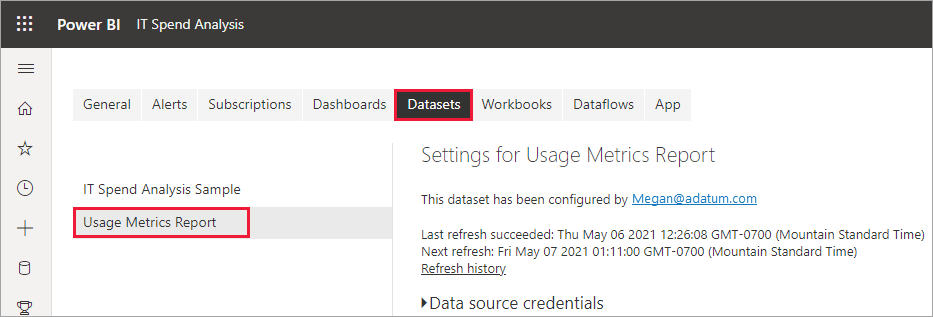
In the gray header bar at the top, select the Settings icon, then select Settings.
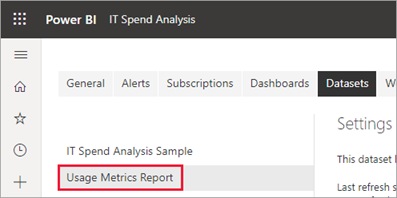
Switch to the Semantic models tab.
Select the Usage Metrics Report semantic model.
If you aren't the current semantic model owner, you must take over ownership before you can update the data source credentials.
Select the Take over button, then in the Take over semantic model settings dialog box, select Take over again.
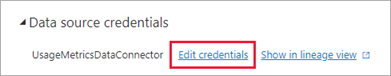
Under Data source credentials, select Edit credentials.
In the Configure Usage Metrics Report dialog box, select Sign in.
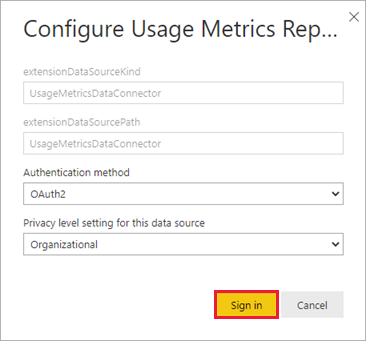
Complete the sign-in sequence and note the notification that the data source was updated successfully.
Бележка
The Usage Metrics Report semantic model contains usage data for the last 30 days. It can take up to 24 hours for new usage data to be imported. You can't trigger a manual refresh by using the Power BI user interface.
Usage metrics reports are a feature that the Power BI administrator can turn on or off. Administrators have granular control over which users have access to usage metrics; they're On by default for all users in the organization. See Audit and usage metrics in the Admin portal article for details on these settings.
Бележка
Only admins for the Power BI tenant can see the Admin portal and edit settings.
By default, per-user data is enabled for usage metrics. This means content consumer account information such as user name and email address is included in the usage metrics report. Admins can limit exposure of identifying user information in the Power BI admin portal tenant settings. They can enable per-user data for the entire organization or specified security groups.
Бележка
An embed scenario with excluded user information isn't supported. In such cases, usage metrics semantic model refresh will fail.
If user information is excluded, the usage report refers to users as 'Unnamed User [unique_id]', where [unique_id] is a meaningless unique identifier assigned to support distinct user count measures.
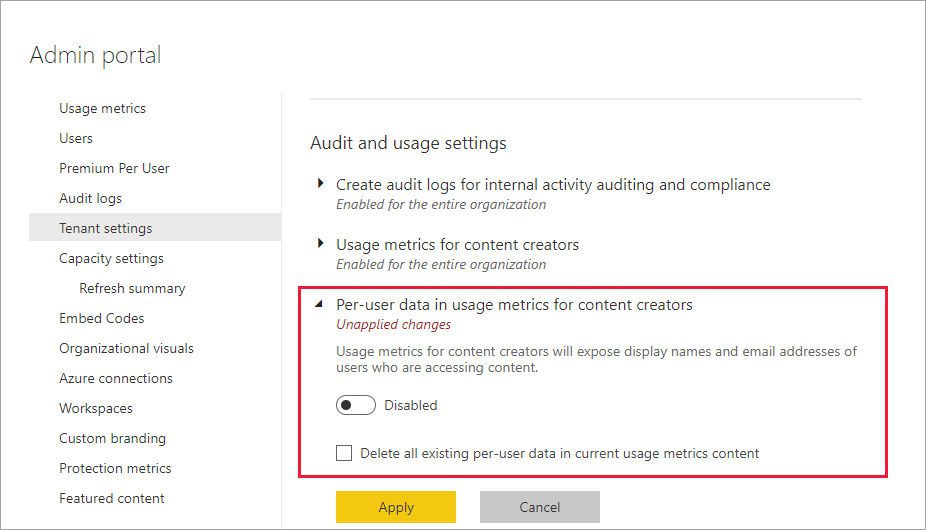
On the Tenant settings tab in the admin portal, under Audit and usage settings, expand Per-user data in metrics for content creators and select Disabled. This will hide user account information for all users.
Decide whether to Delete all existing per-user data in current usage metrics content. Select Apply.
When admins disable usage metrics for their entire organization, they can use the Delete all existing usage metrics content option to delete all existing reports and dashboard tiles that were built using the usage metrics reports. This option removes all access to usage metrics data for all users in the organization who may already be using it. Deleting existing usage metrics content is irreversible.
Бележка
Only admins for the Power BI tenant can see the Admin portal and configure the Per-user data in usage metrics for content creators setting.
To dig into the report data, or to build your own reports against the underlying semantic model, you have several options:
When you create a copy of the read-only, pre-built usage report, Power BI creates an editable instance of the report. At first glance, it looks the same. However, you can now open the report in Editing view, add new visualizations, filters, and pages, modify or delete existing visualizations, and so on. Power BI saves the new report in the current workspace.
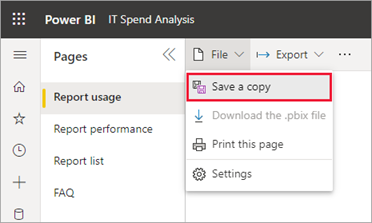
In the usage metrics report, select the File dropdown, then select Save a copy.
In the Save your report dialog box, enter a name, then select Save.
Power BI creates an editable Power BI report saved in the current workspace. Select Go to report in the Report saved dialog box that appears.
Select Edit to switch into Editing view.
From here you can change filters, add new pages, build new visualizations, format the fonts and colors, and so on.
The new report is saved to the All tab and the Content tab in the current workspace and added to the Recent list.
Бележка
When you save a copy of the usage metrics report:
To remove pseudo-duplicates from the Usage Report, you can add a Report views measure to filter them out.
Under Model measures, expand Views, and add Report views to the Filters pane.

You can create a usage report in Power BI Desktop, based on the Usage Metrics Report semantic model. To establish a connection to the Usage Metrics Report semantic model and create your own report, you have to be signed in to the Power BI service in Power BI Desktop.
Open Power BI Desktop.
If you aren't signed in to the Power BI service, on the File menu select Sign in.
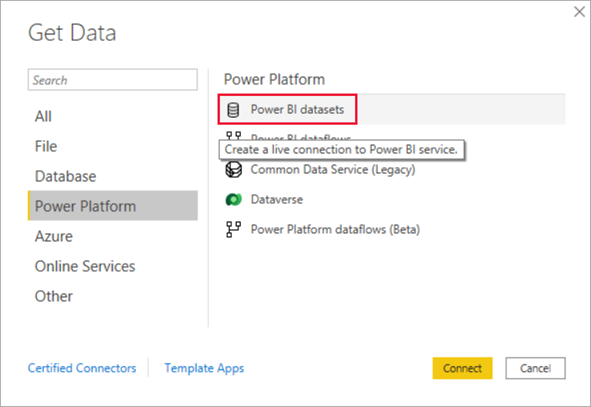
To connect to the Usage Metrics Report semantic model, on the Home ribbon select Get Data > More.
In the left pane, select Power Platform, then select Power BI semantic models > Connect.
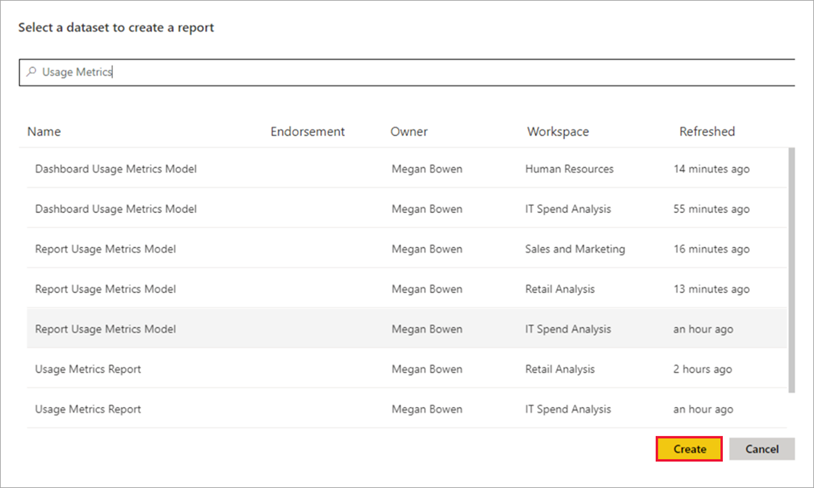
Scroll to the desired semantic model or type Usage Metrics in the search box.
Verify in the Workspace column that you're selecting the correct semantic model, then select Create.
Check the Fields list in Power BI Desktop, which gives you access to the tables, columns, and measures in the selected semantic model.
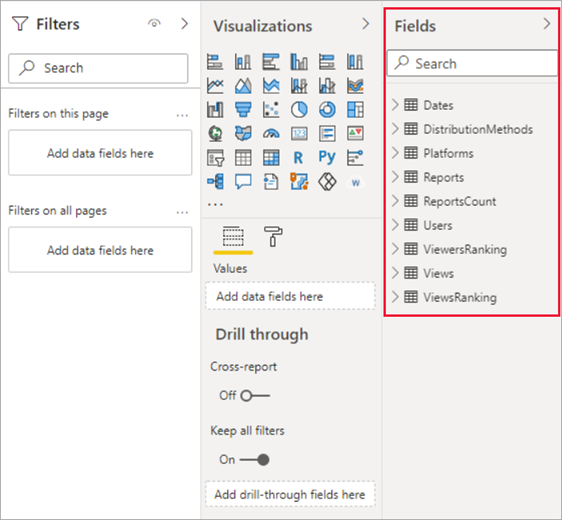
Now you can create and share custom usage reports, all from the same Usage Metrics Report semantic model.
Бележка
When you create a usage metrics report, it's built on the original semantic model. If there are any changes from Power BI, this may break your copy of the report.
When you connect to the usage data in Excel, you can create PivotTables that use the pre-defined measures. Note that Excel PivotTables do not support drag-and-drop aggregation of numeric fields when connecting to a Power BI semantic model.
First, if you haven't done so already, create a copy of the usage metrics report.
Open the usage metrics report, select Export > Analyze in Excel.

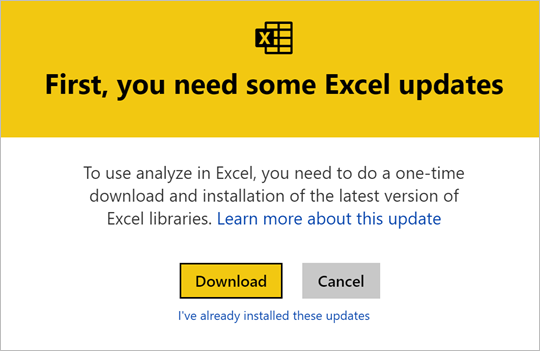
If you see the First, you need some Excel updates dialog box, select Download and install the latest updates for Power BI connectivity. Otherwise, select I've already installed these updates.
Бележка
Some organizations may have Group Policy rules that prevent installing the required Analyze in Excel updates to Excel. If you can't install the updates, check with your administrator.
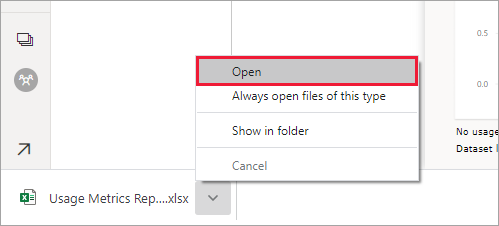
In the browser dialog asking what you want to do with the Usage Metrics report.odc file, select Open.
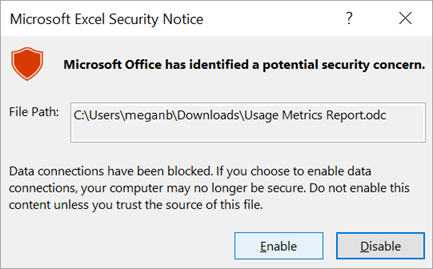
Power BI launches Excel. Verify the file name and path for the .odc file, then select Enable.
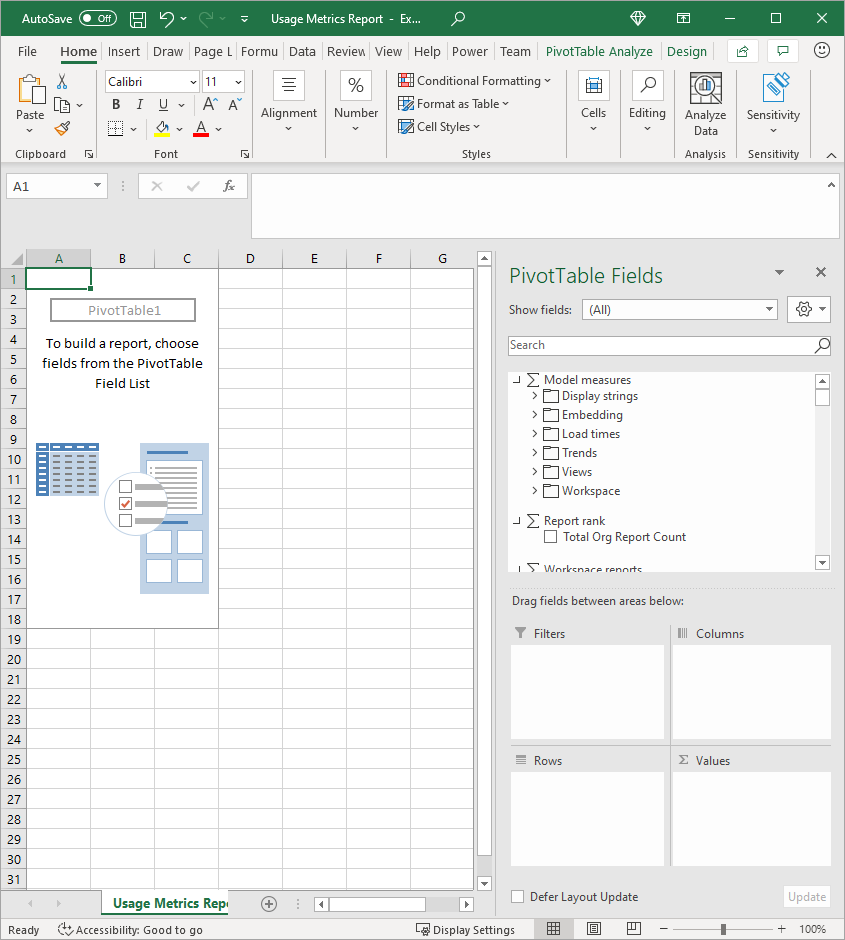
Now that Excel has opened and you have an empty PivotTable, you can drag fields onto the Rows, Columns, Filters, and Values boxes and create custom views into your usage data.
Power BI is available in separate national/regional clouds. These clouds offer the same levels of security, privacy, compliance, and transparency as the global version of Power BI, combined with a unique model for local regulations on service delivery, data residency, access, and control. Usage metrics are currently available in following national/regional clouds:
For more information, see national/regional clouds.
It's important to understand that differences can occur when comparing the improved usage metrics report with its predecessor. Particularly Report View metrics are now based on activity data collected from the Power BI service. Previous versions of the usage metrics report relied only on client telemetry, which doesn't always match usage metrics collected from the service. Moreover, the improved usage metrics report uses a different definition for a "Report View." A Report View is an open-report event, as recorded in the service each time someone opens a report. Changing report pages is no longer considered an additional Report View. We now include a Report Page View metric, which specifically counts every page view.
Бележка
Report Page Views rely on client telemetry and can be affected by undercounting and overcounting of activities due to inconsistent network connections, ad blockers, or other client-side issues. Report View metrics relies on activity data collected from Power BI service, and matches the aggregate counts of activities in audit logs and activity logs.
In addition to the above differences between previous and improved usage metrics reports, note the following limitations for the preview release:
Dashboard usage metrics still rely on the previous version of the usage metrics reports and aren't yet available in modern usage metrics.
There are fields in the Report page views and Report load times tables that are always blank.
Pages for App reports can't be seen in the Report pages table.
Performance data and Report Page View metrics rely on the client/device sending data to Power BI. Depending on network latency, ad blockers, firewalls, and network rules set by your organization, this data may never reach Power BI. Therefore, the performance and Report Page View data may not include all views or all users.
Certain types of views aren't included in performance measurements. For example, when a user selects a link to a report in an email message, the Report View is accounted for in the report usage but there is no event in the performance metrics.
Report performance metrics aren't available for Paginated Reports. The Pages tab on the Report usage page as well as the charts on the Report performance page don't show data for these types of reports.
User masking isn't working as expected when using nested groups. Nested groups (subgroups) are groups that are members of existing groups. If your organization has disabled Per-user data in usage metrics for content creators in the Power BI admin portal tenant settings, only the members on the top level are being masked. Members of subgroups are still visible.
If you're using user masking in an embed scenario in your report, the usage metrics semantic model refresh will fail.
Initializing the Usage Metrics Report semantic model might take a few minutes, resulting in showing a blank usage metrics report because the Power BI user interface does not wait for the refresh to finish. Check the refresh history in the Usage Metrics Report semantic model settings to verify that the refresh operation succeeded.
Initializing the Usage Metrics Report semantic model might fail due to a timeout encountered during refresh. Refer to the Troubleshooting section below to resolve this or any general refresh issue.
Sharing is disabled for the usage metrics report. To give people read access to the report, open the report and use the Manage permissions option to grant direct access.
In some scenarios, you may notice the performance data is missing. This can occur if a user opens a report and interacts with the report before it has completed loading or if an error occurred during the report load.
If your organization is using Azure Private Link in Power BI, because client-telemetry is not available the usage metrics reports will only contain Report Open events.
If your organization is using Azure Private Link and Block Public Internet Access in Power BI, the refresh for the semantic model will fail and the usage metrics report won't show any data.
In order to create and refresh the usage metrics report, the user is required to authenticate to enable the backend API calls to extract the tenant telemetry. For privacy reasons, guest users aren't allowed this authentication. This authentication is only allowed for members of the tenant.
Duplicate reports with different Report ObjectIds in the usage metrics report can show up for the following scenarios:
Бележка
Both GUID and ObjectsIDs may be used interchangeably. Each Report ObjectId is uniquely represented by a 32 hexadecimal GUID (a globally unique identifier).
The usage metrics report is not supported in My Workspace.
During the process of disaster recovery (while Business continuity and disaster recovery (BCDR) is in progress) any new incoming data experiencing data loss may be irrecoverable.
Certain metrics in usage metrics report aren't included in audit logs. For example, report page views aren't part of audit logs.
When a report is deleted, the ReportIds can show up in the usage metrics but not be available in the Reports semantic model.
Customers may be unable to view or download the usage metrics semantic model from Power BI service.
To access the user metrics report's semantic model settings and refresh history, follow the steps in Update usage metrics report credentials.
The report views count is influenced by subscriptions running on the reports. When the subscription service captures a snapshot of the report for emails, it triggers a flow that logs a ViewReport event.
In addition to the above considerations and limitations, the following questions and answers about usage metrics might be helpful for users and administrators.
Report Views rely on server telemetry that is generated when the report is first opened. Once a report is open, its page definitions are already loaded onto the user's device. Report Page Views rely on usage information from the user's device reaching Power BI. This can sometimes be blocked, as described in Considerations and Limitations.
You can only see usage metrics for reports you own or have permissions to edit.
The usage report is based on activity data for the last 30 days, excluding activities of the current day. You can narrow the time period by using the Date slicer on the Report usage page, such as to analyze only last week's data.
The usage report includes activity data up until the last complete day based on the UTC time zone. The data shown in the report is also dependent on the refresh time for the semantic model. Power BI refreshes the semantic model once per day.
Note that it might take up to 24 hours for new activity data to appear in the usage report.
The Usage Metrics Report semantic model imports data from a Power BI internal usage metrics store by using a custom Usage Metrics Data Connector. You can update the credentials for the Usage Metrics Data Connector on the Usage Metrics Report semantic model settings page.
You can create a copy of the read-only, pre-built usage report. The report copy connects to the same Usage Metrics Report semantic model and enables you to edit the report details.
A viewer is someone who opened the report at least once during the time period. A view is an open-report event. A report view is recorded each time someone opens a report. Note that the definition of a view differs from previous usage metrics reports. Changing report pages is no longer considered an additional view.
The view trend reflects view count changes over time. It compares the first half of the selected time period with the second half. You can change the time period by using the Date slicer on the Report usage page, such as to calculate week-over-week or biweekly trends.
Distribution shows how the viewers obtained access to a report: shared directly, through workspace access, or through an app. The Platform indicates the technology a viewer used to open a report: via PowerBI.com, Mobile, or Embedded.
Based on view count, the rank shows the popularity of a report in comparison to all other reports in the organization. A rank of 1 would mean the report has the most views of all reports in the organization.
Your organization can decide to exclude user information from your usage report. If excluded, the usage report refers to users as Unnamed.
The typical report opening time corresponds to the 50th percentile of the time it takes to open the report. In other words, it is the time below which 50% of the open-report actions are completed. The Report performance page also breaks down the typical report opening time by consumption method, and browser type.
The opening time trend reflects open-report performance changes over time. It compares the opening times for the report of the first half of the selected time period with the opening times of the second half. You can change the time period by using the Date slicer on the Report performance page, such as to calculate week-over-week or biweekly trends.
The improved usage metrics report only includes reports that have been opened in the past 30 days, while the previous version covers the past 90 days. You can update it to cover only the past 30 days, if you want. If a report isn't included in the improved usage metrics report, it likely hasn't been used in more than 30 days.
If you suspect data consistency or refresh issues, it might make sense to delete the existing Usage Metrics Report semantic model. Then you can run View Usage Metrics again to generate a new semantic model with its associated usage metrics reports.
Бележка
You can create a Power Automate flow to perform a refresh that can force the Report Usage model to reload data. When using this option, some refresh issues may not get resolved. For example, if an older version is in the workspace.
Follow these steps to delete the semantic model and then create a fresh data refresh report.
Open the workspace that contains the report for which you want to reset the Usage Metrics Report semantic model.
In the black header bar at the top, select the Settings icon, then select Settings.
Switch to the Semantic models tab, and select the Usage Metrics Report semantic model.
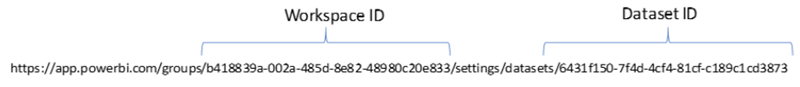
Copy the workspace and semantic model IDs from the URL displayed in the address bar of your browser.
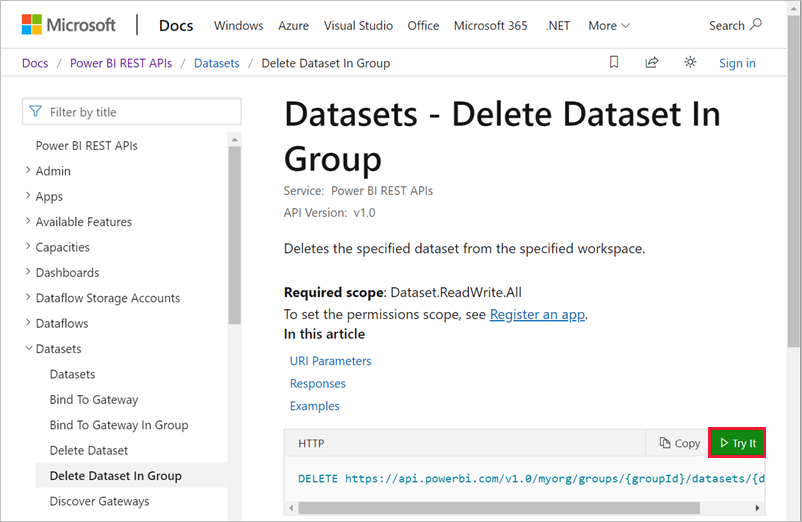
In your browser, go to Semantic models - Delete Semantic model In Group, and select the Try It button.
Бележка
This Try it button does not apply to GCC customers since their API endpoint is different.
You can use this API to delete the semantic model. You can use API tools to make an API call on this endpoint to delete the semantic model.
If you don't see a Try it button, use the trigger Scheduled cloud flow. Select a starting time and run it every hour. Then refresh the semantic model. Let the flow run once, then switch off the flow. Read more about cloud flows in Power Automate.
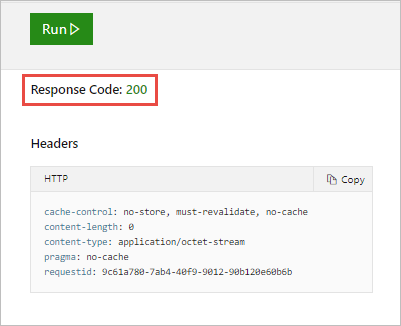
Sign in to Power BI, paste the Workspace ID in the groupId text box and the semantic model ID into the datasetId text box, and then select Run.
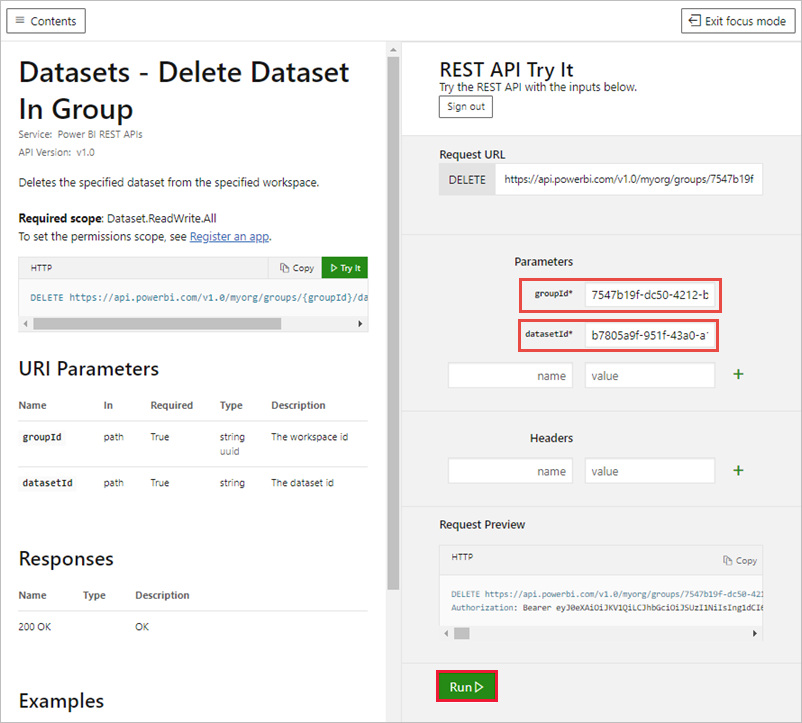
Under the Run button, verify that the service returns a Response Code of 200. That code indicates that you have successfully deleted the semantic model and its associated usage metrics reports.
Back in the Power BI service, you see the semantic model is gone.
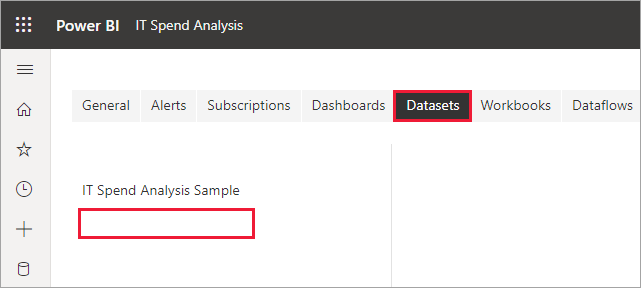
If you still see the Usage Metrics report in the Reports list, refresh your browser.
Start over and create a fresh usage metrics report.
More questions? Try the Power BI Community
Събитие
Световно първенство по Power BI DataViz
14.02, 16 ч. - 31.03, 16 ч.
С 4 шанса да участвате, можете да спечелите конферентен пакет и да стигнете до големия финал на ЖИВО в Лас Вегас
Научете повечеОбучение
Пътека за обучение
Use advance techniques in canvas apps to perform custom updates and optimization - Training
Use advance techniques in canvas apps to perform custom updates and optimization
Документация
Monitor report usage metrics - Power BI
How to view, save, and use usage metrics for Power BI dashboards and reports.
Audit and usage admin settings - Microsoft Fabric
Learn how to configure Fabric audit and usage admin settings.
Get full insights into Power BI activity, usage, and performance by integrating with Azure Log Analytics.