Bilješka
Pristup ovoj stranici zahtijeva provjeru vjerodostojnosti. Možete pokušati da se prijavite ili promijenite direktorije.
Pristup ovoj stranici zahtijeva provjeru vjerodostojnosti. Možete pokušati promijeniti direktorije.
The Upgrade Dashboard provides a visual view of a GitHub Copilot upgrade session. The user interface labels the panel Code Upgrade. Use the dashboard to:
- Track task progress and failures in real time.
- Review assessment results and mandatory issues.
- Inspect NuGet package compatibility.
- Check the upgrade strategy and settings.
- Publish the assessment as a private GitHub gist for team review.
In the GitHub Copilot app for desktop, the dashboard opens as a side panel. In other environments, such as the GitHub Copilot CLI or an IDE, it opens in your browser.
Open the dashboard
When you start an upgrade session, Copilot might open the dashboard automatically. If the dashboard doesn't open, ask Copilot to show it in your initial prompt or during an active upgrade session.
Example prompts:
- "Show the upgrade dashboard."
- "Upgrade my solution to .NET 10 and show the dashboard."
The dashboard opens in the side panel or browser, depending on which GitHub Copilot client you use.
Explore the dashboard
Use the eight tabs in the top navigation bar to inspect different parts of the upgrade. The header displays overall task progress on every tab.
| Tab | Purpose |
|---|---|
| Overview | Summarizes the upgrade session. |
| Scenario | Shows the active scenario and its phases. |
| Tasks | Tracks the upgrade plan and individual tasks. |
| Projects | Lists projects, target frameworks, and assessment incidents. |
| Dependencies | Reports package and reference compatibility. |
| Assessment | Presents codebase assessment results. |
| Options | Shows the current upgrade strategy and settings. |
| Activity | Records file changes, commits, and build events. |
Overview tab
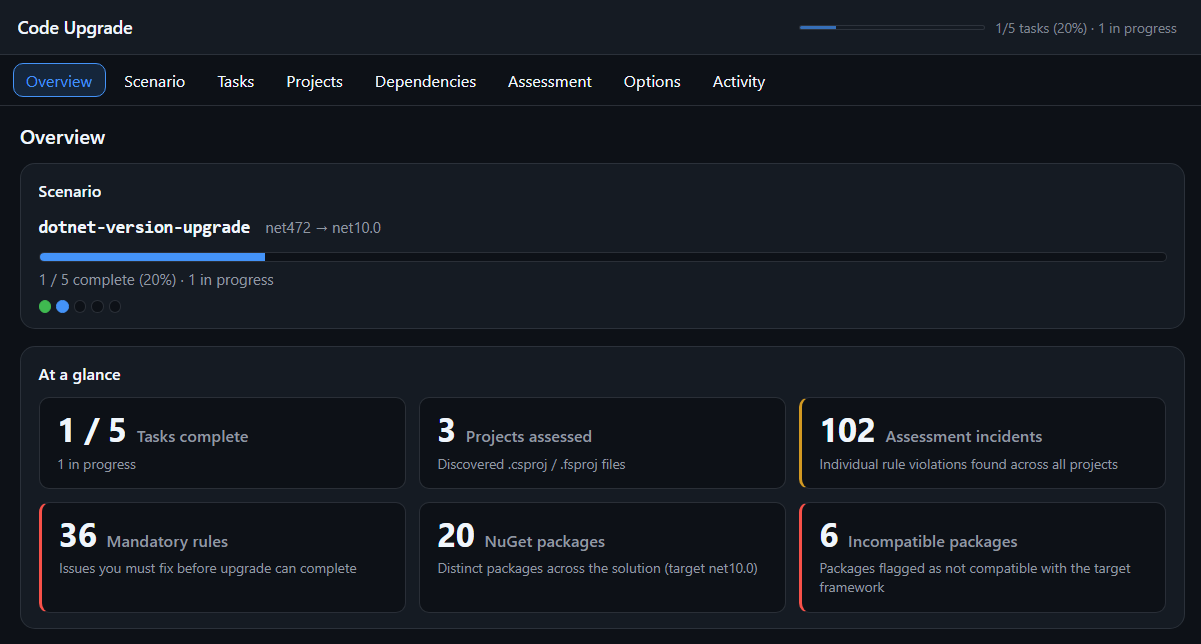
The Overview tab opens by default and summarizes the upgrade session. The scenario card shows:
- The scenario name, such as
dotnet-version-upgrade. - The current and target target framework monikers (TFMs), such as
net472andnet10.0. - Overall progress.
- Completed and active phases.
The At a glance section displays these statistics:
- Tasks complete: Completed tasks, total tasks, and tasks in progress.
- Projects assessed: The number of project files discovered in the repository.
- Assessment incidents: Individual rule violations across all projects.
- Mandatory rules: Issues that the agent must resolve before it can complete the upgrade.
- NuGet packages: Distinct packages in the solution that the agent analyzes against the target framework.
- Incompatible packages: Packages that don't support the target framework.
Scenario tab
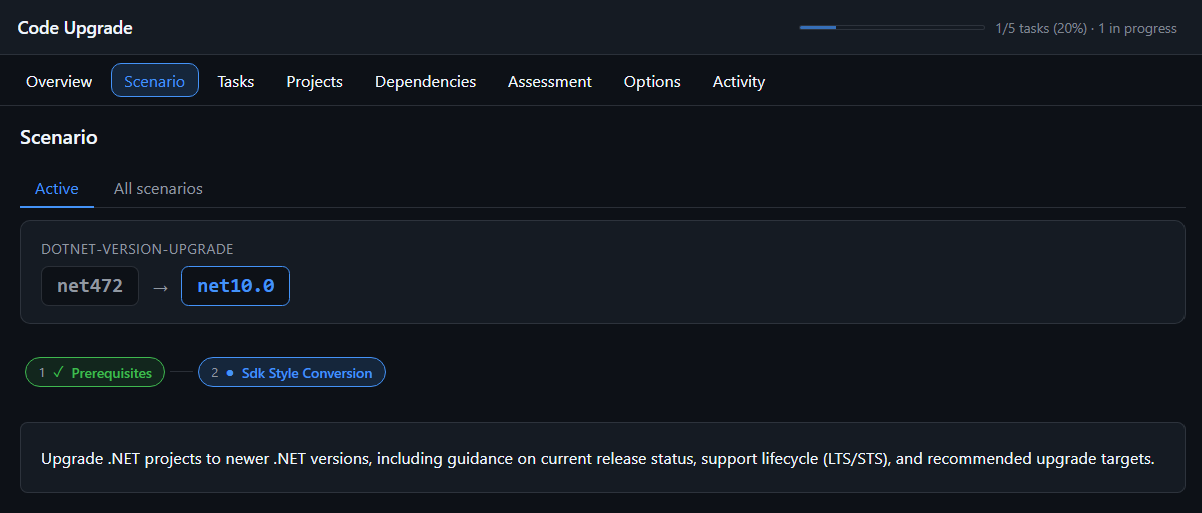
The Scenario tab lists the active scenario and all scenarios available for the repository. Use the Active and All scenarios subtabs to switch between these views.
The Active subtab shows the scenario ID, such as DOTNET-VERSION-UPGRADE, and the TFM transition, such as net472 to net10.0. It also describes the scenario's purpose and approach.
The phase pipeline shows the status of each upgrade phase. A check mark identifies a completed phase, and a dot identifies the current phase.
Tasks tab
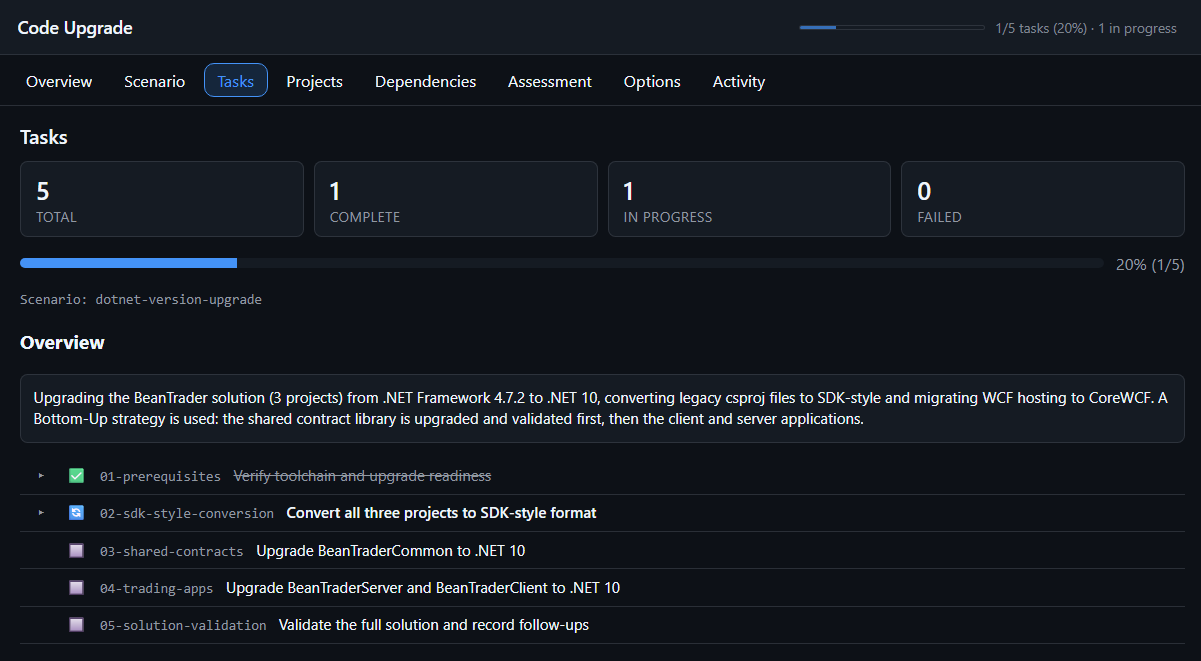
The Tasks tab shows the upgrade plan and every task in the current scenario. Summary tiles report total, complete, in-progress, and failed task counts. A progress bar reports the completion percentage and identifies the scenario.
The Overview section explains the upgrade strategy, including project order and sequence. Below the overview, a numbered, hierarchical list uses icons and text styles to identify task status:
- Check mark: Complete. The dashboard crosses out the task label.
- Spinner: In progress. The dashboard displays the task label in bold.
- Square: Pending.
Projects tab
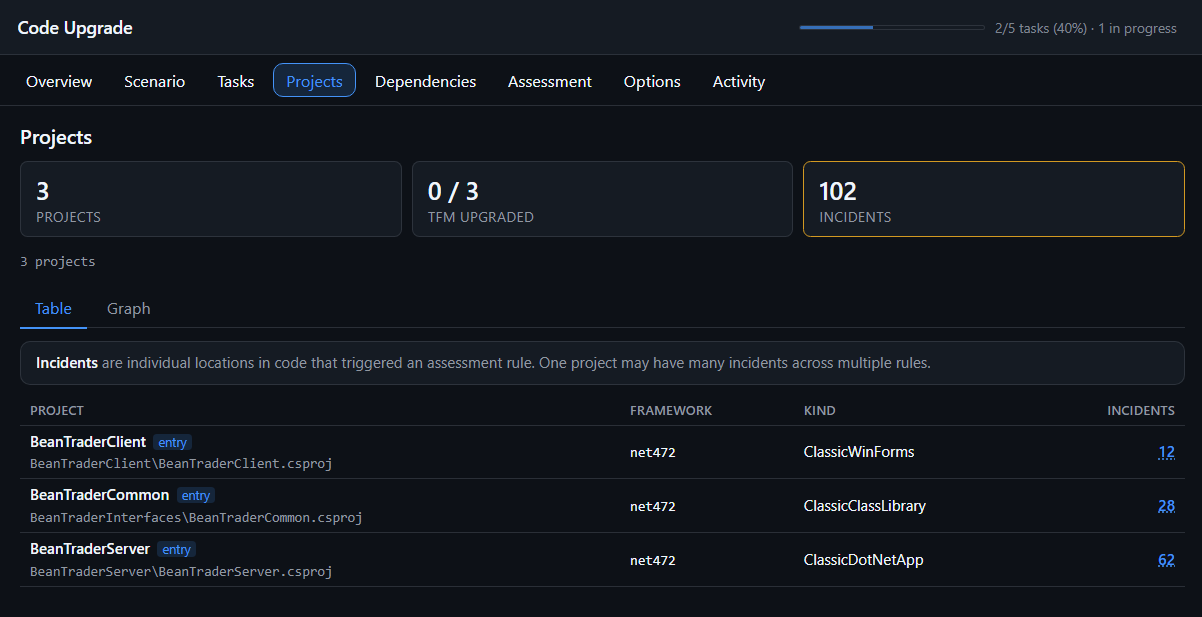
The Projects tab lists each .csproj and .fsproj file in the repository with its assessment data. Summary tiles report the total projects, upgraded TFMs, and assessment incidents.
An incident represents one code location that triggered an assessment rule. Select an incident count to inspect the issues for that project.
Use Table or Graph to change the view. The table includes these columns:
- Project: The project name and file path.
- Framework: The current target framework.
- Kind: The project type, such as
ClassicWinFormsorClassicClassLibrary. - Incidents: The incident count.
The graph displays projects as nodes and project references as connections.
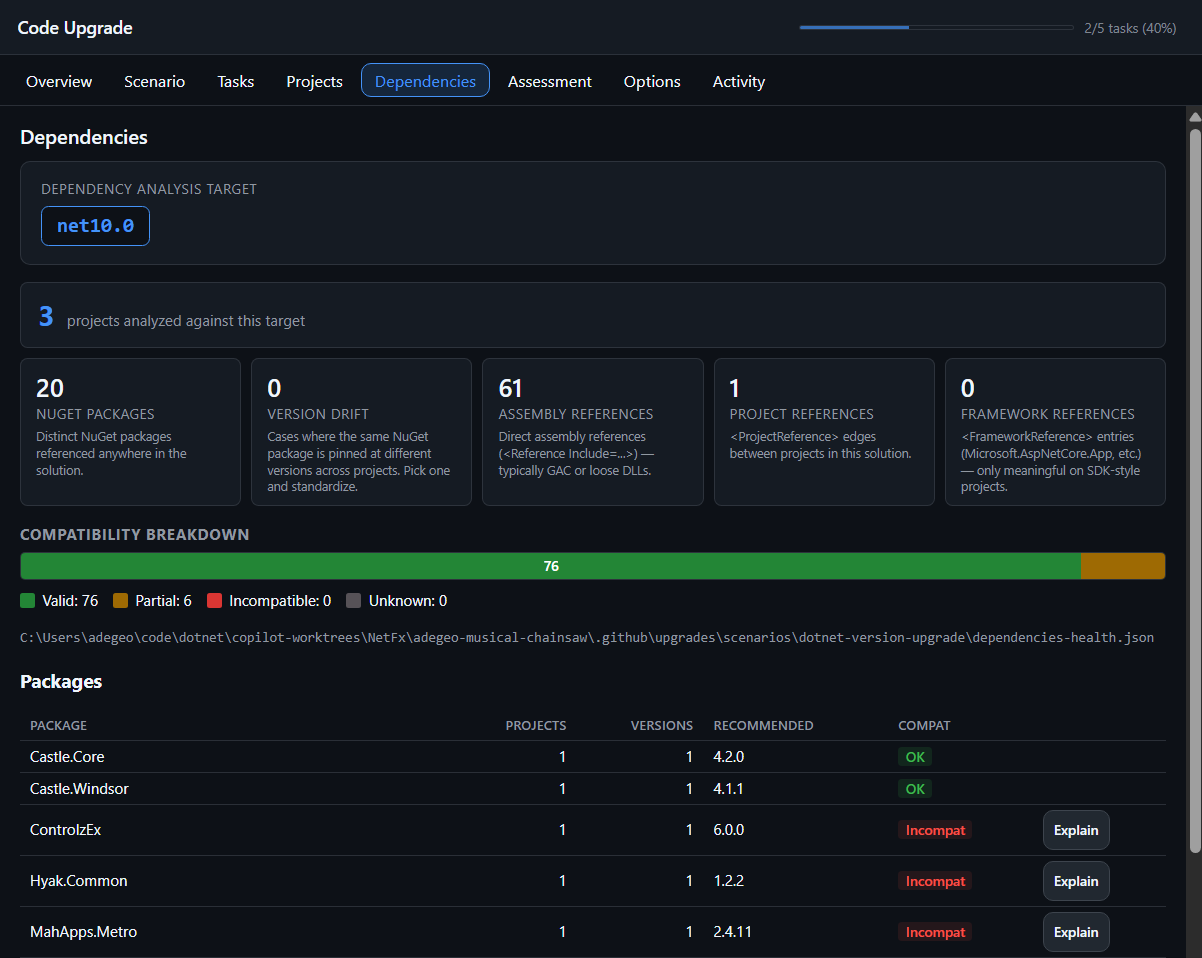
Dependencies tab
The Dependencies tab reports whether the solution's NuGet packages and references support the target framework. The Dependency Analysis Target card identifies the target TFM and the number of analyzed projects.
Summary tiles report these dependency types and conditions:
- NuGet packages: Distinct NuGet packages in the solution.
- Version drift: Packages that use different versions across projects.
- Assembly references: Direct references, such as Global Assembly Cache (GAC) assemblies or separate DLL files.
- Project references:
<ProjectReference>relationships between projects. - Framework references:
<FrameworkReference>entries in SDK-style projects, such asMicrosoft.AspNetCore.App.
A compatibility bar groups packages as Valid, Partial, Incompatible, or Unknown. The dashboard displays the source dependencies-health.json path below the bar.
The package table lists package names, projects, installed versions, recommended versions, and compatibility. For an incompatible package, select Explain to ask the agent for details in the chat.
Assessment tab
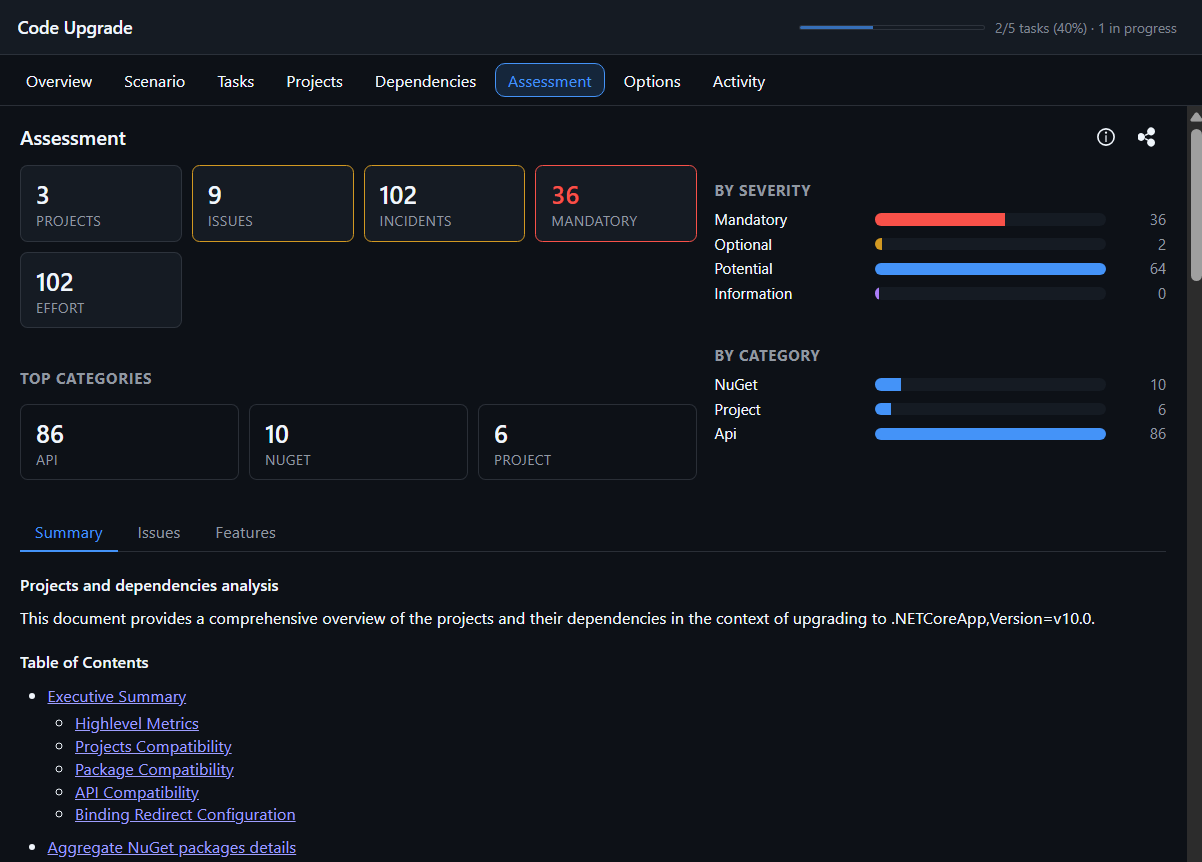
The Assessment tab reports codebase compatibility with the target framework. Summary tiles show project, issue, incident, mandatory issue, and effort totals. Category tiles identify the three largest incident groups.
Two bar charts group incidents:
- By severity: Groups incidents as mandatory, optional, potential, or informational.
- By category: Groups incidents by areas such as API, NuGet, and project configuration.
Use the Summary, Issues, and Features subtabs to change the level of detail. Summary provides a narrative report about project, package, and API compatibility. Issues and Features provide individual breakdowns.
To view the assessment date and version, select the Info icon. To publish the assessment as a private GitHub gist, select the Share icon.
Options tab
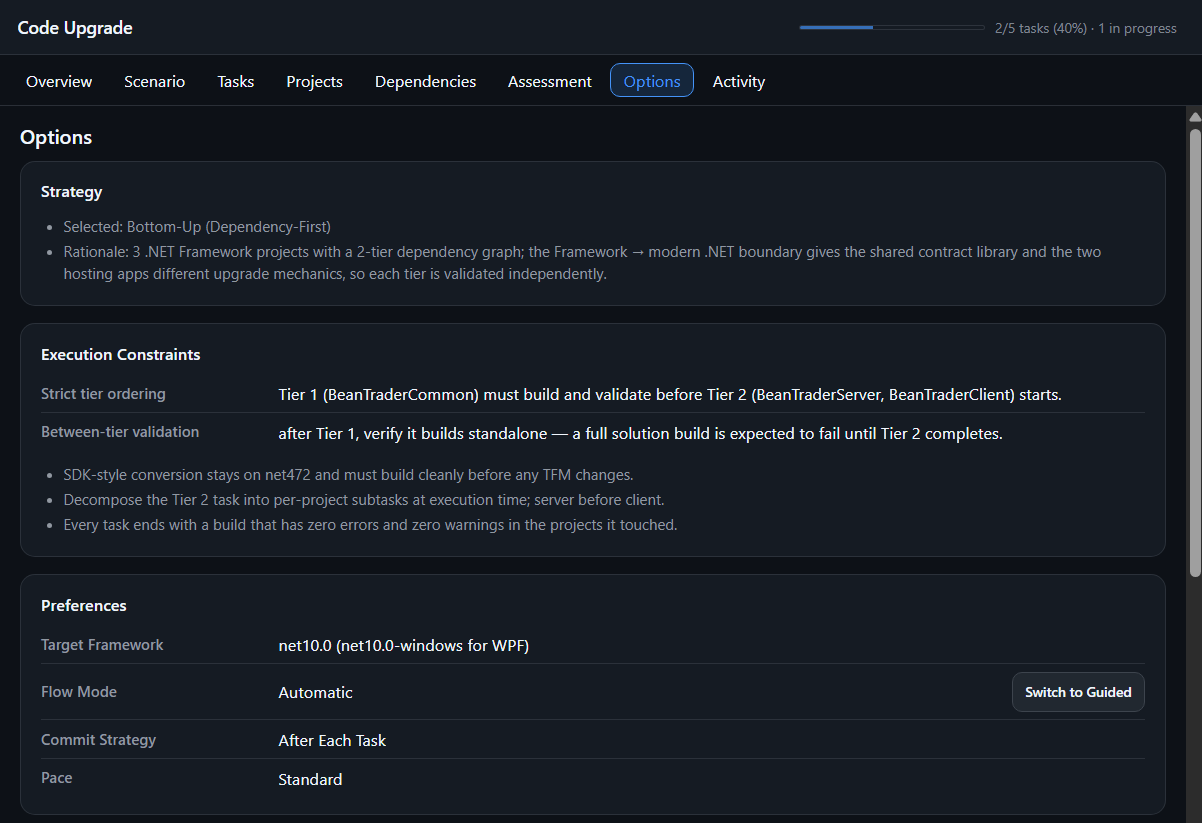
The Options tab shows the current upgrade configuration. Most settings are read-only, but the tab provides a control to change the flow mode. To change other supported preferences, ask the agent in the chat.
The tab contains three sections:
- Strategy shows the selected strategy, such as Bottom-Up (Dependency-First). It also explains why the agent chose that strategy for the solution.
- Execution constraints lists rules such as tier order, validation between tiers, and other execution requirements.
- Preferences lists the target framework, flow mode, commit strategy, and pace.
For Flow mode, select Switch to Guided or Switch to Automatic. The dashboard sends the request to the agent.
The target framework might include a platform suffix. For example, a WPF application might target net10.0-windows instead of net10.0.
Activity tab
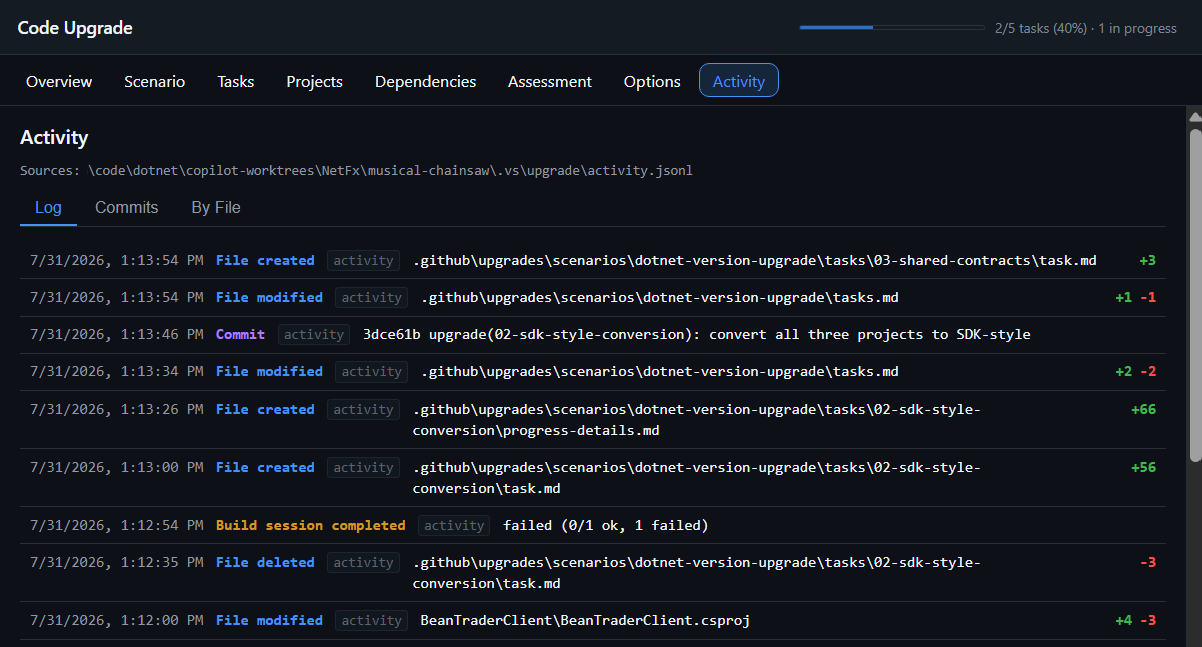
The Activity tab provides a timestamped log of agent actions. During an active session, the log updates in real time and places new events at the top. The panel also displays the source activity.jsonl path.
Use the Log, Commits, and By file subtabs to review activity. Each log entry includes:
- Timestamp: The date and time the event occurred.
- Event type: The action, such as a file change, commit, or completed build session.
- Details: The associated file path or commit message.
- Line diff: The number of lines added or removed in a file event.
Limitations
- Access the dashboard only through the GitHub Copilot app for desktop or the GitHub Copilot CLI.
- Change supported preferences through the agent chat or controls on the Options tab. The dashboard doesn't provide direct access to other session settings.
- Start an upgrade session before you expect the dashboard to show data. A repository without upgrade artifacts displays an empty state.
- Keep the agent active for live updates on the Activity tab. A completed or stopped session displays only historical events.
Related content
Sarađujte s nama na GitHub-u
Izvor za ovaj sadržaj može se naći na usluzi GitHub, gdje takođe možete da kreirate i pregledate probleme i povučete zahtjeve. Za više informacija pogledajte naš vodič za saradnike.