User retention analysis for web applications with Application Insights
The retention feature in Application Insights helps you analyze how many users return to your app, and how often they perform particular tasks or achieve goals. For example, if you run a game site, you could compare the numbers of users who return to the site after losing a game with the number who return after winning. This knowledge can help you improve your user experience and your business strategy.
Get started
If you don't yet see data in the retention tool in the Application Insights portal, learn how to get started with the usage tools.
The Retention workbook
To use the Retention workbook, in your Application Insights resources go to Usage > Retention > Retention Analysis Workbook. Or on the Workbooks tab, select Public Templates. Then under Usage, select User Retention Analysis.

Use the workbook

Workbook capabilities:
By default, retention shows all users who did anything and then came back and did anything else over a defined period. You can select different combinations of events to narrow the focus on specific user activities.
To add one or more filters on properties, select Add Filters. For example, you can focus on users in a particular country or region.
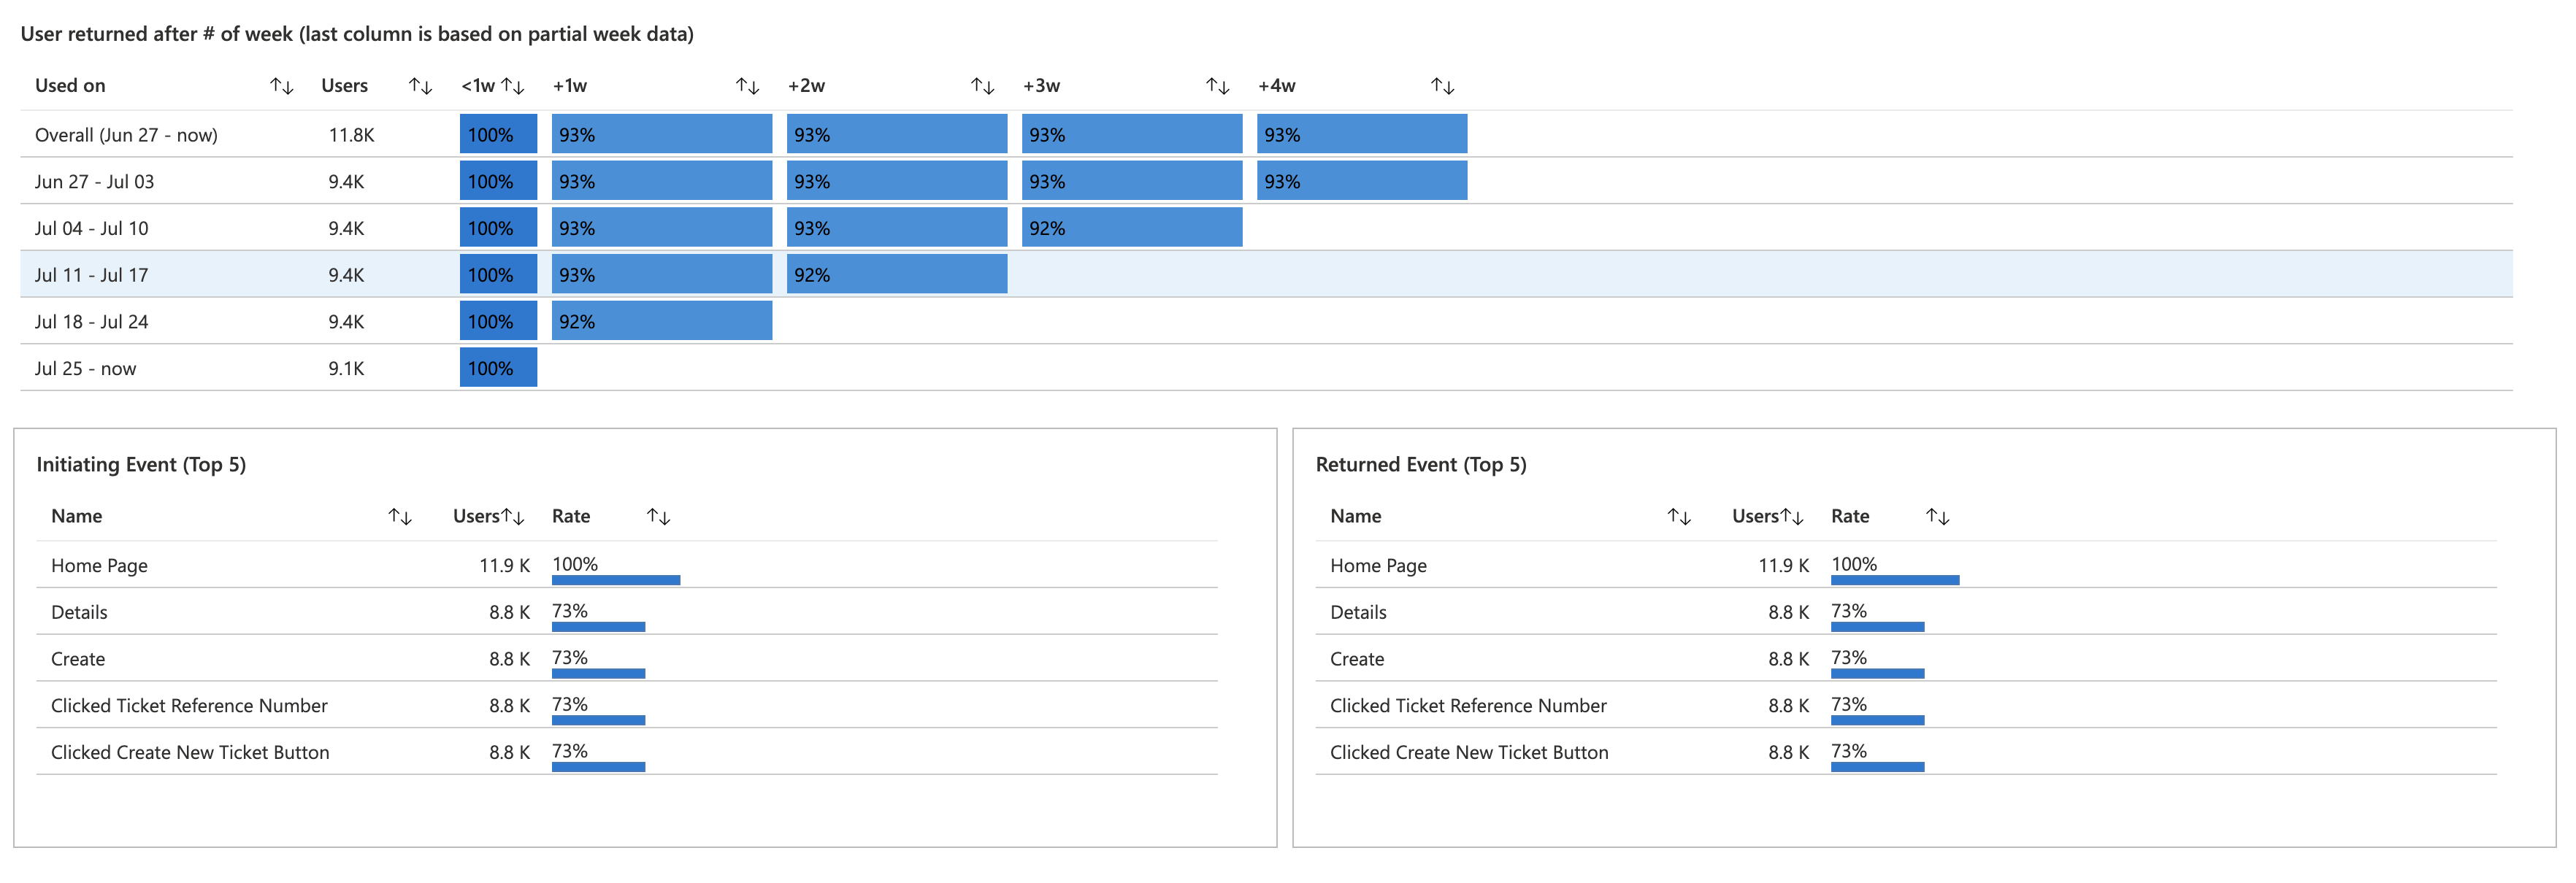
The Overall Retention chart shows a summary of user retention across the selected time period.
The grid shows the number of users retained. Each row represents a cohort of users who performed any event in the time period shown. Each cell in the row shows how many of that cohort returned at least once in a later period. Some users might return in more than one period.
The insights cards show the top five initiating events and the top five returned events. This information gives users a better understanding of their retention report.

Use business events to track retention
You should measure events that represent significant business activities to get the most useful retention analysis.
For more information and example code, see Custom business events.
To learn more, see writing custom events.
Next steps
- To learn more about workbooks, see the workbooks overview.
- To enable usage experiences, start sending custom events or page views.
- If you already send custom events or page views, explore the Usage tools to learn how users use your service:
Povratne informacije
Uskoro: tokom 2024. postepeno ćemo ukidati probleme s uslugom GitHub kao mehanizam povratnih informacija za sadržaj i zamijeniti ga novim sistemom povratnih informacija. Za više informacija, pogledajte https://aka.ms/ContentUserFeedback.
Pošalјite i prikažite povratne informacije za