Explore the samples gallery
The Azure Data Explorer web UI has a samples gallery for you to practice writing Kusto Query Language (KQL) queries and commands. This gallery provides sample data with guided tutorials in a free and publicly accessible help cluster.
Prerequisites
A Microsoft account or a Microsoft Entra user identity to sign in to the help cluster. An Azure subscription isn't required.
Get started
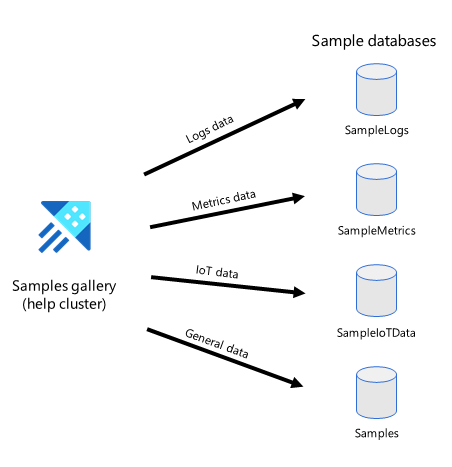
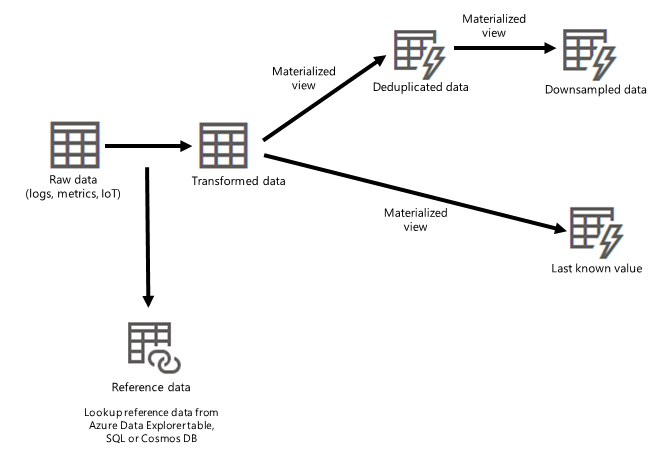
The following diagram is a high-level view of the databases available in the samples gallery.
Take action on sample data
Get started learning about KQL queries with a dataset from the samples gallery.
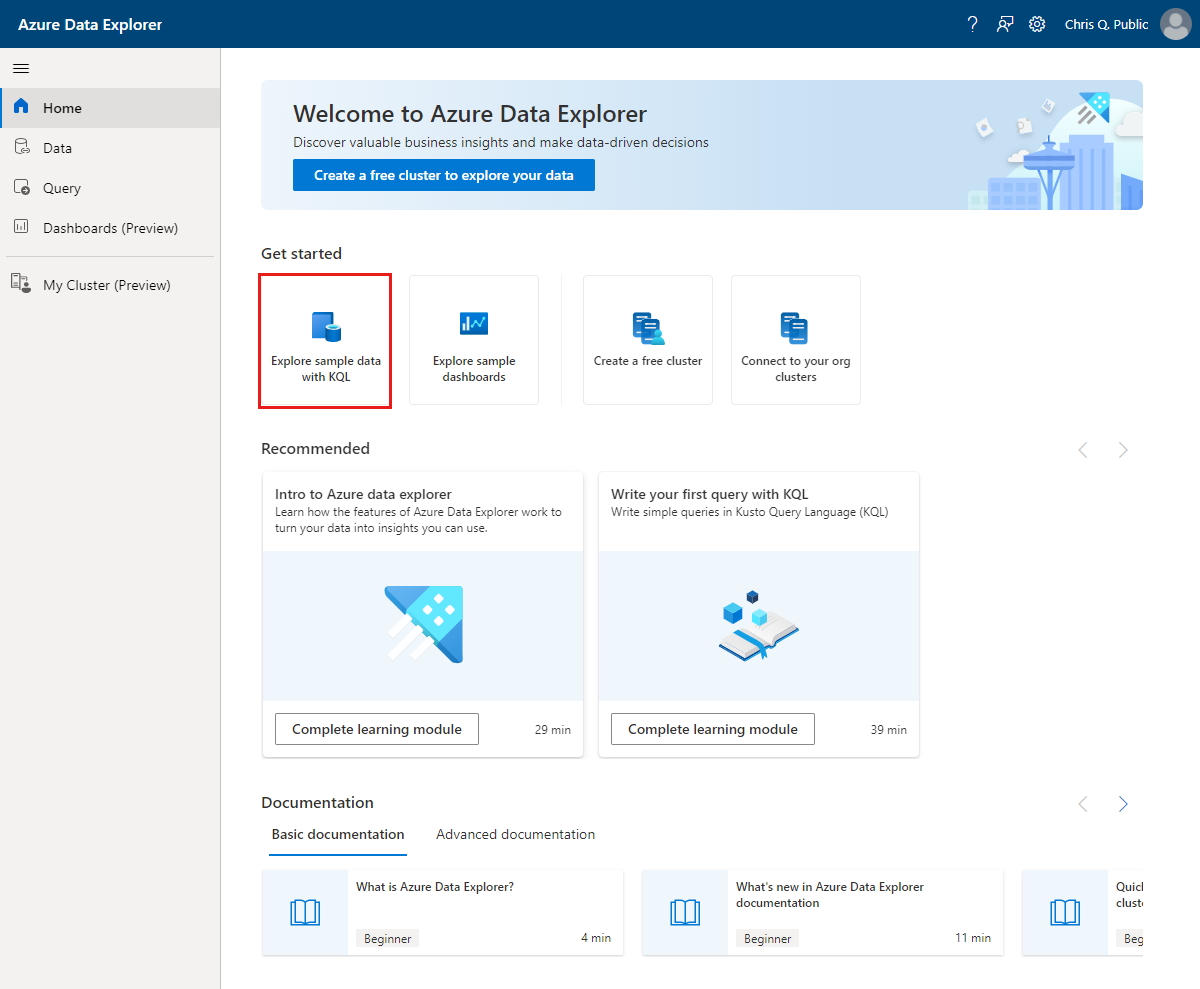
Sign in to the Azure Data Explorer web UI using your Microsoft account or Microsoft Entra user identity.
In the Home page, select Explore sample data with KQL.
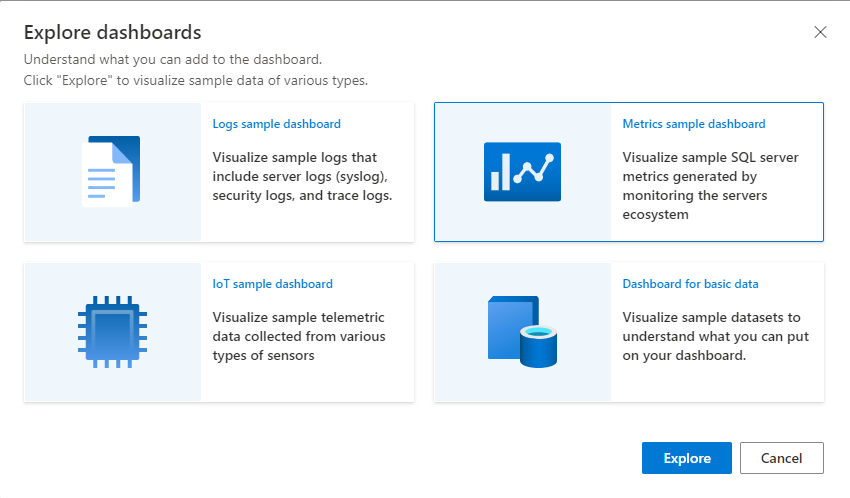
In the Explore data samples dialog box, select a sample dataset and then select Explore.
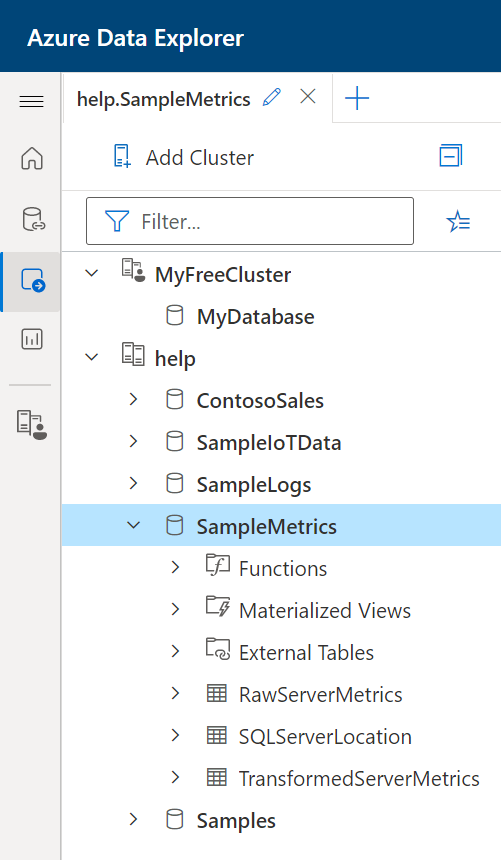
In the cluster connections pane, the help cluster is displayed with sample databases showing stored functions, external tables, materialized views, and database tables. The database selected in the sample data dialogue box is highlighted.
This diagram shows a high level view of the architectural data flow, from raw data through ingestion, processing, and materialized views.

Follow the tutorials
The query editor window, located to the right of the cluster connections pane, provides useful tutorials in the form of commonly used queries along with detailed explanations.
We'll take a look at the Metrics database, labeled as SampleMetrics in the cluster connections pane.
The SampleMetrics dataset consists of the following tables:
- RawServerMetrics: where raw data is ingested for temporary storage.
- TransformedServerMetrics: where parsed and processed data is stored.
- SQLServersLocation: containing reference data of servers' location.
Tip
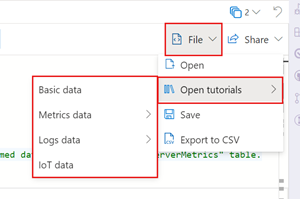
You can navigate to other tutorials from the query editor window. Select Open > Open tutorials and then choose the specific tutorial you want to explore.
Run a query
In the query edit window, place your cursor in a query and select Run at the top of the window, or press Shift + Enter to run a query. Results are displayed in the query results pane, directly below the query editor window.
Before running any query or command, take a moment to read the comments above it. The comments include important information. For example, why certain management commands won't work in the help cluster due to lack of permissions. The query editor provides suggestions and warnings as you write queries. To customize which suggestions and warnings you receive, see Set query recommendations.

Learn management commands
Since certain management commands can't be run in the help cluster, you can create your own free cluster to further explore these commands. Some examples of these commands are described in the following table.
| Table | Description | Command |
|---|---|---|
| RawServerMetrics | The ingestion batching policy can be configured to reduce the default ingestion latency from 5 minutes to 20 seconds, as described. | .alter table RawServerMetrics policy ingestionbatching @'{"MaximumBatchingTimeSpan": "00:00:20", "MaximumNumberOfItems": 500,"MaximumRawDataSizeMB": 1024}' |
| RawServerMetrics | The data retention policy can be configured to 10 days to avoid the duplication of data across raw and transformed tables. If needed, you can keep raw data for longer. For example, if there are any issues with the TransformedServerMetrics table, rather than going back to the source data, you can refer to the data in the RawServerMetrics table. | .alter table RawServerMetrics policy retention '{"SoftDeletePeriod": "10.00:00:00", "Recoverability": "Enabled"}' |
| TransformedServerMetrics | The update policy can be applied to transform and parse raw data. | .alter table TransformedServerMetrics policy update @'[{"IsEnabled": true, "Source": "RawServerMetrics", "Query": "Transform_RawServerMetrics()", "IsTransactional": true, "PropagateIngestionProperties": false}]' |