Monitor copy activity
APPLIES TO:  Azure Data Factory
Azure Synapse Analytics
Azure Data Factory
Azure Synapse Analytics
Tip
Try out Data Factory in Microsoft Fabric, an all-in-one analytics solution for enterprises. Microsoft Fabric covers everything from data movement to data science, real-time analytics, business intelligence, and reporting. Learn how to start a new trial for free!
This article outlines how to monitor the copy activity execution in Azure Data Factory and Synapse pipelines. It builds on the copy activity overview article that presents a general overview of copy activity. You can also monitor copy activities generated with the Copy Data Tool as well as Delete activities using the same approach.
Monitor visually
Once you've created and published a pipeline, you can associate it with a trigger or manually kick off an ad hoc run. You can monitor all of your pipeline runs natively in the user experience. Learn about monitoring in general from Visually monitor Azure Data Factory and Synapse pipelines.
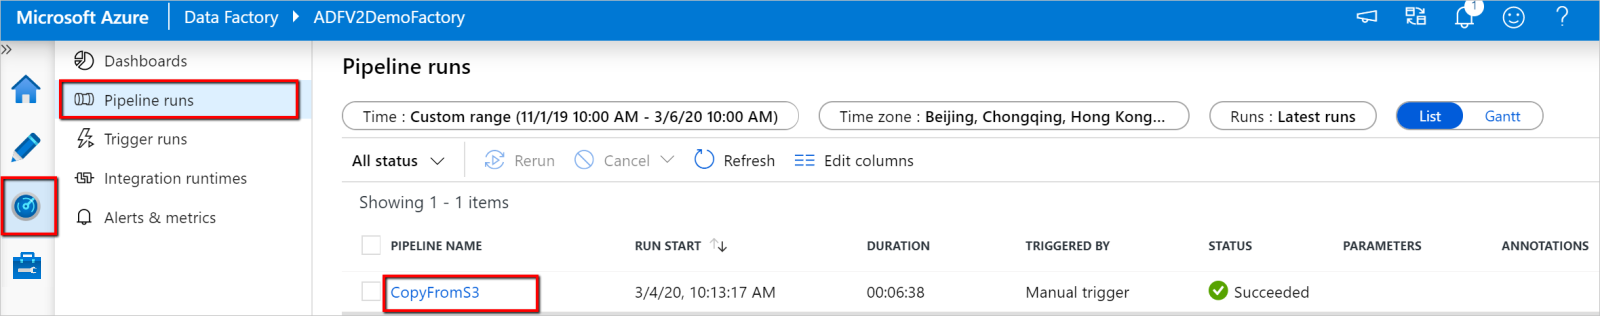
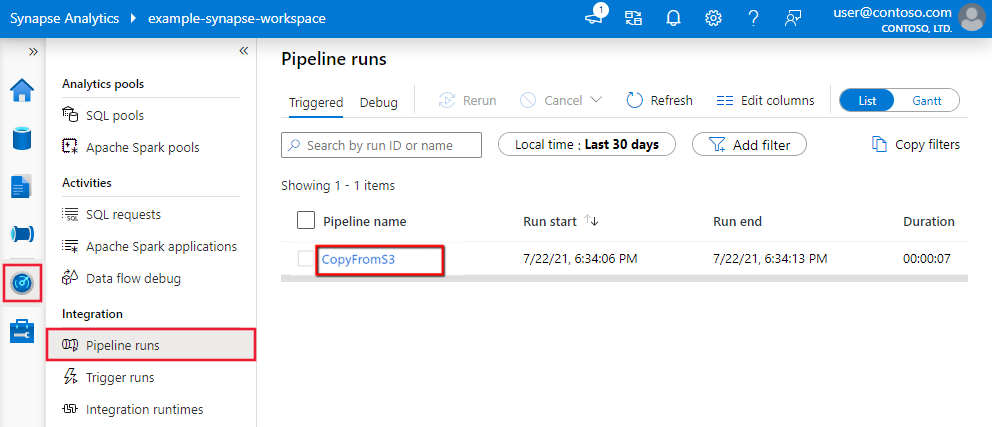
To monitor the Copy activity run, go to the Data Factory Studio or Azure Synapse Studio UI for your service instance. On the Monitor tab, you see a list of pipeline runs, click the pipeline name link to access the list of activity runs in the pipeline run.
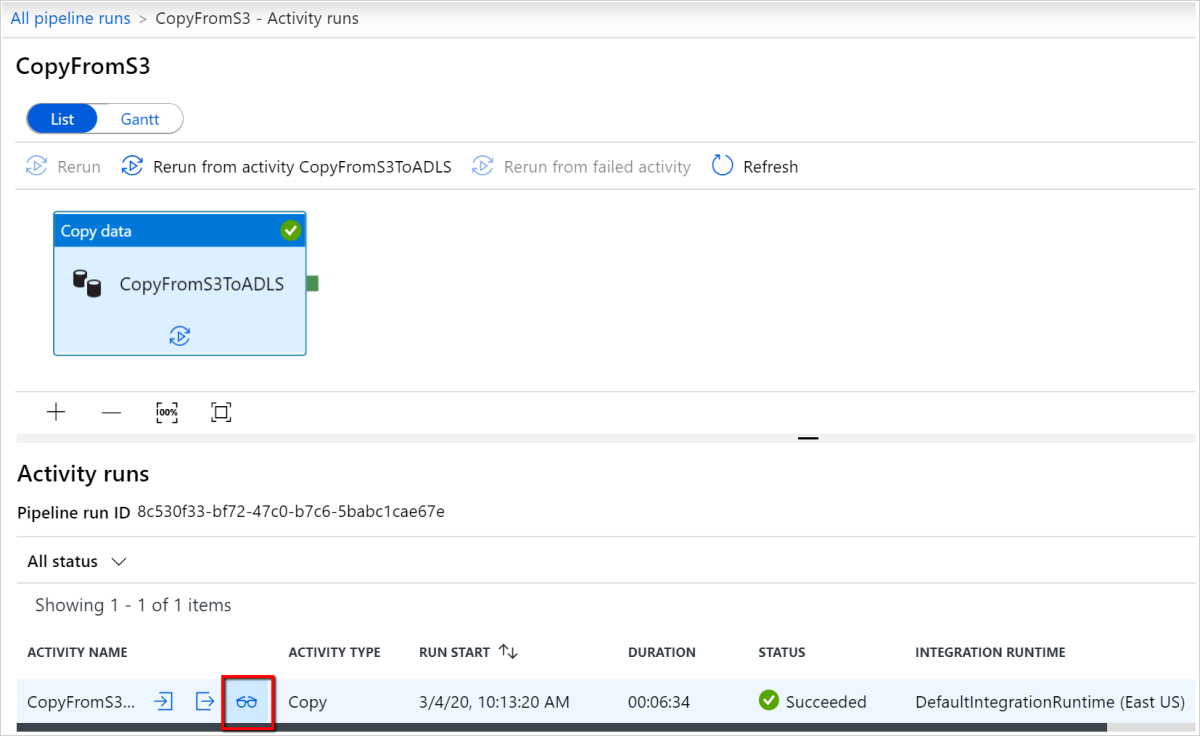
At this level, you can see links to copy activity input, output, and errors (if the Copy activity run fails), as well as statistics like duration/status. Clicking the Details button (eyeglasses) next to the copy activity name will give you deep details on your copy activity execution.
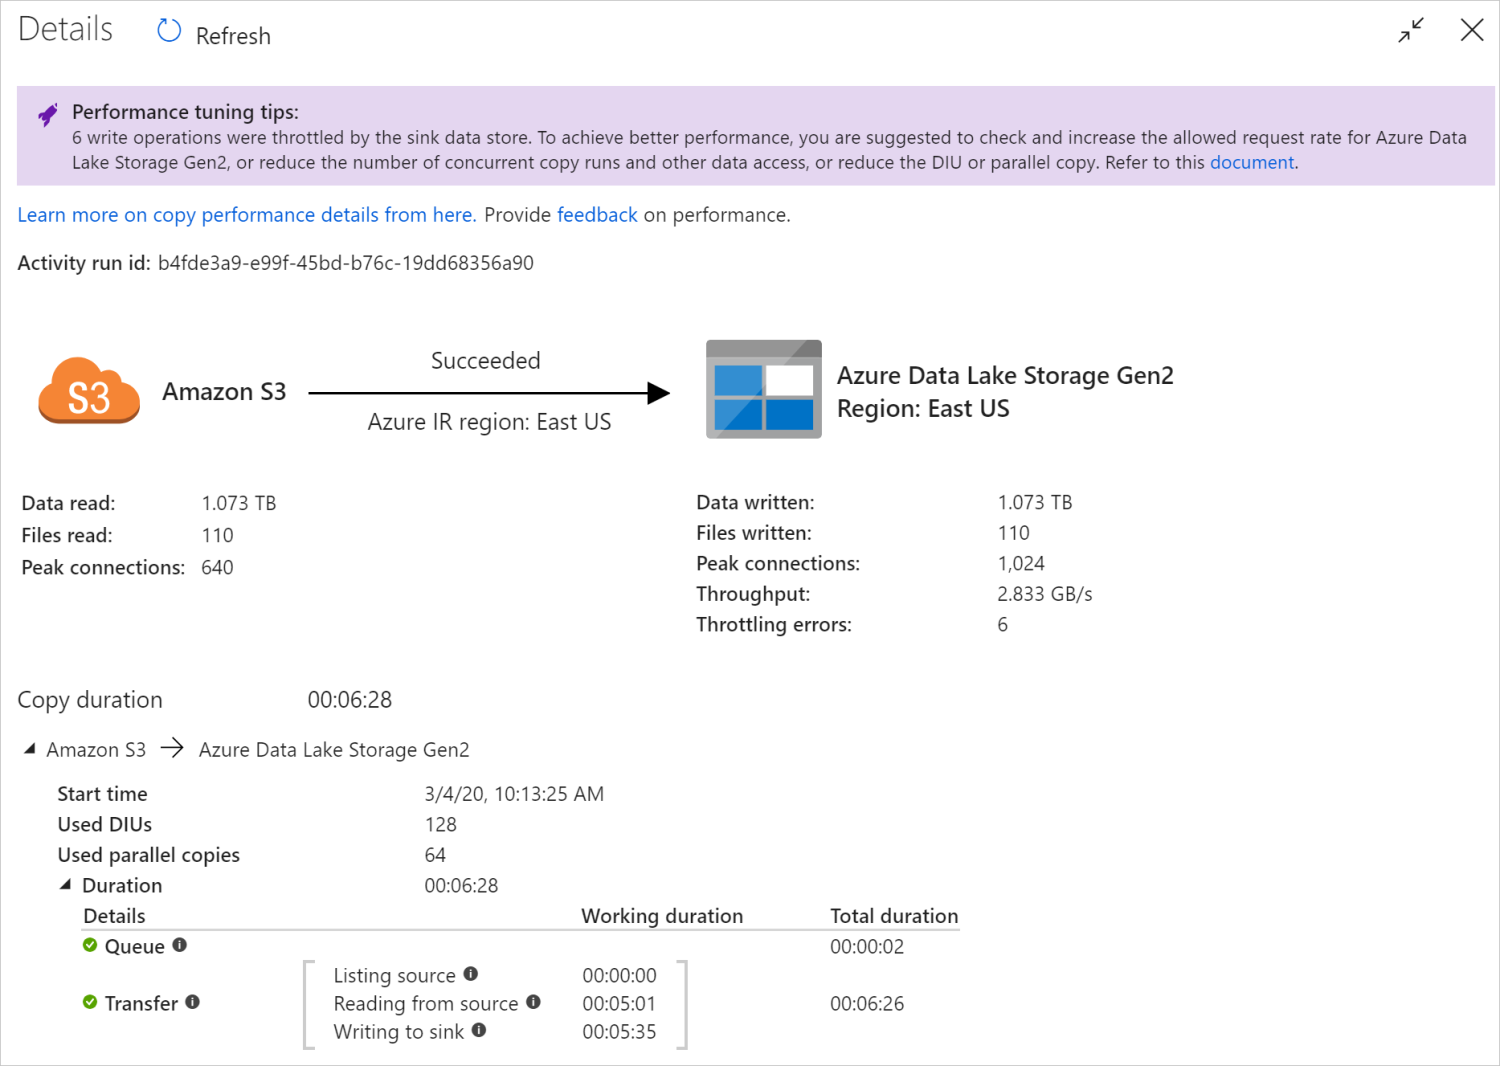
In this graphical monitoring view, the service presents you the copy activity execution information, including data read/written volume, number of files/rows of data copied from source to sink, throughput, the configurations applied for your copy scenario, steps the copy activity goes through with corresponding durations and details, and more. Refer to this table on each possible metric and its detailed description.
In some scenarios, when you run a Copy activity, you'll see "Performance tuning tips" at the top of the copy activity monitoring view as shown in the example. The tips tell you the bottleneck identified by the service for the specific copy run, along with suggestion on what to change to boost copy throughput. Learn more about auto performance tuning tips.
The bottom execution details and durations describes the key steps your copy activity goes through, which is especially useful for troubleshooting the copy performance. The bottleneck of your copy run is the one with the longest duration. Refer to Troubleshoot copy activity performance on for what each stage represents and the detailed troubleshooting guidance.
Example: Copy from Amazon S3 to Azure Data Lake Storage Gen2
Monitor programmatically
Copy activity execution details and performance characteristics are also returned in the Copy Activity run result > Output section, which is used to render the UI monitoring view. Following is a complete list of properties that might be returned. You'll see only the properties that are applicable to your copy scenario. For information about how to monitor activity runs programmatically in general, see Programmatically monitor an Azure Data Factory or Synapse pipeline.
| Property name | Description | Unit in output |
|---|---|---|
| dataRead | The actual amount of data read from the source. | Int64 value, in bytes |
| dataWritten | The actual mount of data written/committed to the sink. The size may be different from dataRead size, as it relates how each data store stores the data. |
Int64 value, in bytes |
| filesRead | The number of files read from the file-based source. | Int64 value (no unit) |
| filesWritten | The number of files written/committed to the file-based sink. | Int64 value (no unit) |
| filesSkipped | The number of files skipped from the file-based source. | Int64 value (no unit) |
| dataConsistencyVerification | Details of data consistency verification where you can see if your copied data has been verified to be consistent between source and destination store. Learn more from this article. | Array |
| sourcePeakConnections | Peak number of concurrent connections established to the source data store during the Copy activity run. | Int64 value (no unit) |
| sinkPeakConnections | Peak number of concurrent connections established to the sink data store during the Copy activity run. | Int64 value (no unit) |
| rowsRead | Number of rows read from the source. This metric does not apply when copying files as-is without parsing them, for example, when source and sink datasets are binary format type, or other format type with identical settings. | Int64 value (no unit) |
| rowsCopied | Number of rows copied to sink. This metric does not apply when copying files as-is without parsing them, for example, when source and sink datasets are binary format type, or other format type with identical settings. | Int64 value (no unit) |
| rowsSkipped | Number of incompatible rows that were skipped. You can enable incompatible rows to be skipped by setting enableSkipIncompatibleRow to true. |
Int64 value (no unit) |
| copyDuration | Duration of the copy run. | Int32 value, in seconds |
| throughput | Rate of data transfer, calculated by dataRead divided by copyDuration. |
Floating point number, in KBps |
| sourcePeakConnections | Peak number of concurrent connections established to the source data store during the Copy activity run. | Int32 value (no unit) |
| sinkPeakConnections | Peak number of concurrent connections established to the sink data store during the Copy activity run. | Int32 value (no unit) |
| sqlDwPolyBase | Whether PolyBase is used when data is copied into Azure Synapse Analytics. | Boolean |
| redshiftUnload | Whether UNLOAD is used when data is copied from Redshift. | Boolean |
| hdfsDistcp | Whether DistCp is used when data is copied from HDFS. | Boolean |
| effectiveIntegrationRuntime | The integration runtime (IR) or runtimes used to power the activity run, in the format <IR name> (<region if it's Azure IR>). |
Text (string) |
| usedDataIntegrationUnits | The effective Data Integration Units during copy. | Int32 value |
| usedParallelCopies | The effective parallelCopies during copy. | Int32 value |
| logPath | Path to the session log of skipped data in the blob storage. See Fault tolerance. | Text (string) |
| executionDetails | More details on the stages the Copy activity goes through and the corresponding steps, durations, configurations, and so on. We don't recommend that you parse this section because it might change. To better understand how it helps you understand and troubleshoot copy performance, refer to Monitor visually section. | Array |
| perfRecommendation | Copy performance tuning tips. See Performance tuning tips for details. | Array |
| billingReference | The billing consumption for the given run. Learn more from Monitor consumption at activity-run level. | Object |
| durationInQueue | Queueing duration in second before the copy activity starts to execute. | Object |
Example:
"output": {
    "dataRead": 1180089300500,
    "dataWritten": 1180089300500,
    "filesRead": 110,
    "filesWritten": 110,
    "filesSkipped": 0,
    "sourcePeakConnections": 640,
    "sinkPeakConnections": 1024,
    "copyDuration": 388,
    "throughput": 2970183,
    "errors": [],
    "effectiveIntegrationRuntime": "DefaultIntegrationRuntime (East US)",
    "usedDataIntegrationUnits": 128,
    "billingReference": "{\"activityType\":\"DataMovement\",\"billableDuration\":[{\"Managed\":11.733333333333336}]}",
    "usedParallelCopies": 64,
    "dataConsistencyVerification":
    {
        "VerificationResult": "Verified",
        "InconsistentData": "None"
    },
    "executionDetails": [
        {
            "source": {
                "type": "AmazonS3"
            },
            "sink": {
                "type": "AzureBlobFS",
                "region": "East US",
                "throttlingErrors": 6
            },
            "status": "Succeeded",
            "start": "2020-03-04T02:13:25.1454206Z",
            "duration": 388,
            "usedDataIntegrationUnits": 128,
            "usedParallelCopies": 64,
            "profile": {
                "queue": {
                    "status": "Completed",
                    "duration": 2
                },
                "transfer": {
                    "status": "Completed",
                    "duration": 386,
                    "details": {
                        "listingSource": {
                            "type": "AmazonS3",
                            "workingDuration": 0
                        },
                        "readingFromSource": {
                            "type": "AmazonS3",
                            "workingDuration": 301
                        },
                        "writingToSink": {
                            "type": "AzureBlobFS",
                            "workingDuration": 335
                        }
                    }
                }
            },
            "detailedDurations": {
                "queuingDuration": 2,
                "transferDuration": 386
            }
        }
    ],
    "perfRecommendation": [
        {
            "Tip": "6 write operations were throttled by the sink data store. To achieve better performance, you are suggested to check and increase the allowed request rate for Azure Data Lake Storage Gen2, or reduce the number of concurrent copy runs and other data access, or reduce the DIU or parallel copy.",
            "ReferUrl": "https://go.microsoft.com/fwlink/?linkid=2102534 ",
            "RuleName": "ReduceThrottlingErrorPerfRecommendationRule"
        }
    ],
    "durationInQueue": {
        "integrationRuntimeQueue": 0
    }
}
Related content
See the other Copy Activity articles: