Događaji
M03 31 23 - M04 2 23
Najveći događaj učenja jezika SQL, platforme Fabric i platforme Power BI. 31. mart - 2. april Koristite kod FABINSIDER da uštedite 400 dolara.
Registrirajte se danasOvaj preglednik više nije podržan.
Nadogradite na Microsoft Edge da iskoristite najnovije osobine, sigurnosna ažuriranja i tehničku podršku.
Applies to: ![]() SQL Server
SQL Server
Activity Monitor runs queries on the monitored instance to obtain information for the Activity Monitor display panes. When the refresh interval is set to less than 10 seconds, the time that is used to run these queries can affect server performance. We recommend that you download and install the latest version of SSMS.
To view actual activity, you must have VIEW SERVER STATE permission. To view the Data File I/O section of Activity Monitor, you must have CREATE DATABASE, ALTER ANY DATABASE, or VIEW ANY DEFINITION permission in addition to VIEW SERVER STATE.
To KILL a process, a user must be a member of the sysadmin or processadmin fixed server roles.
Right-click on the top-level object for a SQL Server connection, and select Activity Monitor.
From the Standard toolbar, select the Activity Monitor icon. It is in the middle, just to the right of the undo/redo buttons. To aid in finding it, hover over each icon until you find the Activity Monitor.
Complete the Connect to Server dialog box if you aren't already connected to an instance of SQL Server you want to monitor.
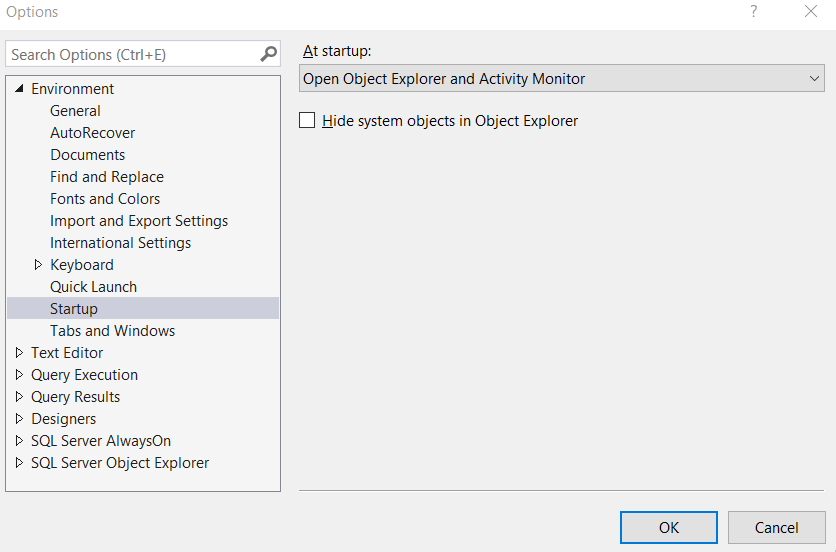
From the Tools menu, select Options.
In the Options dialog box, expand Environment, and then select Startup.
From the At startup dropdown list, select Open Object Explorer and Activity Monitor.
Select OK.
Open the Activity Monitor.
Right-click Overview, select Refresh Interval, and then select the interval in which Activity Monitor should obtain new instance information.
Događaji
M03 31 23 - M04 2 23
Najveći događaj učenja jezika SQL, platforme Fabric i platforme Power BI. 31. mart - 2. april Koristite kod FABINSIDER da uštedite 400 dolara.
Registrirajte se danasObučavanje
Dokumentacija
Live Query Statistics - SQL Server
Learn how to view the live execution plan of an active query in SQL Server Management Studio. Use the execution statistics to debug query performance issues.
Performance Dashboard - SQL Server
Learn about SQL Server Management Studio Performance Dashboard, which provides fast insight into SQL Server and Azure SQL Managed Instance.
Performance monitoring and tuning tools - SQL Server
Learn about SQL Server monitoring and tuning tools and how to choose the right one depending on the type of monitoring and the events to monitor.