Tutorial: Add grouping and totals (Reporting Services)
After you format the report fields, you add grouping and totals to your Reporting Services report to organize and summarize your data.
In this tutorial, you:
- Group data in a report to organize related information.
- Add totals to summarize data at different levels.
- Format grouped data and totals for better readability.
Prerequisites
- Completion of Step 1: Create a report server project.
- Completion of Step 2: Specify connection information.
- Completion of Step 3: Define a dataset for the table report.
- Completion of Step 4: Add a table to the report.
- Completion of Step 5: Format a report.
Group data in a report
You can group data in your SQL Server Reporting Services (SSRS) report. Grouping data helps organize related rows of data into sections, making your report easier to read and interpret.
Open your Sales Order report definition file (.rdl) in Visual Studio.
Select the Design tab.
If you don't see the Row Groups pane, right-click the design surface and select View > Grouping.
From the Report Data pane, drag the
[Date]field to the Row Groups pane. Place it above the row displayed as = (Details).Note
The row handle has a bracket in it, to indicate a group. The table also has two
[Date]expression columns, one on both sides of a vertical dotted line.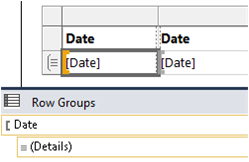
From the Report Data pane, drag the
[Order]field to the Row Groups pane. Place it after Date and before = (Details).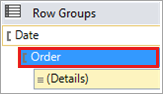
Note
Now the row handle has two brackets in it,
 to indicate two groups. The table has two
 [Order]expression columns.Delete the original
[Date]and[Order]expression columns to the right of the double line. Select the column handles for the two columns, right-click and choose Delete Columns. Report Designer removes the individual row expressions, so that only the group expressions are displayed.
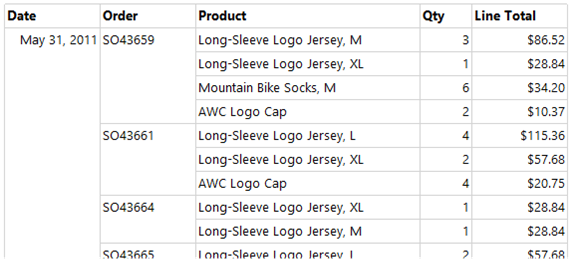
To format the new
[Date]column, right-click the data region cell that contains the[Date]expression, and select Text Box Properties.Select Number in the left-most box, and Date from the Category box.
In the Type box, select January 31, 2000.
Select OK.
Preview the report on the Preview tab.
Add totals to a report
You can add totals to your report to summarize data. Totals help you quickly understand aggregate values and enhance the report's usability.
Switch to the Design view.
Right-click the data region cell that contains the
[LineTotal]expression, and select Add Total. Report Designer adds a row with a sum of the dollar amount for each order.Right-click the cell that contains the field
[Qty], and select Add Total. Report Designer adds a sum of the quantity for each order to the totals row.In the empty cell to the left of the
Sum[Qty]cell, enter "Order Total".Select the two sum cells and the label cell in the row where you added the total cells.
Select Format > Background Color > Light Gray.
Select OK.
Add the daily total to the report
You can add a daily total to your report. This step provides a daily summary at the end of each date grouping and helps you quickly identify daily aggregates within your report.
Right-click the
[Order]expression cell, and select Add Total > After. Report Designer adds a new row containing sums of the[Qty]and[Linetotal]values for each day, and the string "Total" to the bottom of the[Order]expression column.Enter the word "Daily" before the word "Total" in the same cell, so it reads "Daily Total".
Select that cell and the two adjacent total cells to the right side and the empty cell in between them.
Select Format > Background Color > Orange.
Select OK.
Add the grand total to the report
You can add a grand total to your report to summarize all the data across the entire report. A grand total provides a comprehensive summary and makes it easier to understand the overall data at a glance.
Right-click the
[Date]expression cell, and select Add Total > After. Report Designer adds a new row containing sums of the[Qty]and[LineTotal]values for the entire report, and the string "Total" to the bottom of the[Date]expression column.Enter the string "Grand" before the word "Total" in the same cell, so it reads "Grand Total".
Select the cell with "Grand Total", the two
Sum()expression cells and the empty cells between them.Select Format > Background Color > Light Blue.
Select OK.
Preview the report
Switch to the Preview tab so you can view the report as it appears when published. Look for any errors or issues you can fix before finalizing the report.
Select the Preview tab.
In the Preview toolbar, choose Last Page, which looks like
 . The Grand Total values display at the end of the report.
Publish the report to the Report Server (optional)
Publish your completed report to the Report Server. This process is optional and involves configuring the report properties, setting the target server URL, and deploying the report. This step is crucial for making your report available to a broader audience through the web portal and ensuring the information is easily accessible.
Select Project > Tutorial Properties....
In the TargetServerURL, enter the name of your report server, for example:
http:/<servername>/reportserverorhttp://localhost/reportserverworks if you're designing the report on the report server.
The TargetReportFolder is named Tutorial from the name of the project. Report Designer deploys the report to this folder.
Select OK.
Select Build > Deploy Tutorial.
If you see a message similar the following Output window, it indicates a successful deployment.
------ Build started: Project: tutorial, Configuration: Debug ------
Skipping 'Sales Orders.rdl'. Item is up to date.
Build complete -- 0 errors, 0 warnings
------ Deploy started: Project: tutorial, Configuration: Debug ------
Deploying to `https://[server name]/reportserver`
Deploying report '/tutorial/Sales Orders'.
Deploy complete -- 0 errors, 0 warnings
========== Build: 1 succeeded or up-to-date, 0 failed, 0 skipped ==========
========== Deploy: 1 succeeded, 0 failed, 0 skipped ==========
If you see an error message, verify you have the appropriate permissions on the report server and you started SQL Server Data Tools with administrator privileges.
Open a browser with administrator privileges. For example, right-click the icon for Internet Explorer and select Run as administrator.
Browse to the web portal URL.
https://<server name>/reports.http://localhost/reportsworks if you're designing the report on the report server.
Select the Tutorial folder, and then open the Sales Orders report.
You successfully completed the Creating a Basic Table Report tutorial.
Related content
Váš názor
Připravujeme: V průběhu roku 2024 budeme postupně vyřazovat problémy z GitHub coby mechanismus zpětné vazby pro obsah a nahrazovat ho novým systémem zpětné vazby. Další informace naleznete v tématu: https://aka.ms/ContentUserFeedback.
Odeslat a zobrazit názory pro