Události
29. 4. 14 - 30. 4. 19
Připojte se k konečné virtuální události Windows Serveru 29.30. dubna, kde můžete podrobně prozkoumat technické relace a živé Q&A s inženýry Microsoftu.
Zaregistrujte seTento prohlížeč se už nepodporuje.
Upgradujte na Microsoft Edge, abyste mohli využívat nejnovější funkce, aktualizace zabezpečení a technickou podporu.
Azure Monitor maximizes the availability and performance of your applications by delivering a comprehensive solution for collecting, analyzing, and acting on telemetry from your cloud and on-premises environments. It helps you understand how your applications are performing and proactively identifies issues affecting them and the resources they depend on.
This is particularly helpful for your on-premises hyper-converged cluster. With Azure Monitor integrated, you will be able to configure email, text (SMS), and other alerts to ping you when something is wrong with your cluster (or when you want to flag some other activity based on the data collected). Below, we will briefly explain how Azure Monitor works, how to install Azure Monitor, and how to configure it to send you notifications.
If you are using System Center, check out the Storage Spaces Direct management pack that monitors both Windows Server 2019 and Windows Server 2016 Storage Spaces Direct clusters.
This management pack includes:
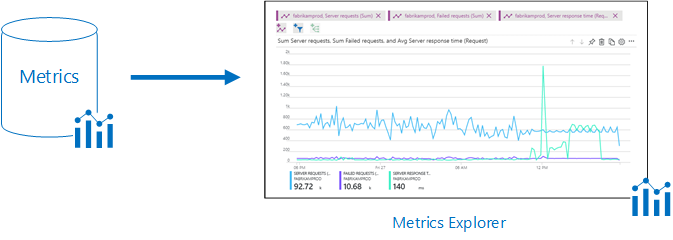
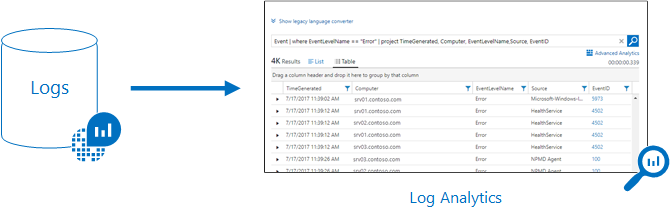
All data collected by Azure Monitor fits into one of two fundamental types: metrics and logs.
We will have more details below on how to configure these alerts.
Using Windows Admin Center, you can onboard your cluster to Azure Monitor.
During this onboarding flow, the steps below are happening under the hood. We detail how to configure them in detail in case you want to manually setup your cluster.
The first thing that you need to do is configure your cluster. As you may know, the Health Service improves the day-to-day monitoring and operational experience for clusters running Storage Spaces Direct.
As we saw above, Azure Monitor collects logs from each node that it is running on in your cluster. So, we have to configure the Health Service to write to an event channel, which happens to be:
Event Channel: Microsoft-Windows-Health/Operational
Event ID: 8465
To configure the Health Service, you run:
get-storagesubsystem clus* | Set-StorageHealthSetting -Name "Platform.ETW.MasTypes" -Value "Microsoft.Health.EntityType.Subsystem,Microsoft.Health.EntityType.Server,Microsoft.Health.EntityType.PhysicalDisk,Microsoft.Health.EntityType.StoragePool,Microsoft.Health.EntityType.Volume,Microsoft.Health.EntityType.Cluster"
When you run the cmdlet above to set the Health Settings, you cause the events we want to begin being written to the Microsoft-Windows-Health/Operational event channel.
Now that you have setup the proper logging on your cluster, the next step is to properly configure log analytics.
To give an overview, Azure Log Analytics can collect data directly from your physical or virtual Windows computers in your datacenter or other cloud environment into a single repository for detailed analysis and correlation.
To understand the supported configuration, review supported Windows operating systems and network firewall configuration.
If you don't have an Azure subscription, create a free account before you begin.
Log in to the Azure portal at https://portal.azure.com.
For more details on the steps listed below, see the Azure Monitor documentation.
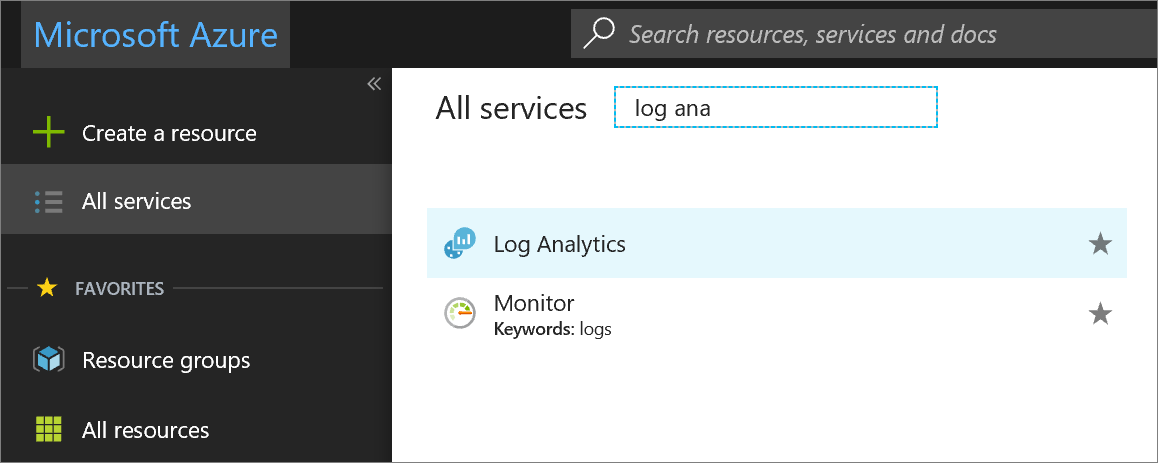
In the Azure portal, click All services. In the list of resources, type Log Analytics. As you begin typing, the list filters based on your input. Select Log Analytics.
Click Create, and then select choices for the following items:
Provide a name for the new Log Analytics Workspace, such as DefaultLAWorkspace.
Select a Subscription to link to by selecting from the drop-down list if the default selected is not appropriate.
For Resource Group, select an existing resource group that contains one or more Azure virtual machines.
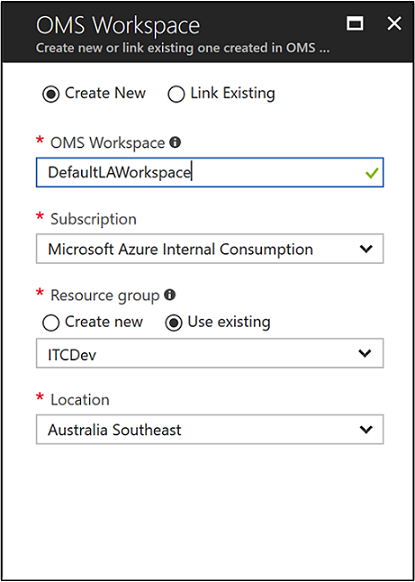
After providing the required information on the Log Analytics Workspace pane, click OK.
While the information is verified and the workspace is created, you can track its progress under Notifications from the menu.
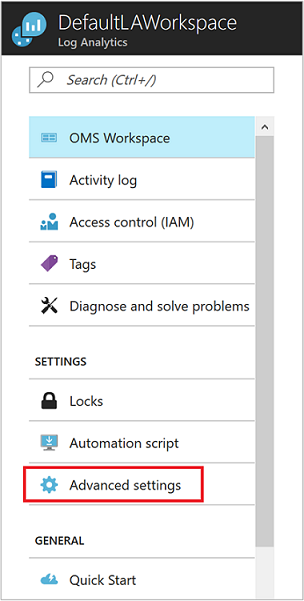
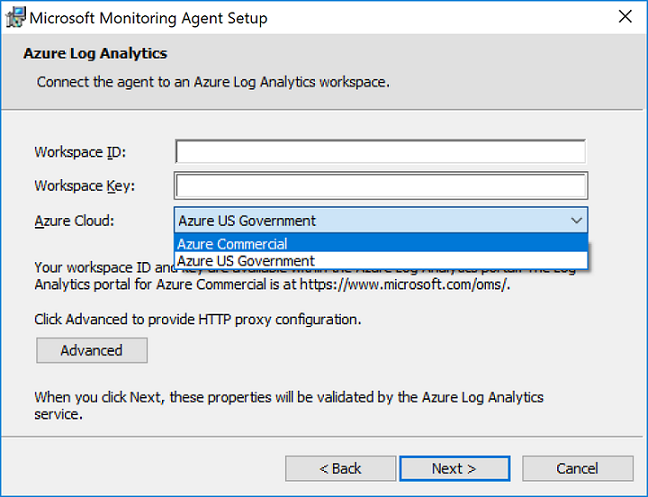
Before installing the Microsoft Monitoring Agent for Windows, you need the workspace ID and key for your Log Analytics workspace. This information is required by the setup wizard to properly configure the agent and ensure it can successfully communicate with Log Analytics.
The following steps install and configure the Microsoft Monitoring Agent. Be sure to install this agent on each server in your cluster and indicate that you want the agent to run at Windows Startup.
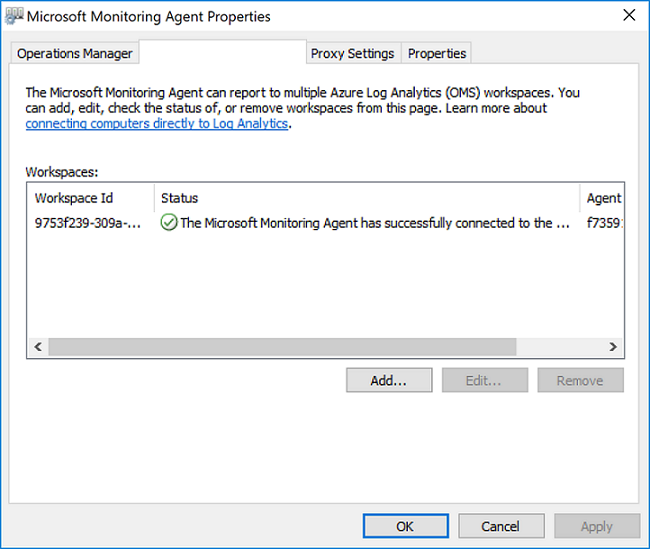
When complete, the Microsoft Monitoring Agent appears in Control Panel. You can review your configuration and verify that the agent is connected to Log Analytics. When connected, on the Azure Log Analytics tab, the agent displays a message stating: The Microsoft Monitoring Agent has successfully connected to the Microsoft Log Analytics service.
To understand the supported configuration, review supported Windows operating systems and network firewall configuration.
In Windows Admin Center, you can configure default alerts that will apply to all servers in your Log Analytics workspace.
These are the alerts and their default conditions that you can opt into:
| Alert Name | Default Condition |
|---|---|
| CPU utilization | Over 85% for 10 minutes |
| Disk capacity utilization | Over 85% for 10 minutes |
| Memory utilization | Available memory less than 100 MB for 10 minutes |
| Heartbeat | Fewer than 2 beats for 5 minutes |
| System critical error | Any critical alert in the cluster system event log |
| Health service alert | Any health service fault on the cluster |
Once you configure the alerts in Windows Admin Center, you can see the alerts in your log analytics workspace in Azure.

During this onboarding flow, the steps below are happening under the hood. We detail how to configure them in detail in case you want to manually setup your cluster.
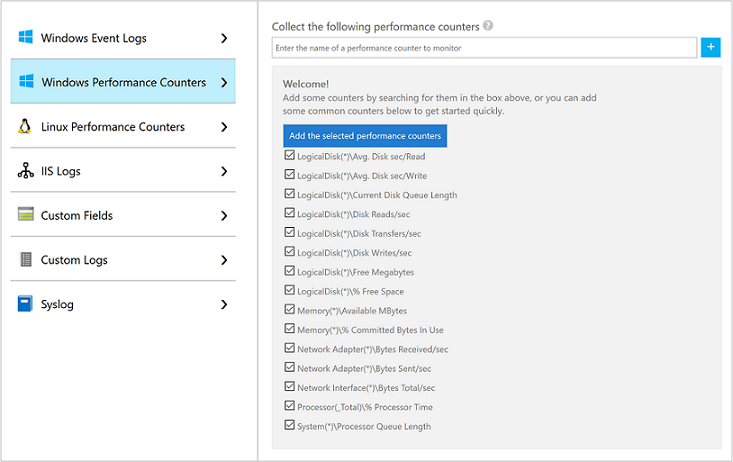
Log Analytics can collect events from the Windows event log and performance counters that you specify for longer term analysis and reporting, and take action when a particular condition is detected. Follow these steps to configure collection of events from the Windows event log, and several common performance counters to start with.
Event Channel: Microsoft-Windows-Health/Operational
If you've made it this far, your cluster should be sending your logs and performance counters to Log Analytics. The next step is to create alert rules that automatically run log searches at regular intervals. If results of the log search match particular criteria, then an alert is fired that sends you an email or text notification. Let's explore this below.
Start by opening the Log Search portal.
The quickest way to retrieve some data to work with is a simple query that returns all records in table. Type the following queries in the search box and click the search button.
Event
Data is returned in the default list view, and you can see how many total records were returned.
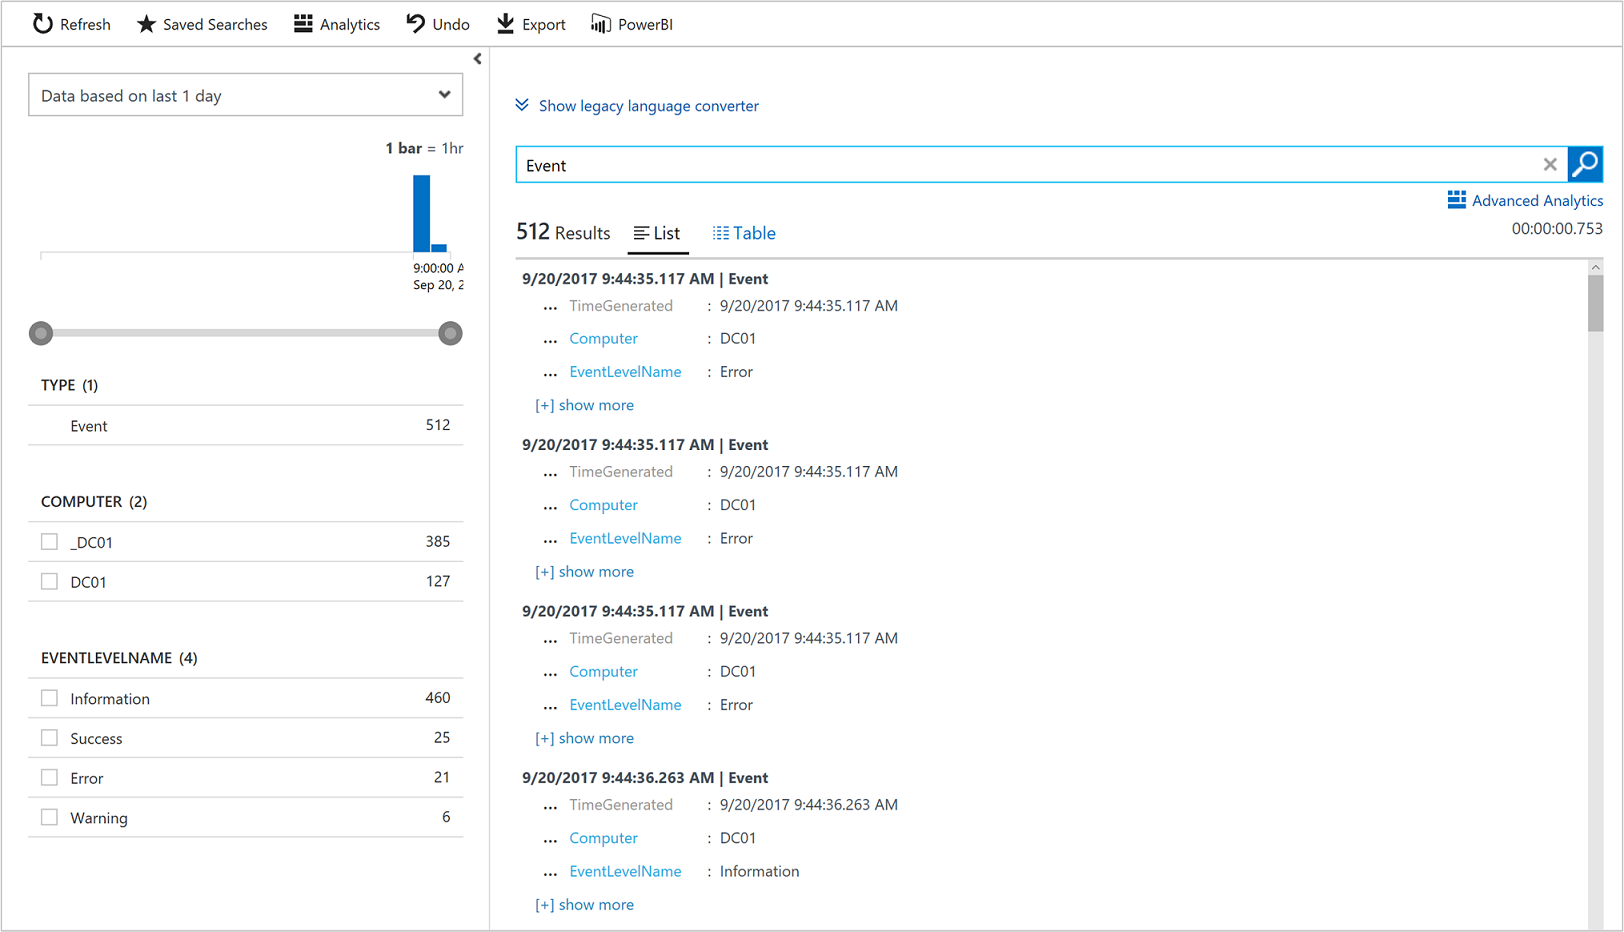
On the left side of the screen is the filter pane which allows you to add filtering to the query without modifying it directly. Several record properties are displayed for that record type, and you can select one or more property values to narrow your search results.
Select the checkbox next to Error under EVENTLEVELNAME or type the following to limit the results to error events.
Event | where (EventLevelName == "Error")
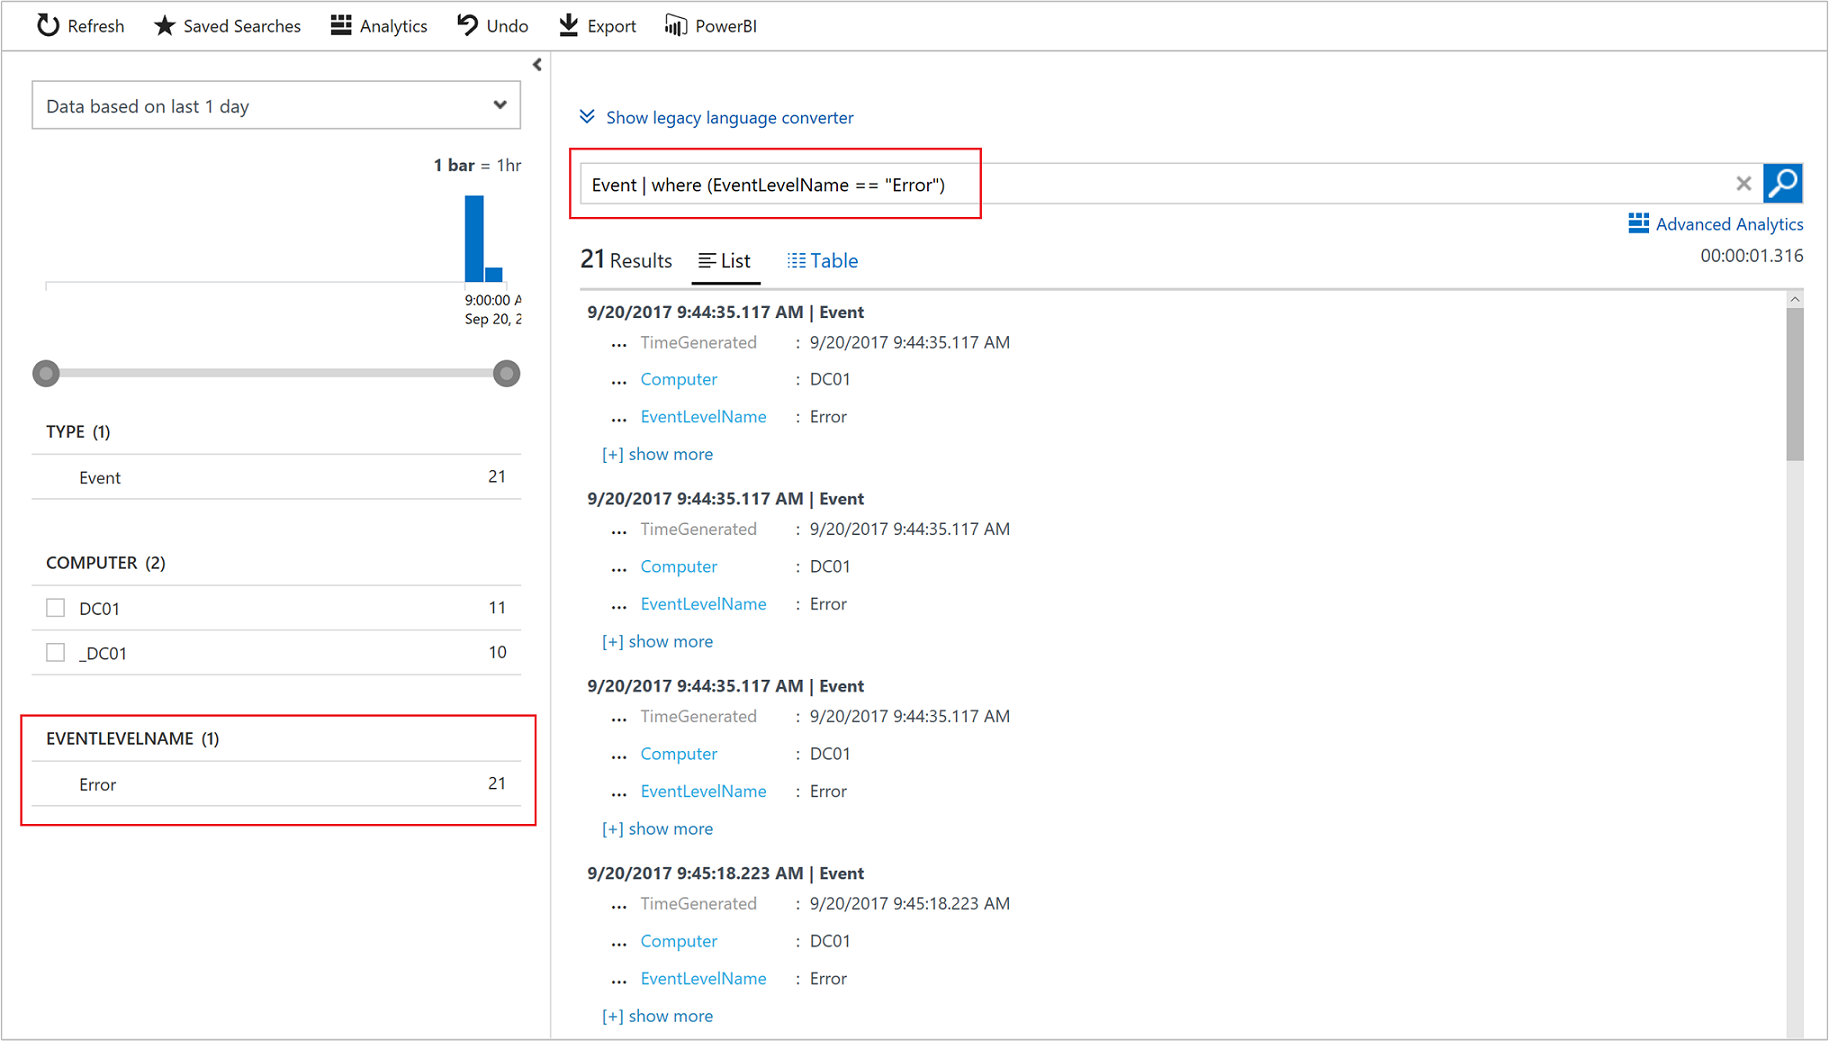
After you have the appropriate queries made for events you care about, save them for the next step.
Now, let's walk through an example for creating an alert.
In the Azure portal, click All services. In the list of resources, type Log Analytics. As you begin typing, the list filters based on your input. Select Log Analytics.
In the left-hand pane, select Alerts and then click New Alert Rule from the top of the page to create a new alert.
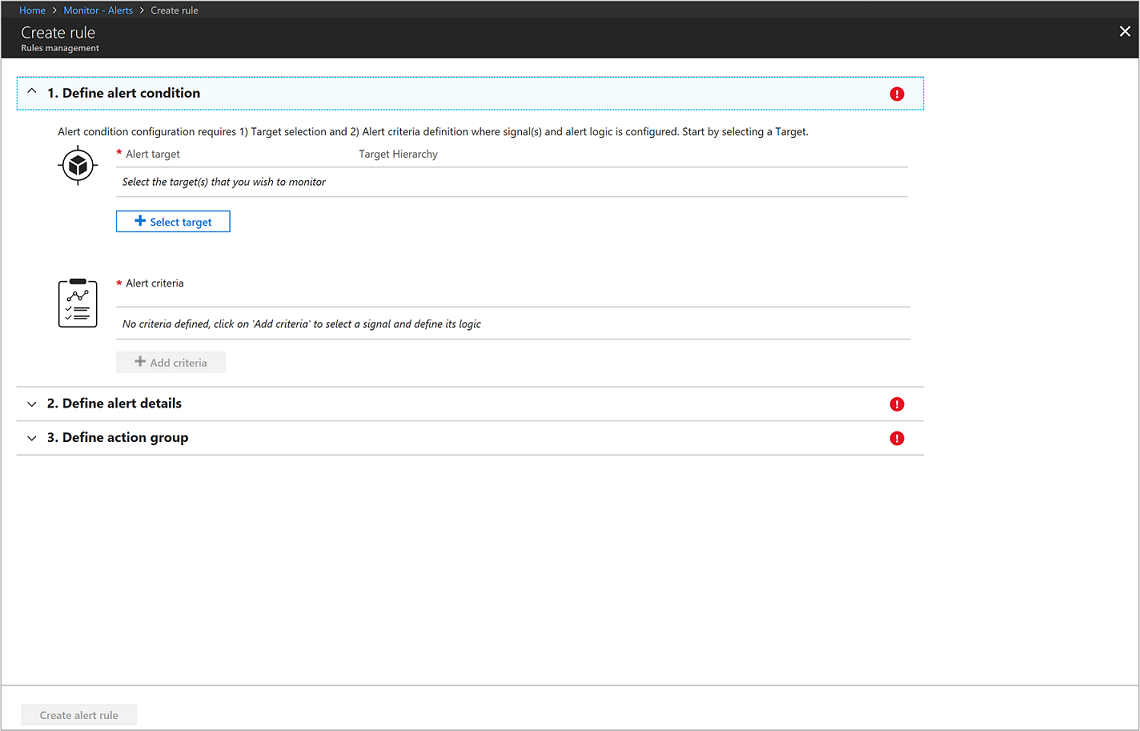
For the first step, under the Create Alert section, you are going to select your Log Analytics workspace as the resource, since this is a log based alert signal. Filter the results by choosing the specific Subscription from the drop-down list if you have more than one, which contains Log Analytics workspace created earlier. Filter the Resource Type by selecting Log Analytics from the drop-down list. Finally, select the Resource DefaultLAWorkspace and then click Done.
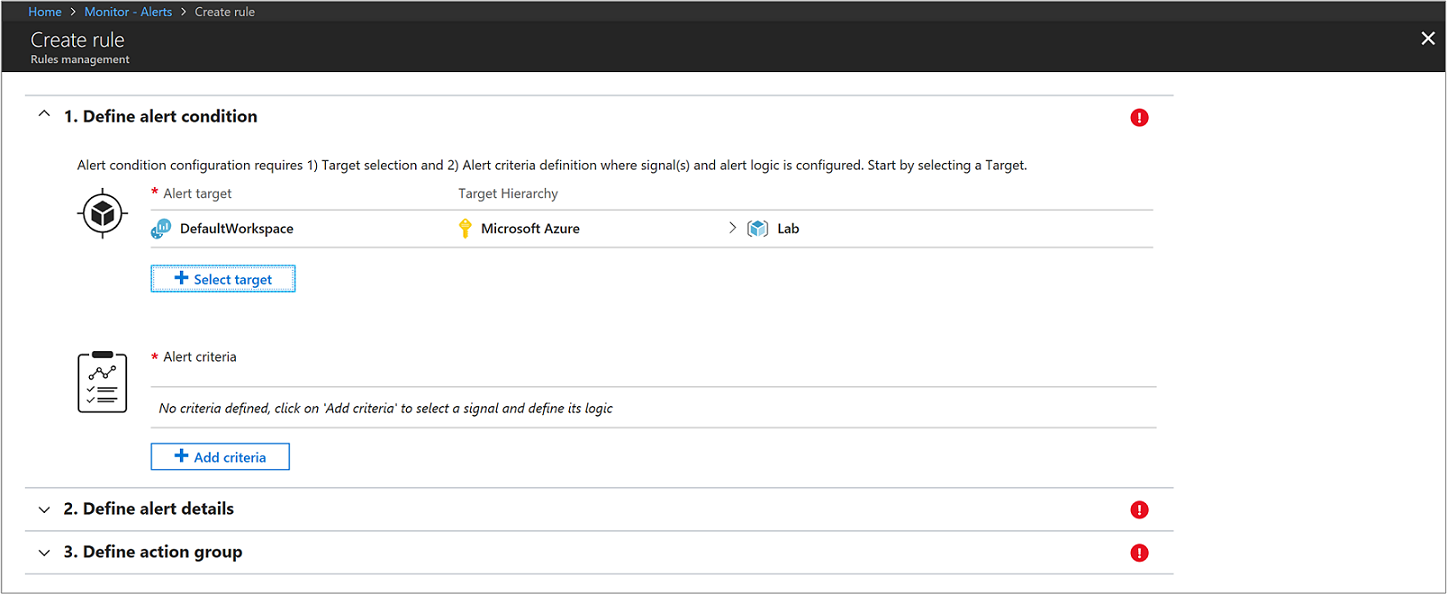
Under the section Alert Criteria, click Add Criteria to select your saved query and then specify logic that the alert rule follows.
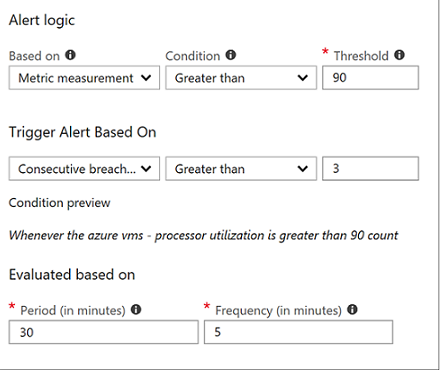
Configure the alert with the following information: a. From the Based on drop-down list, select Metric measurement. A metric measurement will create an alert for each object in the query with a value that exceeds our specified threshold. b. For the Condition, select Greater than and specify a threshold. c. Then define when to trigger the alert. For example you could select Consecutive breaches and from the drop-down list select Greater than a value of 3. d. Under Evaluation based on section, modify the Period value to 30 minutes and Frequency to 5. The rule will run every five minutes and return records that were created within the last thirty minutes from the current time. Setting the time period to a wider window accounts for the potential of data latency, and ensures the query returns data to avoid a false negative where the alert never fires.
Click Done to complete the alert rule.
Now moving onto the second step, provide a name of your alert in the Alert rule name field, such as Alert on all Error Events. Specify a Description detailing specifics for the alert, and select Critical(Sev 0) for the Severity value from the options provided.
To immediately activate the alert rule on creation, accept the default value for Enable rule upon creation.
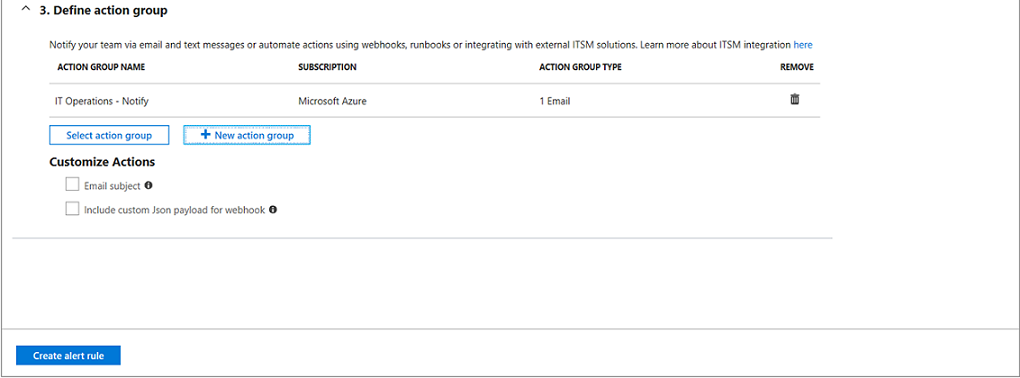
For the third and final step, you specify an Action Group, which ensures that the same actions are taken each time an alert is triggered and can be used for each rule you define. Configure a new action group with the following information:
a. Select New action group and the Add action group pane appears.
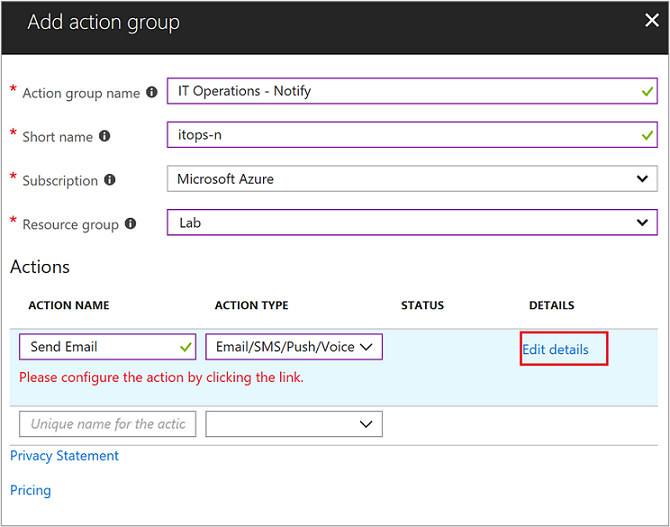
b. For Action group name, specify a name such as IT Operations - Notify and a Short name such as itops-n.
c. Verify the default values for Subscription and Resource group are correct. If not, select the correct one from the drop-down list.
d. Under the Actions section, specify a name for the action, such as Send Email and under Action Type select Email/SMS/Push/Voice from the drop-down list. The Email/SMS/Push/Voice properties pane will open to the right in order to provide additional information.
e. On the Email/SMS/Push/Voice pane, select and setup your preference. For example, enable Email and provide a valid email SMTP address to deliver the message to.
f. Click OK to save your changes.
Click OK to complete the action group.
Click Create alert rule to complete the alert rule. It starts running immediately.
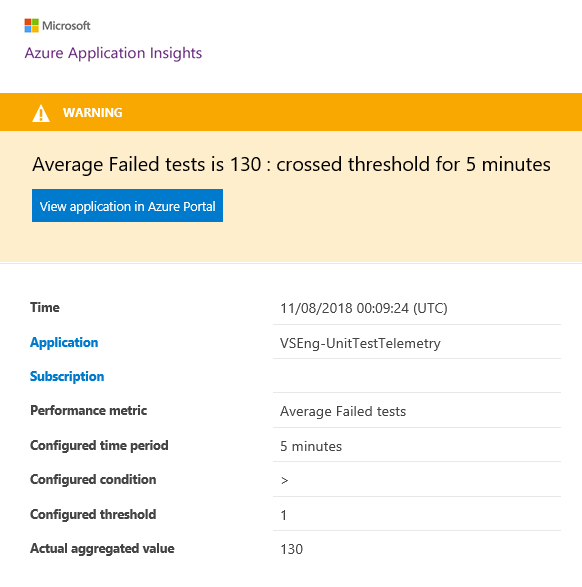
For reference, this is what an example alert looks like in Azure.
Below is an example of the email that you will be send by Azure Monitor:
Události
29. 4. 14 - 30. 4. 19
Připojte se k konečné virtuální události Windows Serveru 29.30. dubna, kde můžete podrobně prozkoumat technické relace a živé Q&A s inženýry Microsoftu.
Zaregistrujte seŠkolení
Certifikace
Microsoft Certified: Windows Server Hybrid Administrator Associate - Certifications
As a Windows Server hybrid administrator, you integrate Windows Server environments with Azure services and manage Windows Server in on-premises networks.