Bemærk
Adgang til denne side kræver godkendelse. Du kan prøve at logge på eller ændre mapper.
Adgang til denne side kræver godkendelse. Du kan prøve at ændre mapper.
While developing an application, you often want to see what's being written to the logs in near real time when running in Azure.
There are two ways to view the stream of log files that your function executions generate.
When your function app is connected to Application Insights, you can use Live Metrics Stream to view log data and other metrics in near real-time in the Azure portal. Live Metrics stream is the recommended way to view streaming logs it supports all plan types and is the method to use when monitoring functions running on multiple-instances. It also uses sampled data, so it can protect you from producing too much data during times of peak loads.
Important
By default, the Live Metrics stream includes logs from all apps connected to a given Application Insights instance. When you have more than one app sending log data, you should filter your log stream data.
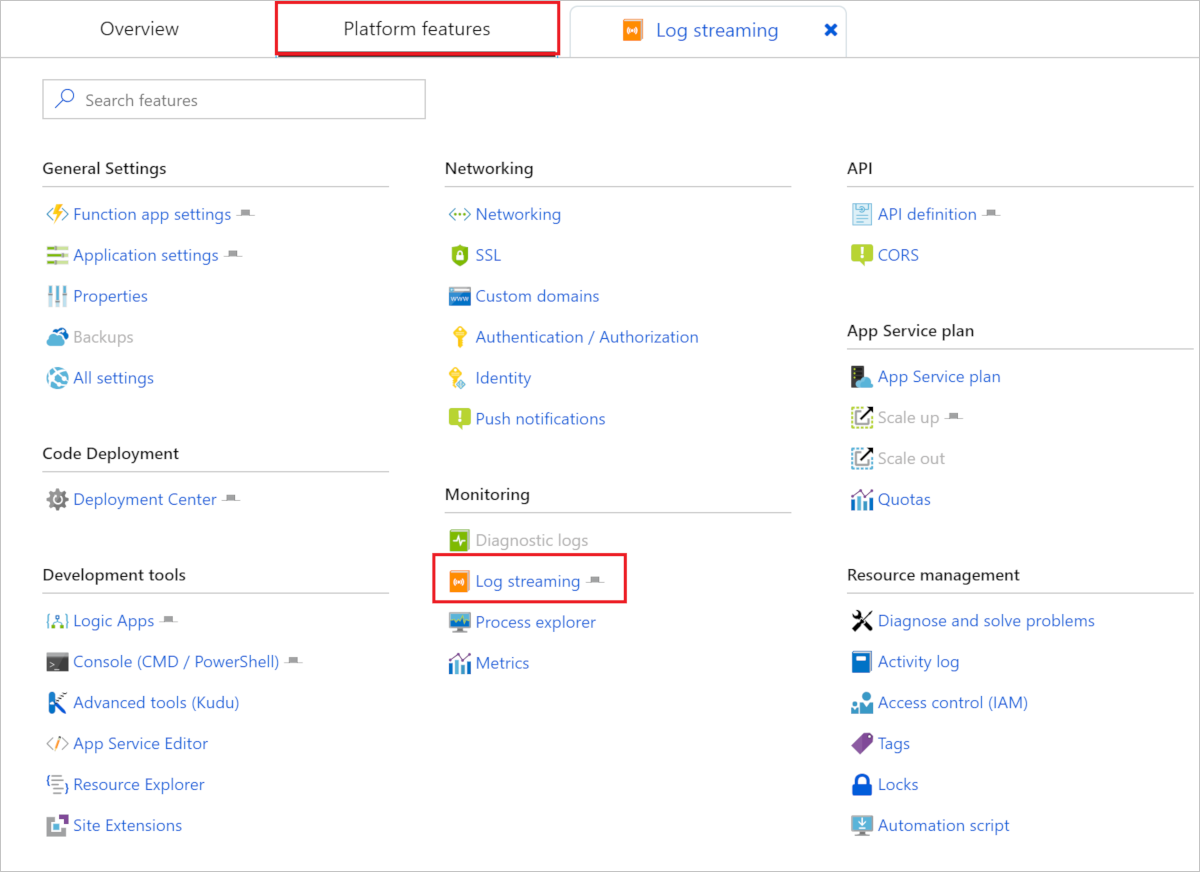
Log streams can be viewed both in the portal and in most local development environments. The way that you enable and view streaming logs depends on your log streaming method, either Live Metrics or built-in.
To view the Live Metrics Stream for your app, select the Overview tab of your function app.
When you have Application Insights enabled, you see an Application Insights link under Configured features. This link takes you to the Application Insights page for your app.
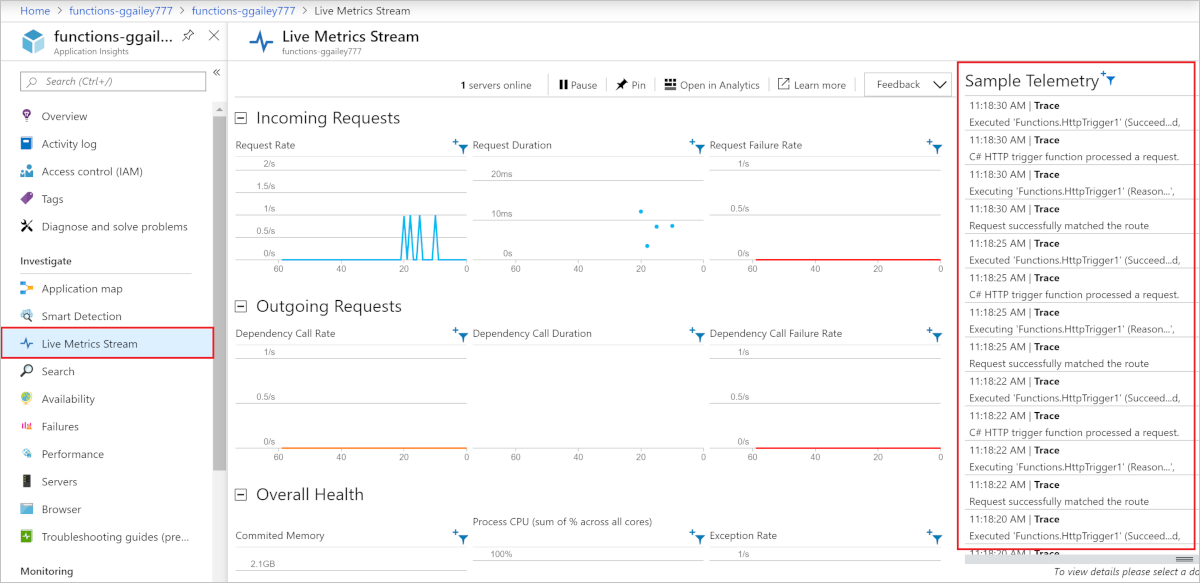
In Application Insights, select Live Metrics Stream. Sampled log entries are displayed under Sample Telemetry.