Cloud monitoring service level objectives
This article is part of a series in the cloud monitoring guide.
In the below sections, you learn about the fundamental principles of service level objectives, and how to implement and apply them.
Overview
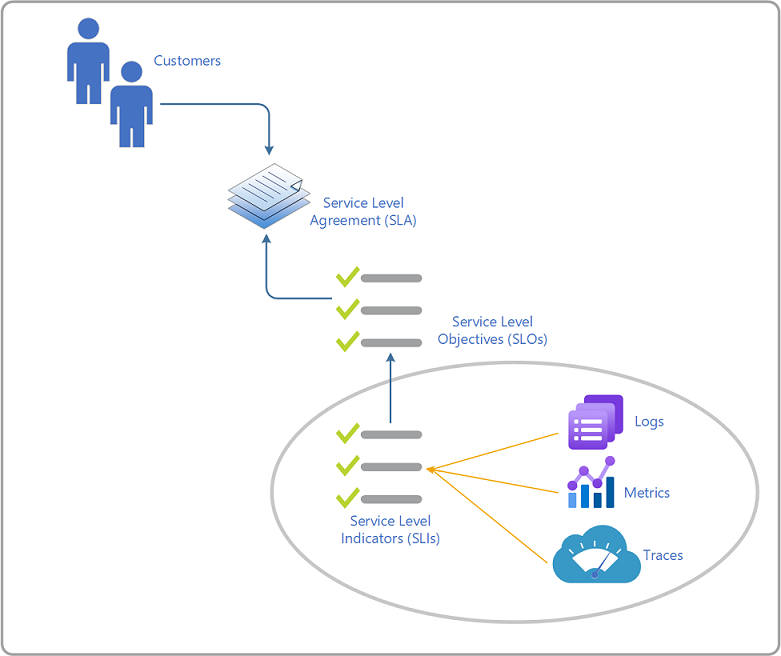
Service level objectives (SLOs) are measurable goals for key customer-centric service level indicators (SLIs). They measure your customer's experience of a business or infrastructure workload and determine whether the business's service provider meets the promises made in a formally negotiated service level agreement (SLA) or informal agreement between all parties.
As a service broker, you rely on Microsoft's commitment to the reliability of services as defined in Microsoft's service level agreements for Azure services. This allows you to focus on your responsibilities in the service chain, such as synthetic monitoring, network connectivity, and security and compliance.
Terminology
Below are the definitions for each of these terms and a brief description. These definitions are taken from Google's SRE Handbook.
| Term | Description |
|---|---|
| Service level agreement (SLA) | Usually a binding commitment between a service provider and a customer. An agreement typically includes consequences of missing the SLO targets. Particular aspects of the service are quality, availability, and responsibilities as agreed between the service provider and the service consumer. |
| Monitoring | The practice of collecting quantitative real-time data about services and systems. |
| Metrics | Measures relevant service behavior and can be aggregated into service level indicators (SLIs), which are processed and aggregated to measure the current operational state of a service and quantify its behavior. SLIs are the main and real-time indicators of the current health of a service. |
| Logs | Starts with the code and reports information about an individual execution of a code path or discreet event. Use this information to help troubleshoot and work towards identifying root cause issues that impact the customer experience and service reliability measured by SLIs/SLOs. |
| Service level objective (SLO) | A target value for the service level, as measured by service level indicators (SLIs), that sets expectations about how well a service performs. SLOs specifically track end-to-end customer experience. To establish good SLOs, you typically start by defining the desired experience and then instrument the service code to measure that experience (collect relevant SLIs) and set the target of how you meet customer expectations or not. |
| Service level indicator (SLI) | A metric that quantifies the quality or reliability of the service. At a minimum, four common SLIs are evaluated: availability, latency, throughput, and error rate. |
| Availability | Generally refers to the measurable or observable percentage of time a system is operational and functional. You measure availability as a customer-facing target for continuity of experience, which is affected by one or more reliability issues (and other failure modes related to configuration changes, updates applied, and more). |
| Error budget | The percentage of your remaining buffer regarding your SLO. Error budgets are the tool DevOps, and IT uses to balance service reliability with the pace of innovation. |
The purpose of SLOs
SLOs serve many essential purposes in the development and operations of cloud workloads, including:
- Near real-time (NRT): To give an NRT-view of the health of a service as experienced by a customer.
- Reducing time-to-notify (TTN): Drive automated notification of service issues to customers, significantly reducing time to notify (TTN).
- Primary signal to customers: Act as a primary signal for deployment operations, driving automated rollback if issues occur, thus exposing fewer customers to potential issues.
- Change verification: Provide validation that changes achieved the expected customer experience improvement.
- Determine priorities: Help teams understand whether to build features or work on reliability.
- Service health insights: Enable objective, customer-focused discussions about service health.
- Reduce time to analyze: Speed up mitigation and root cause analysis (RCA) of customer issues by directing focus to the responsible service.
- Architectural dependencies: Act as an essential input into architectural decisions when services take dependencies.
- Builds trust: Provide a shared understanding of health measures, which builds trust between teams.
- Bring transparency: Expose the same SLIs we use to run our business to our customers so they can run theirs.
- Single pane of glass: Enable a horizontal single pane of glass for the services & their dependencies and breakdown silos.
By using SLOs to drive your engineering process, DevOps and IT can get an early understanding of the health of the application or infrastructure service they build or migrate in Azure. This can then be used to drive both the human and the automated decisions that need to be made about the reliability of these services. This transformation in engineering practice will significantly impact the reliability of those services in the near term.
How to define SLOs?
The objective of an SLO is to obtain clear signals that accurately measure quality from the customer's perspective. Each service team creates a small set of Service Level Objectives (SLOs) that define the allowable range for the most important measurable metrics of the service, as experienced by the service consumer. An SLO is a defined numeric goal for a metric emitted by a service. Metrics associated with this goal can be monitored to determine whether the service is healthy.
For example, here is a simplified example of an SLO for an internal time-tracking web-based application - Requests in the last 5 minutes are served in under 1000 milliseconds at the 99th percentile.
The metrics are aggregations of time series data called Service Level Indicators (SLIs). Where the SLIs are gathered matters a lot. In the above example, if the customer interacts with the service using an API, measuring system latency and time to process requests are accurate SLIs. However, if the customer interacts with the service using a web portal, then the total time to service the request should also include the JavaScript performance of the web page.
The focus for service owners is to determine the following:
- Which scenarios are critical indicators of service health from the perspective of the customer,
- Where to gather the SLIs so that they are as close to the customer experience as possible, and
- What should the SLOs be for these SLIs?
SLOs can be defined with a gradual approach to drive achievement, or it's prescribed directly by the business. You use the SLOs defined by a service to make architectural decisions about how you're building them. Therefore, it is essential to carefully choose which scenarios to measure and what time frame to measure them over. To summarize, an SLO is composed of the following values:
- An SLI. For example, the proportion of sufficiently fast requests, measured from the load balancer, is less than 400 ms.
- A duration. The time period in which a metric is measured.
- A target. For example, a target percentage of fast requests to total requests (such as 90%) that you expect to meet for a given duration.
Types of SLOs
If you look across the industry, there are two types of SLOs:
Service-centric SLOs - These SLOs are tactical goals that teams define to improve the quality of their service over time gradually. They are designed to be pragmatic goals achievable in an engineering milestone. For example, if a service is currently achieving 99.7% availability, the team could set a goal to reach 99.9% availability in the next quarter.
Customer-centric SLOs - These SLOs define the ideal future state or goal. At this point, further investments in quality would be deemed unnecessary because you are fully meeting the customers' expectations.
For example, if your customer expects that a business or infrastructure service you operate provides 99.99% availability, and the service currently only achieves 99.8% availability, the customer-centric SLO is still 99.99%.
Defining proper SLOs takes time. The first step is to talk to your customers and understand what your users want from the service to derive a small selection of indicators and document it. Learn the scenarios and tolerances for how they use your service and what your service needs to deliver to run their business successfully. This is commonly an iterative experience, with their expectation ranging from I want 100% availability under all conditions, with no impact to our revenue stream, through managing wildly variant expectations between customer segments.
Monitoring approaches that look only at service (or service instance) health are vulnerable to missing customer experience issues at both ends of the spectrum; service health does not always correlate to the quality of the customer experience. This is because there are different behavior characteristics between an Azure PaaS and SaaS service, the configuration of those Azure services, how and where (that is, which region) their resources are deployed, and the addition of your custom code/logic, which adds further complexity.
When defining an SLO, it's important to remember that your cloud provider(s) are a dependency on your SLA. Account for the service level agreements specified for each one of their services. For Azure, see Service Level Agreements (SLA) for Online Services
How do you define SLIs?
An SLI specification is a formal statement of your users' expectations about one particular reliability dimension for your service, like latency or availability.
Start simple by selecting the right metrics to measure and collect, and don't overcomplicate it by collecting too many metrics that aren't meaningful. Ensure that the SLIs you define have a direct relationship to the customer experience. This is why it is essential to understand the perspective of the users to start with only a few indicators.
If your service is resource constrained in some way, such as memory or CPU, then its saturation can also be an excellent SLI. However, saturation should not be used as an SLO since it does not directly correspond to a poor user experience (a service can have high memory utilization, but users are unaffected).
We recommend that you create up to three indicators. More than three indicators rarely add significant value. Often, excessive numbers of indicators could mean you include symptoms of primary indicators. Traffic and saturation should be additional to those three main indicators, as those describe service load and support on interpretation of other service indicators.
How do you implement SLOs?
The SLIs that matter most are the ones that most clearly represent an impact on your service from your customer's perspective. For many services, this includes latency, throughput, error rate, and availability. If your service has any special considerations that impact the customer experience, then SLIs for those areas should also be measured. For example, the end-to-end processing latency for a messaging service is a direct indicator of the customer experience and should be covered by an SLI.
SLO examples
Human Resources is interested in modernizing its internal time-tracking web-based application and hosting it in the Azure cloud with the help of enterprise IT. They want the service to continue reaching all users in the organization, so they are interested in the following:
- Usage reports and how many users are using the service over time.
- Regular health monitoring such as availability, performance, security, and compliance (service warranty).
- Cost, such as the monthly cost of a service.
- Cybersecurity, in terms of controlling access to resources and data by following a Zero Trust security strategy.
As we see from these examples above, the SLO/SLI categories and examples are necessary to define early in the service design. That's not any different at all from the on-premises services you've been building.
SLO Tables/SLI categories
The following examples are by no means an exhaustive list. While reliability and maintainability SLOs are hallmarks of systems for decades, you can define SLOs that include measures for cybersecurity, quality and user experience, and cost.
Services
Typical high-level measures of a service or system are usually codified in service agreements. Most modern agreements measure availability as the key SLO and use simple downtime measures based on key workload items or units of production, such as authentication tokens, mailboxes, or storage accounts.
| Category | Description | Example |
|---|---|---|
| Availability | Simple downtime or Mean Time Between Maintenance or operational availability (MTBM/(MTBM+MDT)) | 99.99% over a monthly period |
| Capacity | Ensure adequate, maximum, or optimum business and service performance, throughput, storage, people, bandwidth, demand, resources, and service functions. Includes labor and time limits to serve as triggers. | % Utilization (CPU, storage, memory, latency, throughput, scaling) |
| Security | Active threats and vulnerabilities (internal and external) that could or are causing harm to the business, assets, and data. | Detection of HAFNIUM Threat |
| Compliance | Updates, servicing levels, hardening compliance, desired configuration drift | 99.5% serviced updates on all assets |
| Continuity | Ability to survive and recover from large disasters and external events. | Time (reconstitution) |
| Quality of Service (QoS) | Characteristics of the users actual experience over time. | Teams call quality - received packet loss < 2% |
Reliability
Reliability, the classic SLO, implies the degree of the dependability, durability, and quality over time, of systems, services, resources, or components to failure and failovers, with management effort applied to address failure (such as building in more redundancy or adding a content delivery network) to increase operating time or availability. It could also mean the accuracy, fidelity, integrity, and trustworthiness of data used to measure SLOs. It can mean the classic probability that a system will perform its intended function under specified conditions, such as temperature stress. Resilience also includes built-in design factors or features that provide adaptability such as scaling, cool down, load-balancing, recovery, unpredictable demand, degraded performance under severe stress, and design for continuity in larger disasters (usually a separate SLO).
| Category | Description | Example |
|---|---|---|
| Failure Rate | Number of failures over the total operating hours | 5 failures in 973 hrs our .00514 |
| Mean Time Between Failure (MTBF) | MTBF is the inverse of failure rate | 194.6 hours |
Maintainability
Combine support SLOs for IT service management processes such as incident and problem management, along with reliability SLOs, so that availability measurement can be achieved.
| Category | Description | Example |
|---|---|---|
| Service Incident Performance | By category or product or priority. | Time and cost measures for each phase of the incident lifecycle. |
| Security Incident Performance | By category or product or priority. | Time and cost measures for each phase of the incident lifecycle. |
| Component Mean Time To Repair (MTTR) | From event detection through restoration or remediation. | |
| Mean Time Between Maintenance (MTBM) | Mean or average time between all maintenance actions, including preventative actions where normal production work occurs. | See Maintenance Delay Time |
| Maintenance Delay Time (MDT) | Total time from detection to recovery, including logistics and administrative delay. | Time to replace the hardware to include ordering, shipment, and installation. |
Customer experience
| Category | Description | Example |
|---|---|---|
| Throughput | The amount, rate, or speed of workload or productive load placed on a system over time. | Transactions per unit of time. |
| Error rate | The number of total errors as a percentage. | % Security events |
| Latency | A measure of time or delay from input to output, movement of work through a process, or from application to user. | Average seconds. |
Others
| Category | Description | Example |
|---|---|---|
| Cost | Measure expenditure, billing, and invoices by service, component, or time. | Capital Expense or operating expense |
| Coverage | Percentage of components, systems, and services under management (compliance) | Compliance |
| Feed reliability | Failures of heartbeat, connectors, changes, and more. | Tracking changes in mission-critical company data. |
| Productivity | Effectiveness to productively accomplish tasks | Labor, time by employee, analyst productivity. |
Considerations
Ensure access. Ensure managers and other personas in the organization are granted access to the visualizations available in Azure Monitor or from other Azure services, especially Azure SaaS and PaaS, to avoid duplicating them.
Ensure monitoring coverage or total asset visibility. Ensure agents, emitted logs, tables, and queries for all assets that need to be managed and secured, and identify "blind spots" or gaps in coverage to ensure realism in SLOs.
Get the correct data in front of the right consumers. Ensure consumers of SLOs and SLIs can interpret the underlying data to build trust and guide decisions using the information gained from data.
Make reasonable promises. When setting SLOs as targets especially when cost management is essential, ensure actual system performance is not overly performing nor under-delivering, or adjust the target to manage customer expectations.
Account for unforeseen external events. Develop continuity plans and risk assessments to account for events not under your control, such as weather, power outages, or disasters.
Account for Change. Ensure SLOs account for alterations to service or changes to technical reliability, throughput, quality, and maintainability - such as reductions in support staff.
Provide a balanced set of SLOs. Ensure a range of SLOs that provide a balanced or 360-degree perspective on the service or system and a focus on reliability.