Bemærk
Adgang til denne side kræver godkendelse. Du kan prøve at logge på eller ændre mapper.
Adgang til denne side kræver godkendelse. Du kan prøve at ændre mapper.
This article guides you through the process of customizing settings in the Azure Data Explorer web UI. You learn how to export and import environment settings, highlight error levels, and change datetime to specific time zone. It can help you protect your work environment and relocate it to other browsers and devices, as well as make it easier to identify errors.
Prerequisites
- A Microsoft account or a Microsoft Entra user identity. An Azure subscription isn't required.
- Sign in to the Azure Data Explorer web UI.
Go to the settings
Select the settings icon on the top right, to open the Settings window.
![]()
Set query recommendations
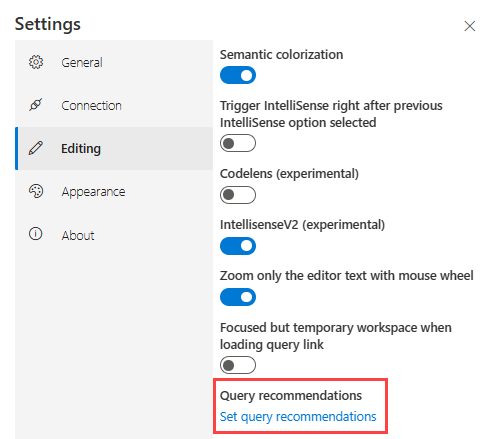
The query editor provides suggestions and warnings as you write your queries. The suggestions and warnings might be related to performance, correctness, or general best practices. To customize your suggestions and warnings, do the following steps:
In the Settings > Editing window, select Set query recommendations.
In the Set query recommendations dialog box, turn on or off specific Suggestions and Warnings. Use the Activate suggestions and Activate warnings at the top of the respective tabs to turn on or off all of the suggestions or warnings at once.
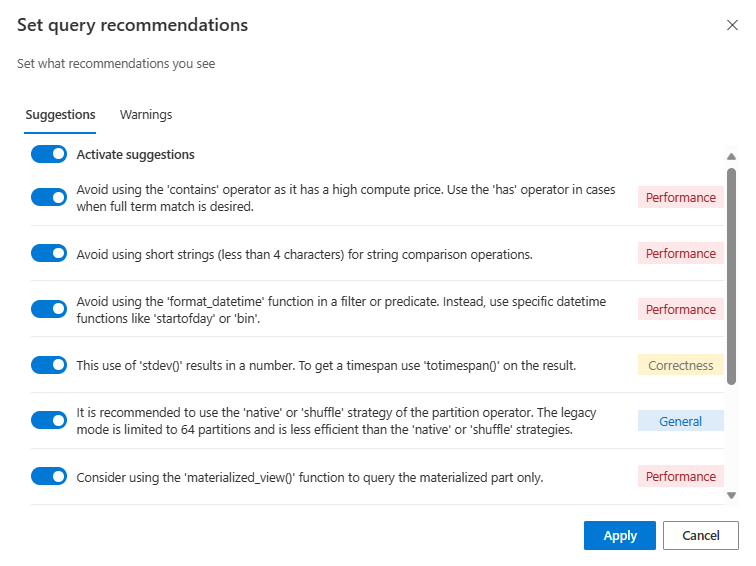
Select Apply to save the changes.


Adjust timeout limits
Query and admin commands have a default timeout limit. To extend or reduce these limits, do the following steps:
In the Settings > Connection window, adjust the Query timeout or the Admin command timeout.
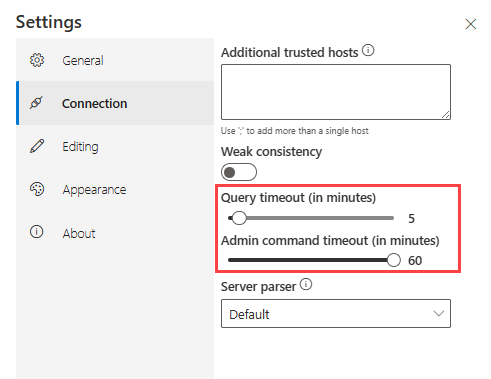
The changes are automatically saved.

To learn how to set timeout limits outside of the web UI, see Set timeout limits.
Export and import environment settings
The export and import actions help you protect your work environment and relocate it to other browsers and devices. The export action exports all your settings, cluster connections, and query tabs to a JSON file that can be imported into a different browser or device.
Note
To sync your profile data to the cloud, see Access your Azure Data Explorer web UI data anywhere. Once enabled, exporting, and importing is no longer available.
Export environment settings
In the Settings > General window, select Export.
The adx-export.json file is downloaded to your local storage.
Select Clear local state to revert your environment to its original state. This setting deletes all your cluster connections and closes open tabs.
Note
Export only exports query related data. No dashboard data is exported within the adx-export.json file.
Import environment settings
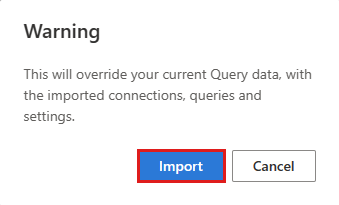
In the Settings > General window, select Import. Then in Warning pop-up, select Import.
Locate your adx-export.json file from your local storage and open it.
Your previous cluster connections and open tabs are now available.
Note
Import overrides any existing environment settings and data.
Highlight error levels
Azure Data Explorer tries to interpret the severity or verbosity level of each row in the results panel and color them accordingly. It does so by matching the distinct values of each column with a set of known patterns (Warning, Error, and so on).
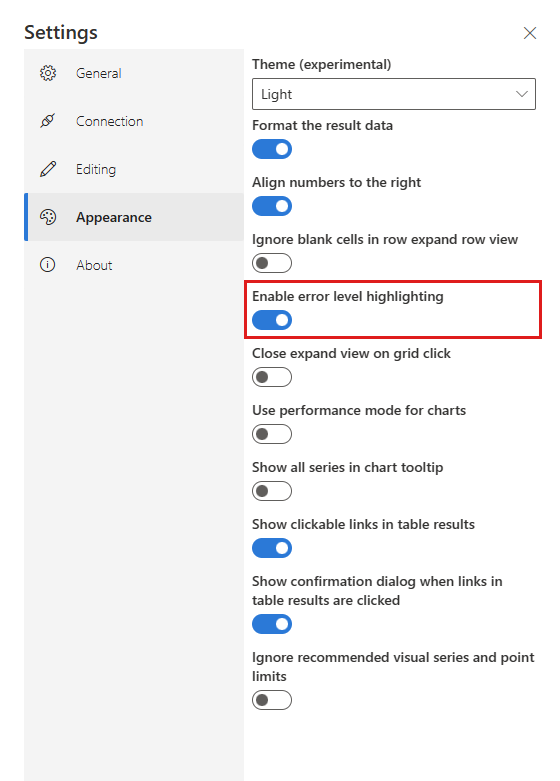
Turn on error level highlighting
To turn on error level highlighting:
Select the Settings icon next to your user name.
Select the Appearance tab and toggle the Enable error level highlighting option.
| Error level color scheme in Light mode | Error level color scheme in Dark mode |
|---|---|
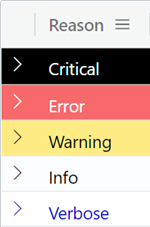
|
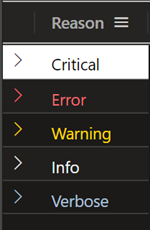
|
Column requirements for highlighting
For highlighted error levels, the column must be of data type int, long, or string.
- If the column is of type
longorint:- The column name must be Level
- Values can only include numbers between 1 and 5.
- If the column is of type
string:- The column name can optionally be Level to improve performance.
- The column can only include the following values:
- critical, crit, fatal, assert, high
- error, e
- warning, w, monitor
- information
- verbose, verb, d
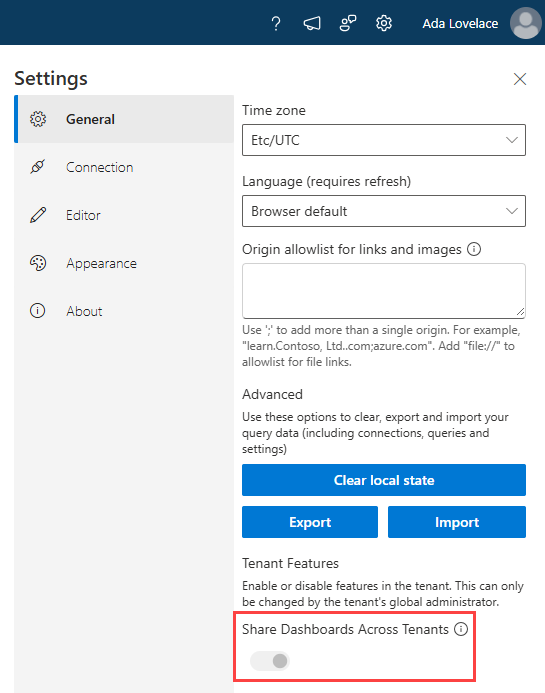
Enable cross-tenant dashboard sharing
To enable cross-tenant sharing, a tenant admin must enable it in the Azure Data Explorer WebUI settings. This setting allows you to share dashboards with users in a different tenant.
For more information, see Grant access to users in a different tenant.
Under Settings > Share Dashboards Across Tenants, toggle to On.
Important
If a tenant admin enables cross-tenant sharing and later disables cross-tenant sharing, all dashboards shared while the feature was active remain accessible.