Bemærk
Adgang til denne side kræver godkendelse. Du kan prøve at logge på eller ændre mapper.
Adgang til denne side kræver godkendelse. Du kan prøve at ændre mapper.
Microsoft Purview provides organizations with visibility into where sensitive information is stored, helping prioritize at-risk data for protection. Integrate Microsoft Purview with Microsoft Sentinel to help narrow down the high volume of incidents and threats surfaced in Microsoft Sentinel, and understand the most critical areas to start.
Start by ingesting your Microsoft Purview logs into Microsoft Sentinel through a data connector. Then use a Microsoft Sentinel workbook to view data such as assets scanned, classifications found, and labels applied by Microsoft Purview. Use analytics rules to create alerts for changes within data sensitivity.
Customize the Microsoft Purview workbook and analytics rules to best suit the needs of your organization, and combine Microsoft Purview logs with data ingested from other sources to create enriched insights within Microsoft Sentinel.
Prerequisites
Before you start, make sure you have both a Microsoft Sentinel workspace and Microsoft Purview onboarded, and that your user has the following roles:
A Microsoft Purview account Owner or Contributor role, to set up diagnostic settings and configure the data connector.
A Microsoft Sentinel Contributor role, with write permissions to enable data connector, view the workbook, and create analytic rules.
The Microsoft Purview solution installed in your Log Analytics workspace enabled for Microsoft Sentinel.
The Microsoft Purview solution is a set of bundled content, including a data connector, workbook, and analytics rules configured specifically for Microsoft Purview data. For more information, see About Microsoft Sentinel content and solutions and Discover and manage Microsoft Sentinel out-of-the-box content.
Instructions for enabling your data connector also available in Microsoft Sentinel, on the Microsoft Purview data connector page.
Start ingesting Microsoft Purview data in Microsoft Sentinel
Configure diagnostic settings to have Microsoft Purview data sensitivity logs flow into Microsoft Sentinel, and then run a Microsoft Purview scan to start ingesting your data.
Diagnostics settings send log events only after a full scan is run, or when a change is detected during an incremental scan. It typically takes about 10-15 minutes for the logs to start appearing in Microsoft Sentinel.
To enable data sensitivity logs to flow into Microsoft Sentinel:
Navigate to your Microsoft Purview account in the Azure portal and select Diagnostic settings.
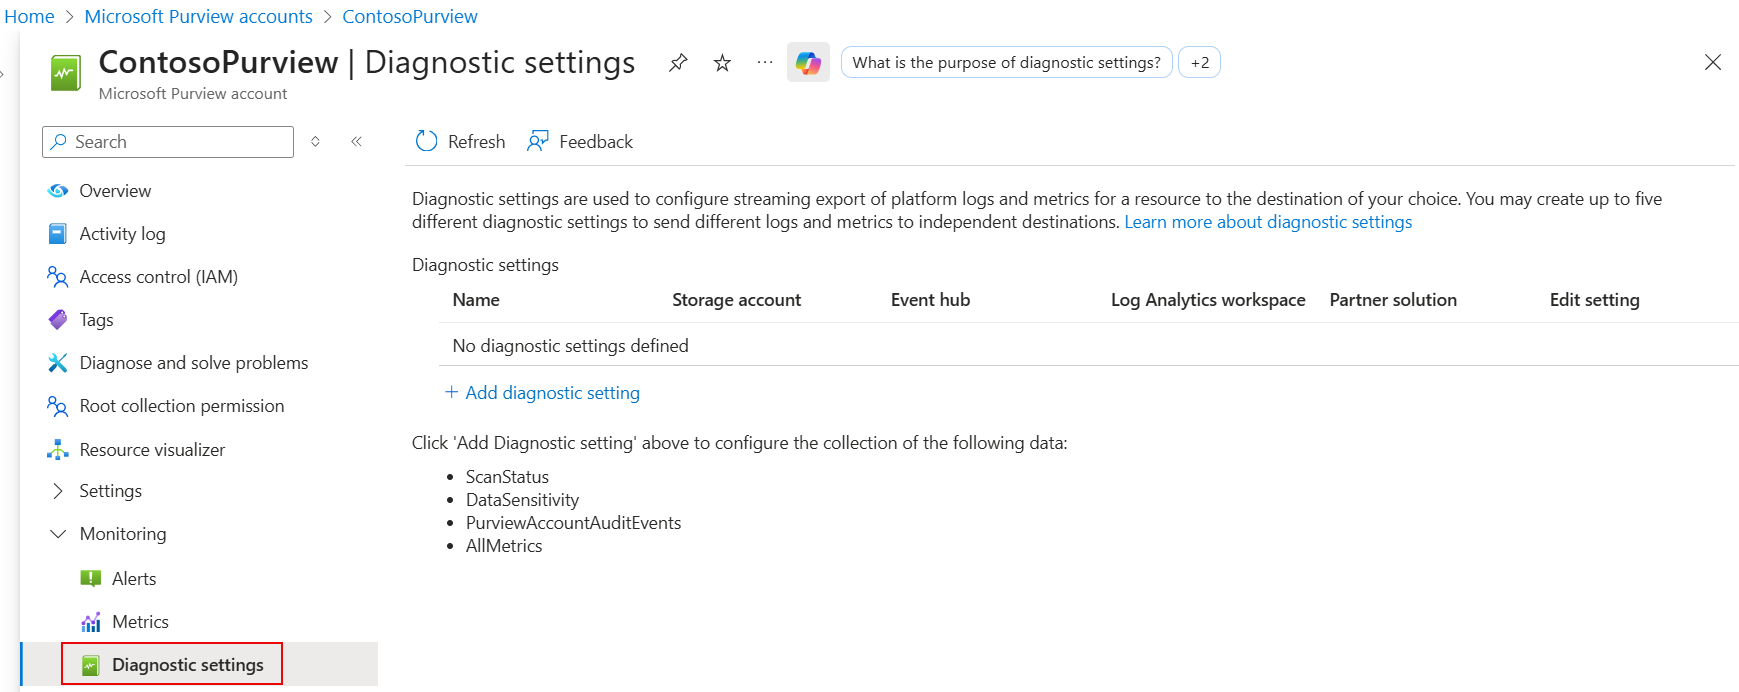
Select + Add diagnostic setting and configure the new setting to send logs from Microsoft Purview to Microsoft Sentinel:
- Enter a meaningful name for your setting.
- Under Logs, select DataSensitivityLogEvent.
- Under Destination details, select Send to Log Analytics workspace, and select the subscription and workspace details used for Microsoft Sentinel.
Select Save.
For more information, see Connect Microsoft Sentinel to other Microsoft services by using diagnostic settings-based connections.
To run a Microsoft Purview scan and view data in Microsoft Sentinel:
In Microsoft Purview, run a full scan of your resources. For more information, see Scan data sources in Microsoft Purview.
After your Microsoft Purview scans have completed, go back to the Microsoft Purview data connector in Microsoft Sentinel and confirm that data has been received.
View recent data discovered by Microsoft Purview
The Microsoft Purview solution provides two analytics rule templates out-of-the-box that you can enable, including a generic rule and a customized rule.
- The generic version, Sensitive Data Discovered in the Last 24 Hours, monitors for the detection of any classifications found across your data estate during a Microsoft Purview scan.
- The customized version, Sensitive Data Discovered in the Last 24 Hours - Customized, monitors and generates alerts each time the specified classification, such as Social Security Number, has been detected.
Use this procedure to customize the Microsoft Purview analytics rules' queries to detect assets with specific classification, sensitivity label, source region, and more. Combine the data generated with other data in Microsoft Sentinel to enrich your detections and alerts.
Note
Microsoft Sentinel analytics rules are KQL queries that trigger alerts when suspicious activity has been detected. Customize and group your rules together to create incidents for your SOC team to investigate.
Modify the Microsoft Purview analytics rule templates
In Microsoft Sentinel, open the Microsoft Purview solution, and then locate and select the Sensitive Data Discovered in the Last 24 Hours - Customized rule. On the side pane, select Create rule to create a new rule based on the template.
Go to the Configuration > Analytics page and select Active rules. Search for a rule named Sensitive Data Discovered in the Last 24 Hours - Customized.
By default, analytics rules created by Microsoft Sentinel solutions are set to disabled. Make sure to enable the rule for your workspace before continuing:
Select the rule. In the side pane, select Edit.
In the analytics rule wizard, at the bottom of the General tab, toggle the Status to Enabled.
On the Set rule logic tab, adjust the Rule query to query for the data fields and classifications you want to generate alerts for. For more information on what can be included in your query, see:
- Supported data fields are the columns of the PurviewDataSensitivityLogs table
- Supported classifications
Formatted queries have the following syntax:
| where {data-field} contains {specified-string}.For example:
PurviewDataSensitivityLogs
| where Classification contains “Social Security Number”
| where SourceRegion contains “westeurope”
| where SourceType contains “Amazon”
| where TimeGenerated > ago (24h)
See more information on the following items used in the preceding example, in the Kusto documentation:
For more information on KQL, see Kusto Query Language (KQL) overview.
Other resources:
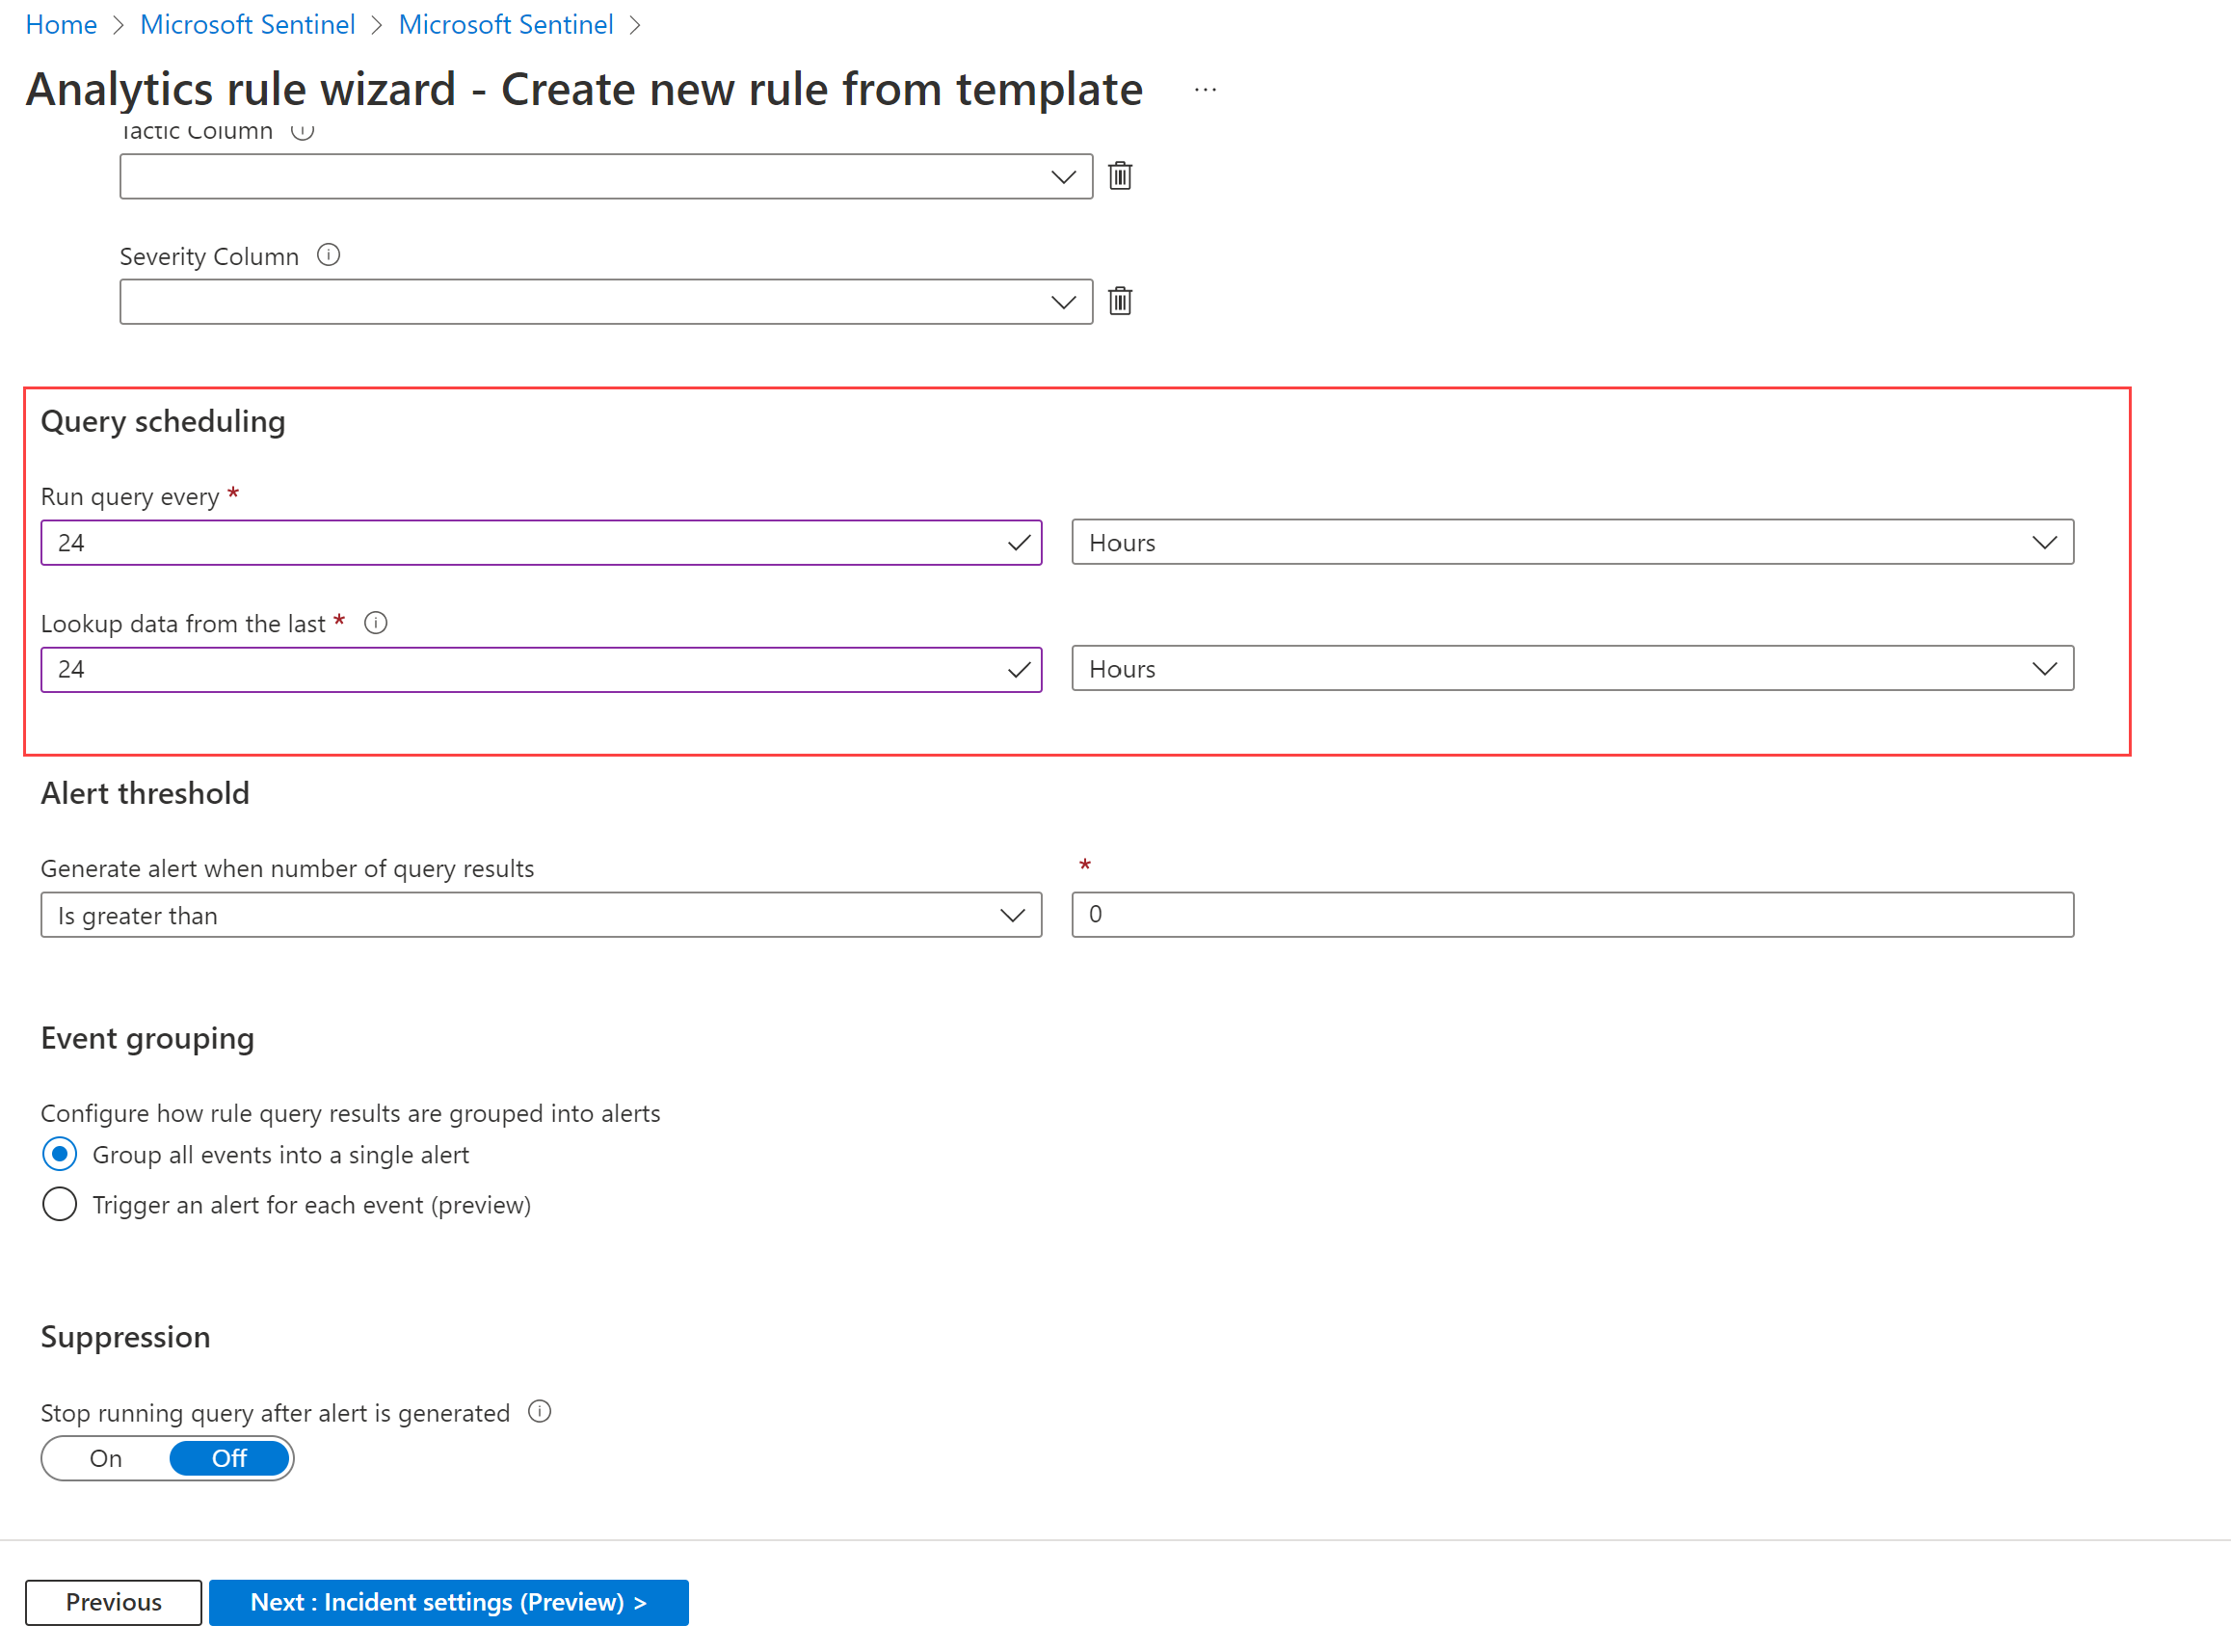
Under Query scheduling, define settings so that the rules show data discovered in the last 24 hours. We also recommend that you set Event grouping to group all events into a single alert.
If needed, customize the Incident settings and Automated response tabs. For example, in the Incidents settings tab, verify that Create incidents from alerts triggered by this analytics rule is selected.
On the Review + create tab, select Save.
For more information, see Create custom analytics rules to detect threats.
View Microsoft Purview data in Microsoft Sentinel workbooks
In Microsoft Sentinel, open the Microsoft Purview solution, and then locate and select the Microsoft Purview workbook. On the side pane, select Configuration to add the workbook to your workspace.
In Microsoft Sentinel, under Threat management, select Workbooks > My workbooks, and locate the Microsoft Purview workbook. Save the workbook to your workspace, and then select View saved workbook. For example:
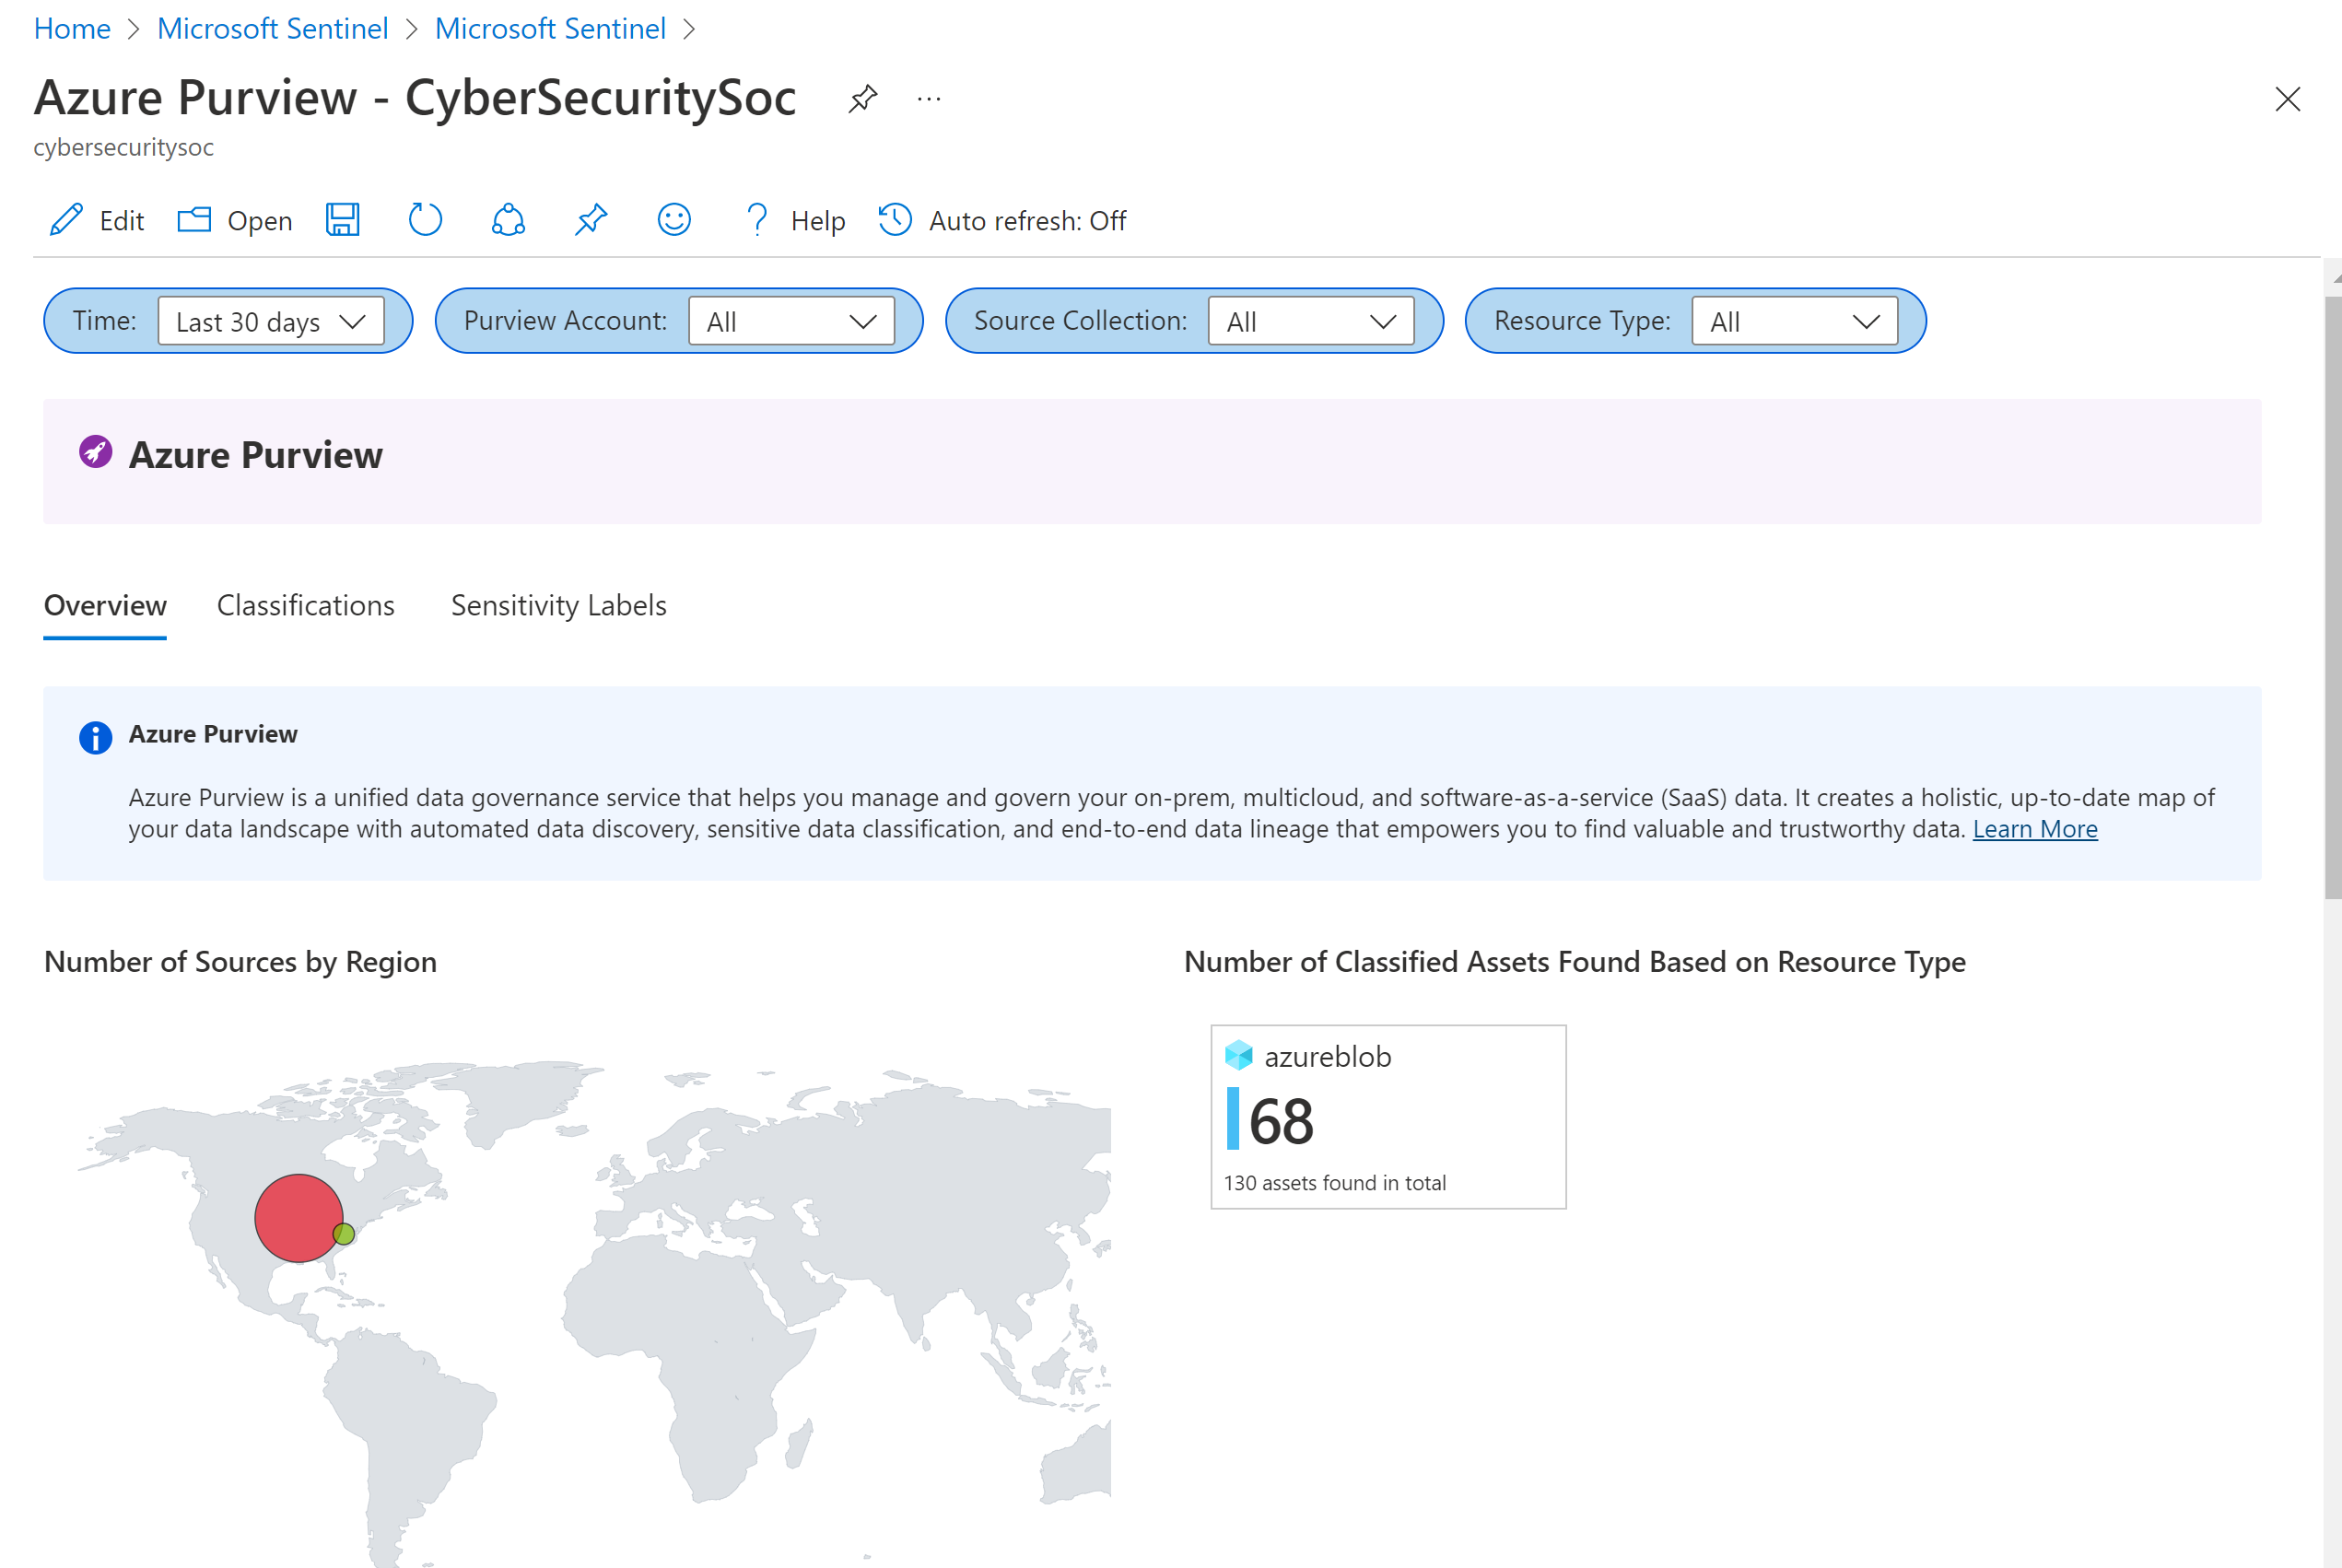
The Microsoft Purview workbook displays the following tabs:
- Overview: Displays the regions and resource types where the data is located.
- Classifications: Displays assets that contain specified classifications, like Credit Card Numbers.
- Sensitivity labels: Displays the assets that have confidential labels, and the assets that currently have no labels.
To drill down in the Microsoft Purview workbook:
- Select a specific data source to jump to that resource in Azure.
- Select an asset path link to show more details, with all the data fields shared in the ingested logs.
- Select a row in the Data Source, Classification, or Sensitivity Label tables to filter the Asset Level data as configured.
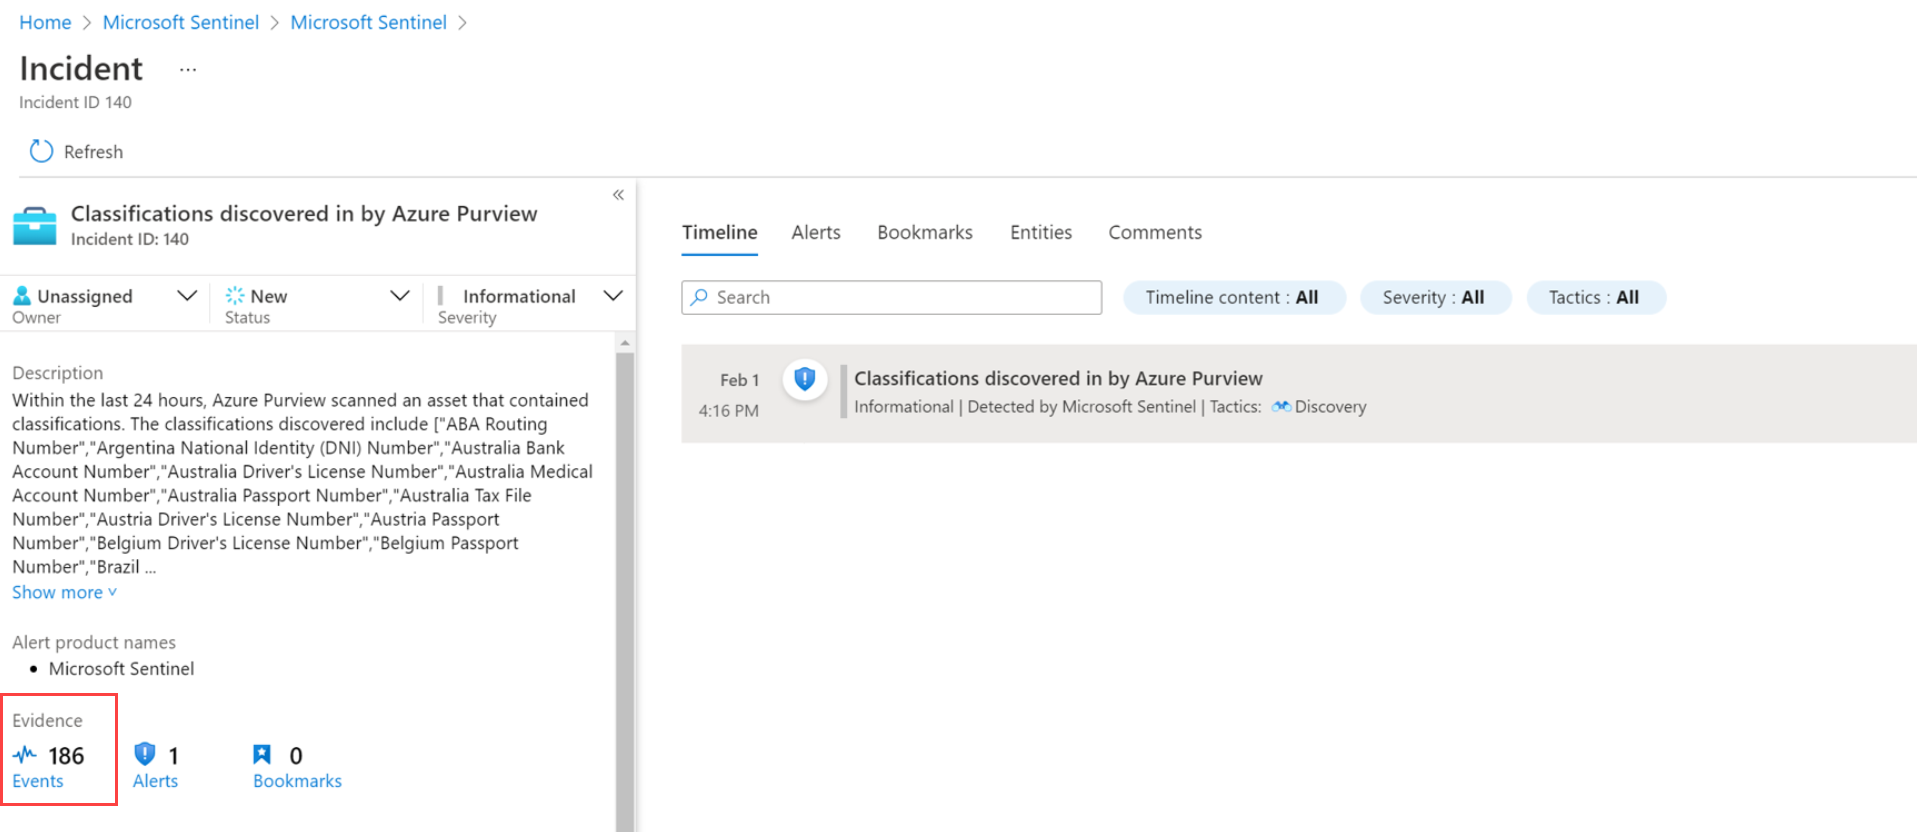
Investigate incidents triggered by Microsoft Purview events
When investigating incidents triggered by the Microsoft Purview analytics rules, find detailed information on the assets and classifications found in the incident's Events.
For example:
Related content
For more information, see: