Monitor workload - Azure portal
This article describes how to use the Azure portal to monitor your workload. This includes setting up Azure Monitor Logs to investigate query execution and workload trends using log analytics for Synapse SQL.
Prerequisites
- Azure subscription: If you don't have an Azure subscription, create a free Azure account before you begin.
- SQL pool: We will be collecting logs for a SQL pool. If you don't have a SQL pool provisioned, see the instructions in Create a SQL pool.
Create a Log Analytics workspace
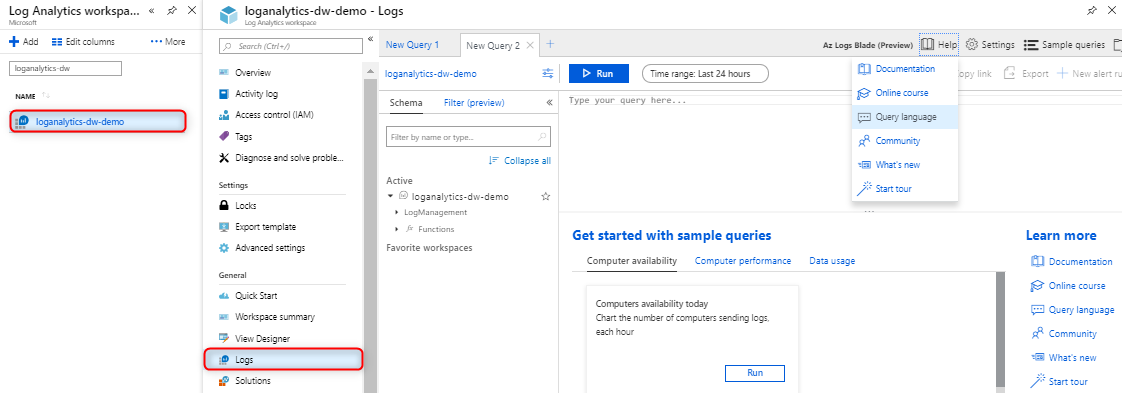
In the Azure portal, navigate to the page for Log Analytics workspaces, or use the Azure services search window to create a new Log Analytics workspace.
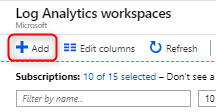
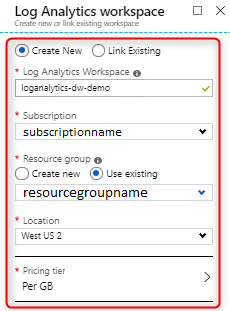
For more information on workspaces, see Create a Log Analytics workspace.
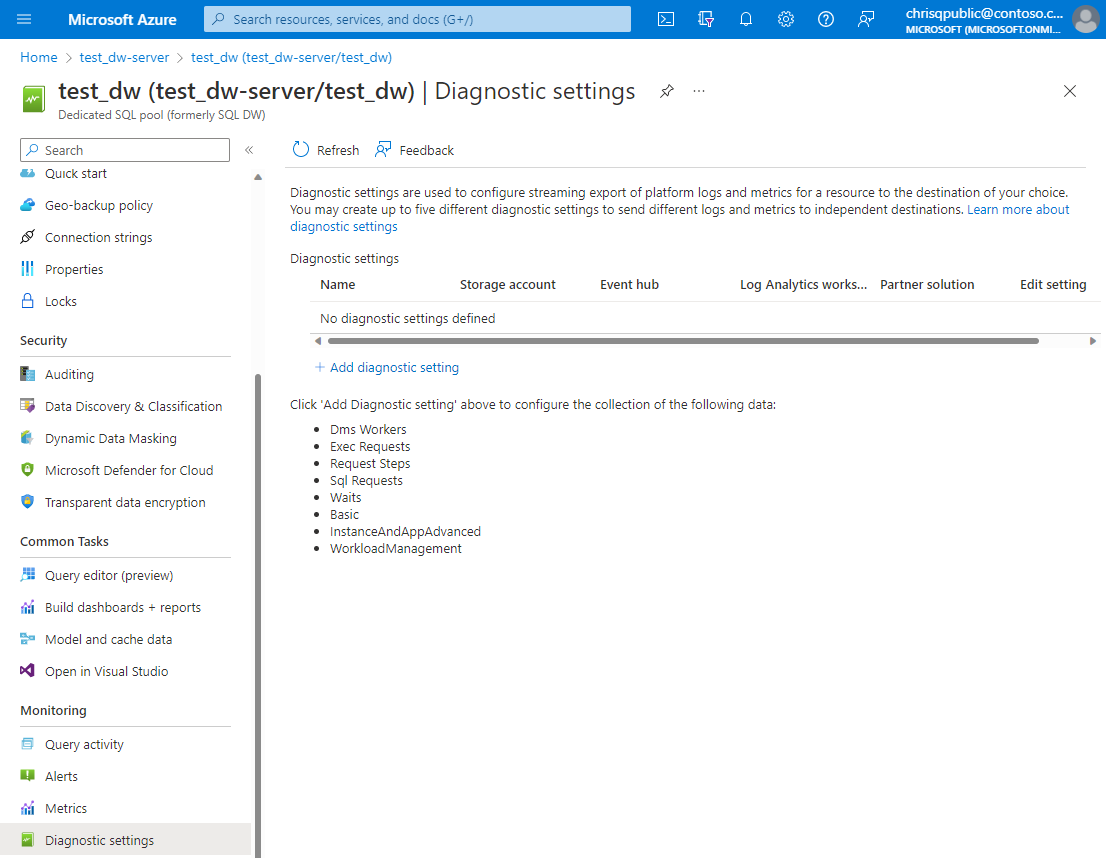
Turn on Resource logs
Configure diagnostic settings to emit logs from your SQL pool. Logs consist of telemetry views equivalent to the most commonly used performance troubleshooting DMVs. Currently the following views are supported:
- sys.dm_pdw_exec_requests
- sys.dm_pdw_request_steps
- sys.dm_pdw_dms_workers
- sys.dm_pdw_waits
- sys.dm_pdw_sql_requests
Logs can be emitted to Azure Storage, Stream Analytics, or Log Analytics. For this tutorial, select Log Analytics. Select all desired categories and metrics and choose Send to Log Analytics workspace.
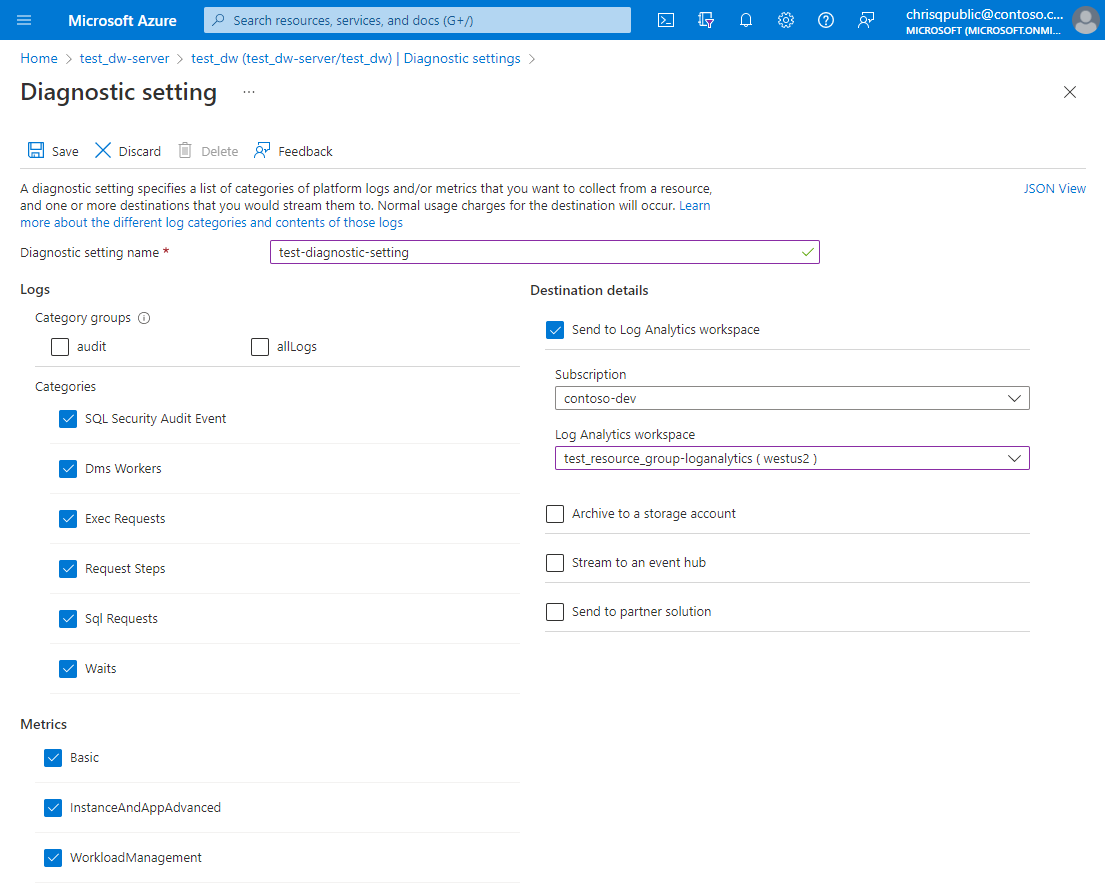
Select Save to create the new diagnostic setting. It may take a few minutes for data to appear in queries.
Run queries against Log Analytics
Navigate to your Log Analytics workspace where you can:
- Analyze logs using log queries and save queries for reuse
- Save queries for reuse
- Create log alerts
- Pin query results to a dashboard
For details on the capabilities of log queries using Kusto, see Kusto Query Language (KQL) overview.
Sample log queries
Set the scope of your queries to the Log Analytics workspace resource.
//List all queries
AzureDiagnostics
| where Category contains "ExecRequests"
| project TimeGenerated, StartTime_t, EndTime_t, Status_s, Command_s, ResourceClass_s, duration=datetime_diff('millisecond',EndTime_t, StartTime_t)
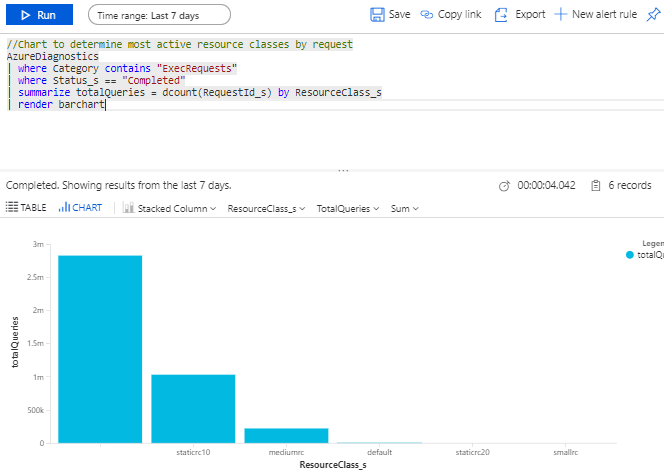
//Chart the most active resource classes
AzureDiagnostics
| where Category contains "ExecRequests"
| where Status_s == "Completed"
| summarize totalQueries = dcount(RequestId_s) by ResourceClass_s
| render barchart
//Count of all queued queries
AzureDiagnostics
| where Category contains "waits"
| where Type == "UserConcurrencyResourceType"
| summarize totalQueuedQueries = dcount(RequestId_s)
Next steps
- Now that you have set up and configured Azure monitor logs, customize Azure dashboards to share across your team.
Feedback
Kommer snart: I hele 2024 udfaser vi GitHub-problemer som feedbackmekanisme for indhold og erstatter det med et nyt feedbacksystem. Du kan få flere oplysninger under: https://aka.ms/ContentUserFeedback.
Indsend og få vist feedback om