Clarity Dashboard Features
Overview
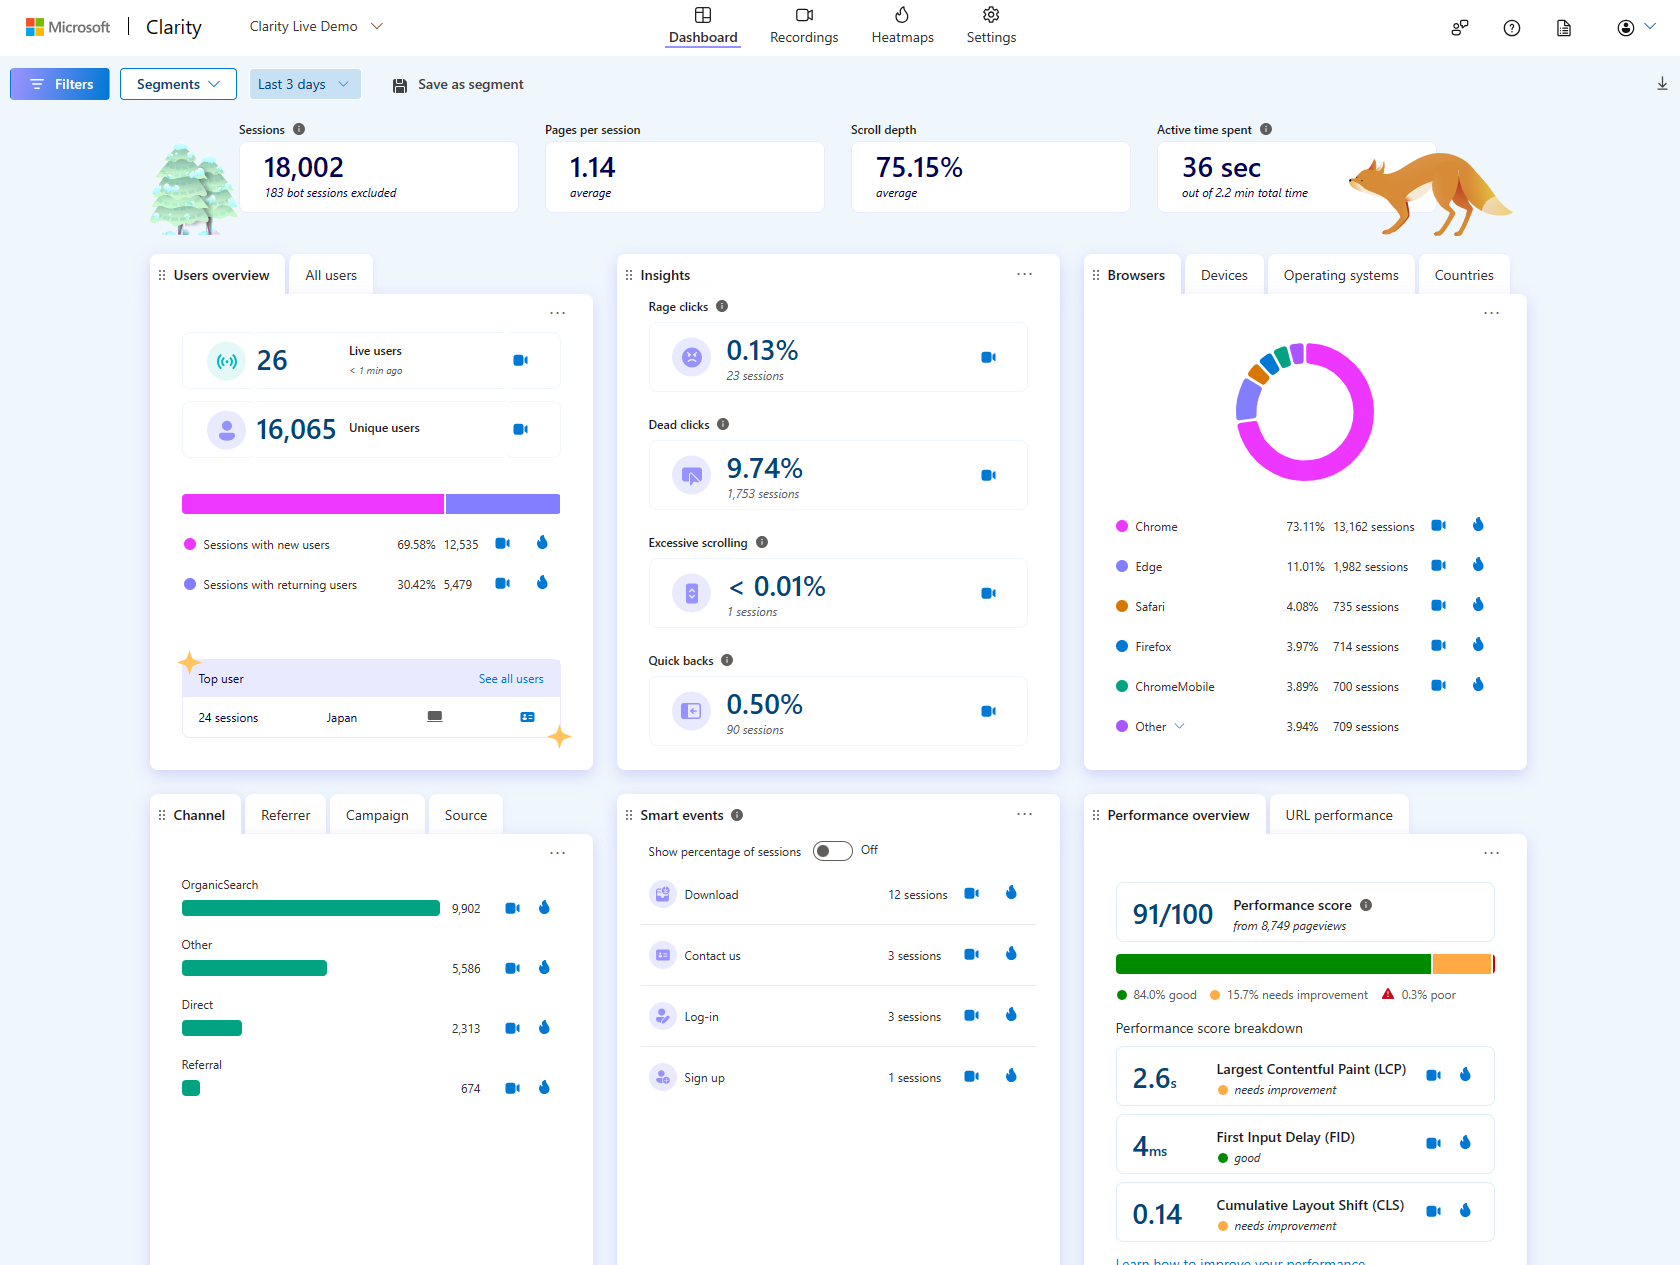
The Clarity dashboard provides aggregate metrics to help you get an overall understanding of the traffic on your site. At a glance, you can see:
- Users who were clicking on nonexistent links.
- Users who scrolled up and down a page searching for something they couldn't readily find.
- Concurrent JavaScript errors that occur across your clients.
- Time a user spends navigating on your site.
The statistics provided can be sliced using filters and segments, which allow you to drill down on specific user behavior patterns. This can provide the basis to make good decisions on modifying your site.
Note
The dashboard displays data based on the user's local machine timezone.
Customize Dashboard
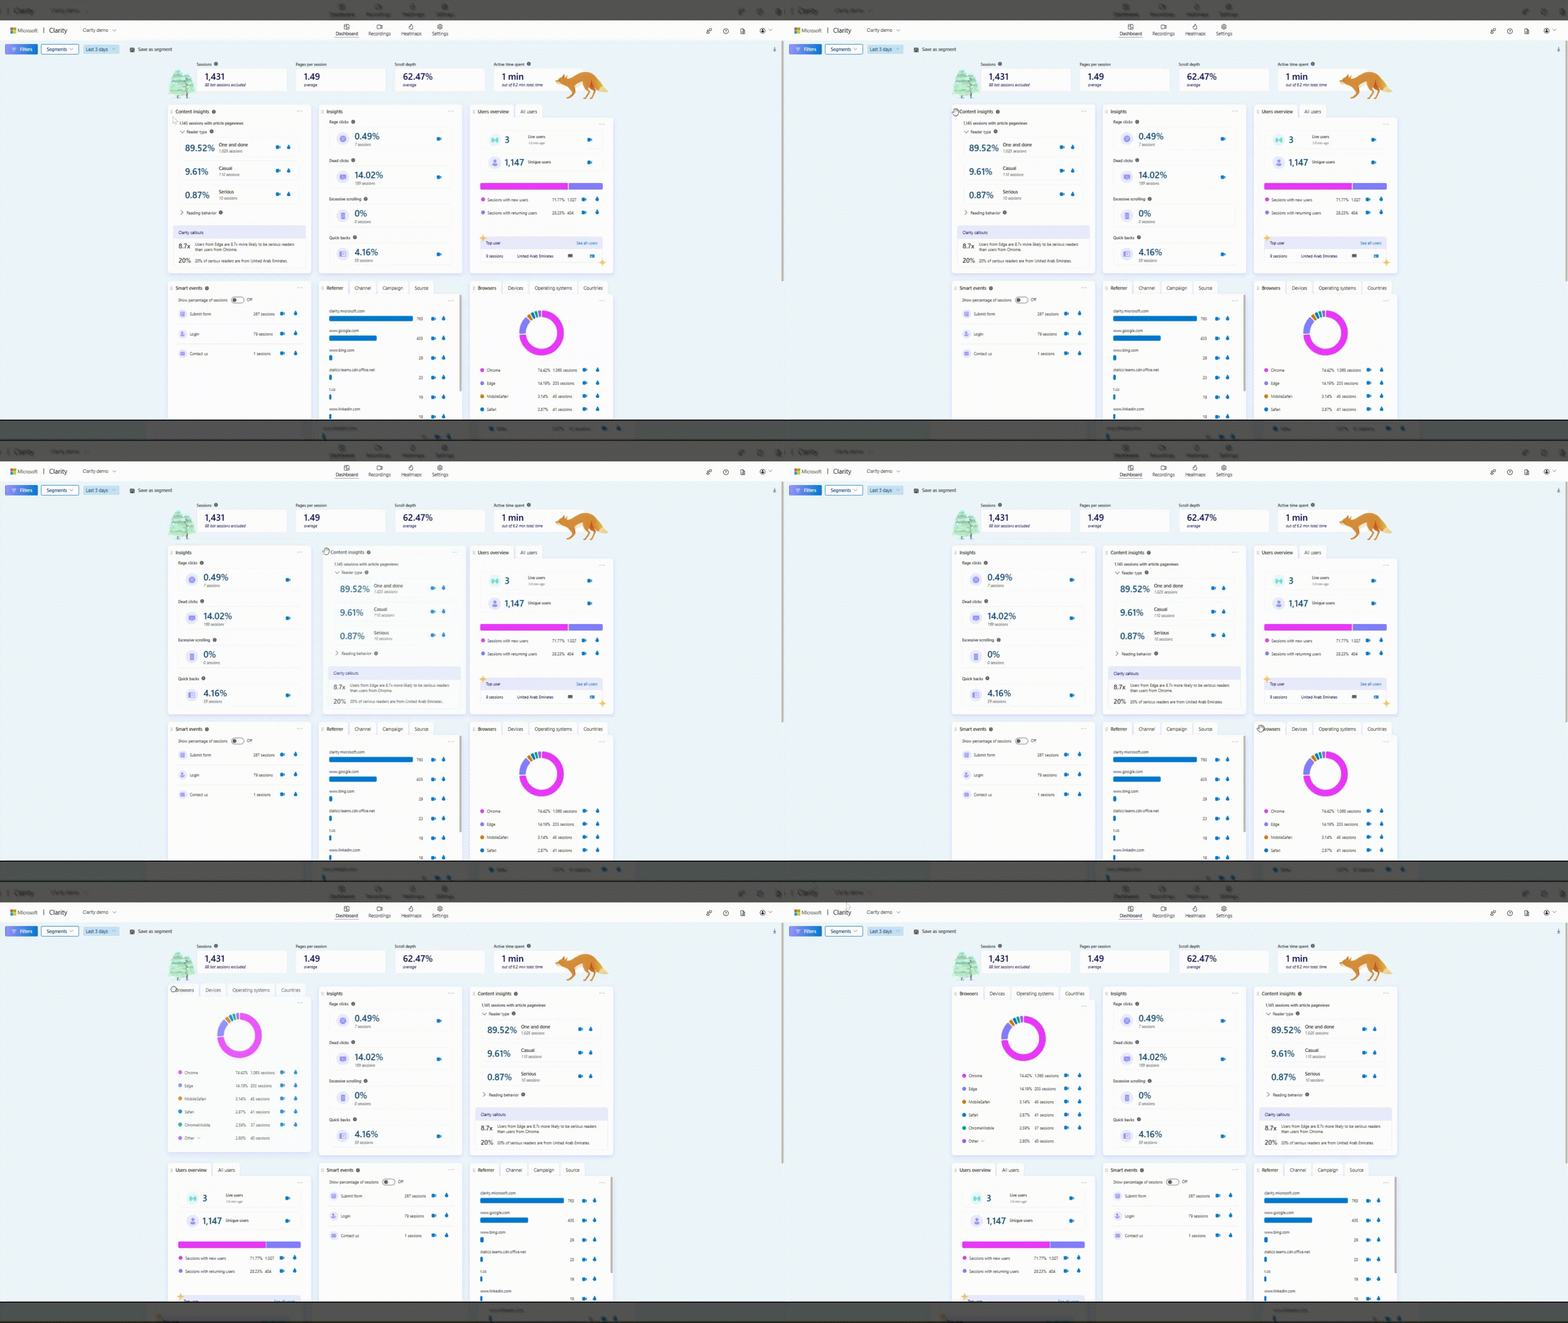
Rearrange cards
The cards on the dashboard are customizable. Choose the hamburger menu icon from the left of the card and drag it to rearrange according to your preferences.
Hide card
Note
When downloading dashboard, hidden cards are not visible.
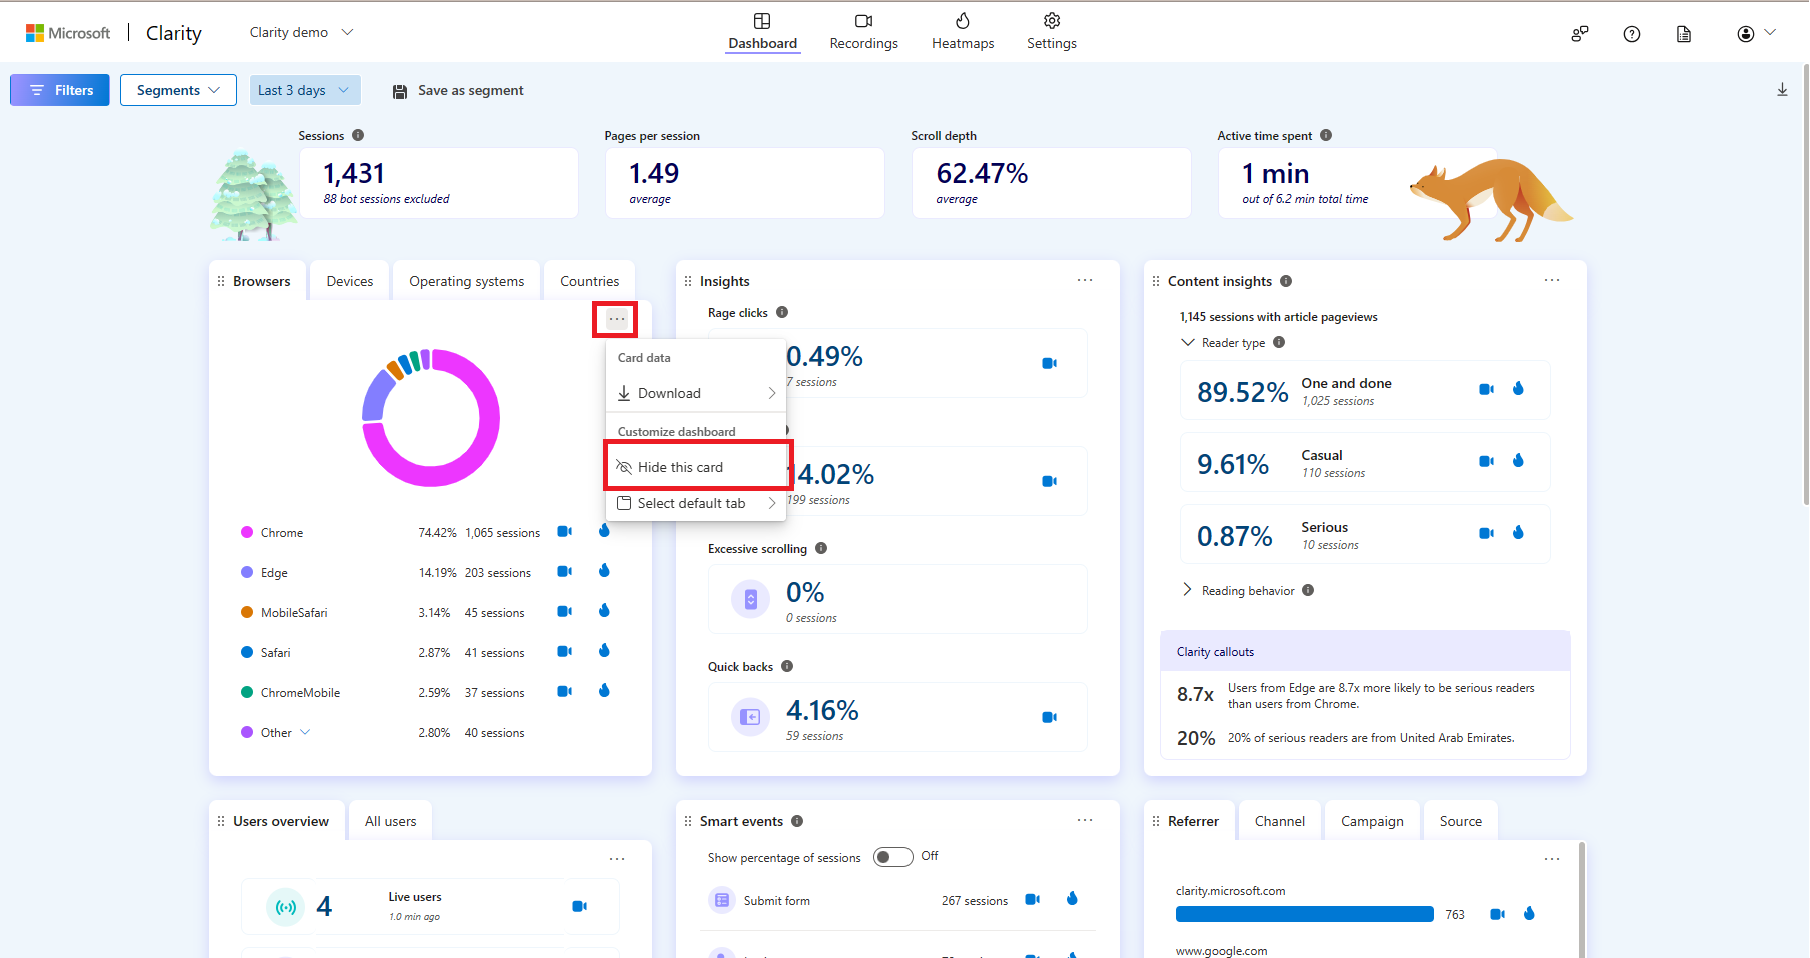
You can hide a card by selecting Menu -> Hide card.
Access hidden cards
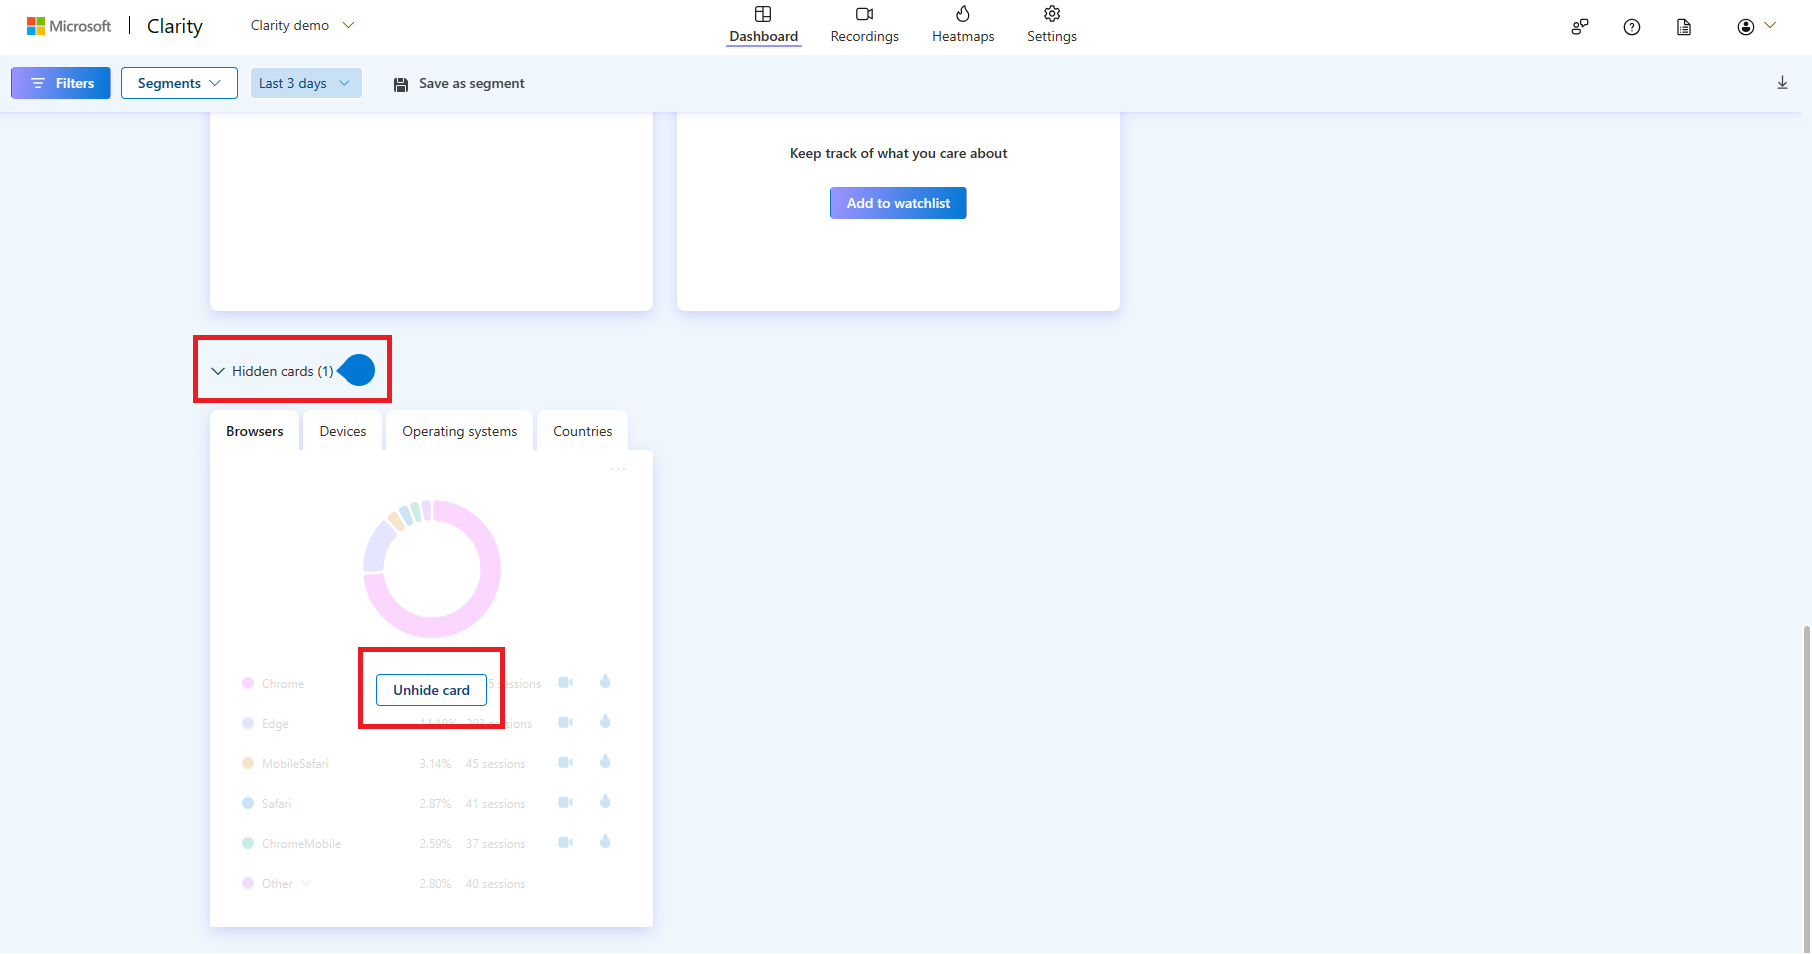
Hidden cards can be accessed at the bottom of the dashboard and easily reinstated by selecting Unhide card.
Set a default tab
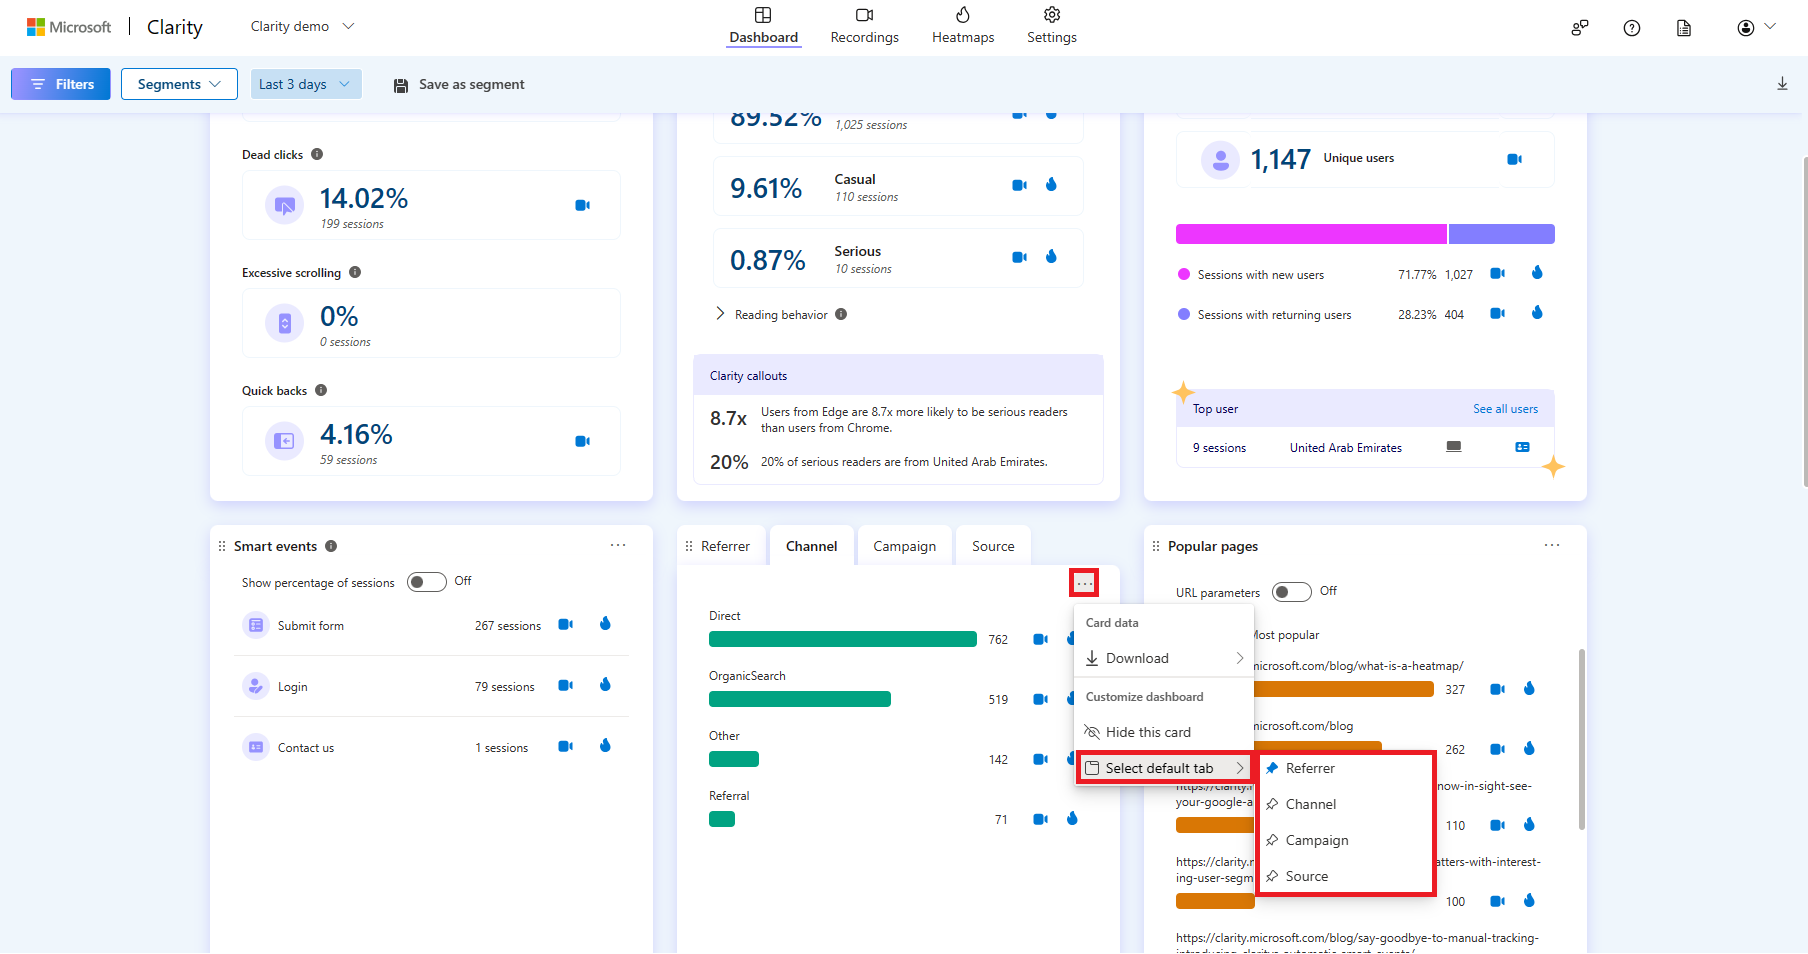
For cards containing multiple tabs, you can designate a default tab by choosing Menu -> Select default tab. The initial tab is automatically set as the default.
FAQ
For more answers, refer to Insights FAQ.