Debug DOM memory leaks by using the Detached Elements tool
The Detached Elements tool is one way to find and display all of the detached elements on a webpage. For additional ways to assess memory leaks, see, see Tools for investigating detached elements in Fix memory problems.
Important
The Detached Elements tool is being deprecated. Starting with Microsoft Edge 130, the Detached Elements tool has a message stating that the tool is deprecated; instead, in the Memory tool, in the initial Select profiling type screen, select the Detached elements option button. The Edge-only Chrome DevTools Protocol (CDP) function EdgeDOMMemory.getDetachedNodesIds continues to work, but use DOM.getDetachedDomNodes instead.
In Microsoft Edge 133, the Detached Elements tool will be removed; instead, in the Memory tool, in the initial Select profiling type screen, select the Detached elements option button. The CDP function EdgeDOMMemory.getDetachedNodesIds will be removed; use DOM.getDetachedDomNodes instead.
To increase the performance of your webpage, find the elements that are detached from the DOM tree and which you didn't expect to still be referenced by JavaScript code. Find the detached elements that the browser can't garbage-collect because your code still references them, and then release the JavaScript code references to the detached elements.
The Detached Elements tool, showing retainers in the Memory tool, with links to open the JavaScript code in the Sources tool:
Video: Debug memory leaks with the Microsoft Edge Detached Elements tool

Strategy to fix memory leaks by using the Detached Elements tool
- Open a webpage to analyze.
- Open the Detached Elements tool.
- Run garbage collection, removing all nodes that are no longer referenced by a JavaScript object.
- Get all detached elements, which couldn't be garbage-collected.
- Analyze a particular detached element and its JavaScript, to identify the culprit node in a detached tree that is causing the entire tree to be retained.
Get detached elements and analyze a detached element's JavaScript
To analyze a detached element by using the Detached Elements demo webpage:
Open the Detached Elements demo webpage in a new window or tab.
The Room 1 button is initially selected. In the JavaScript code of the demo webpage, an instance of the
Roomclass is used to manage the messages in Room 1.Right-click the webpage, and then select Inspect. Or, press Ctrl+Shift+I (Windows, Linux) or Command+Option+I (macOS).
DevTools opens.
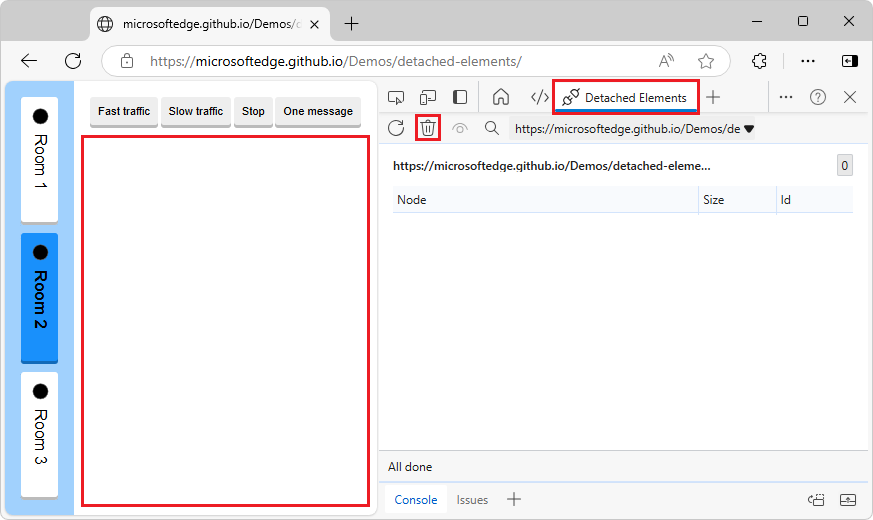
In DevTools, in the Activity Bar, select the Detached Elements (
 ) tab. If that tab isn't visible, click the More Tools (
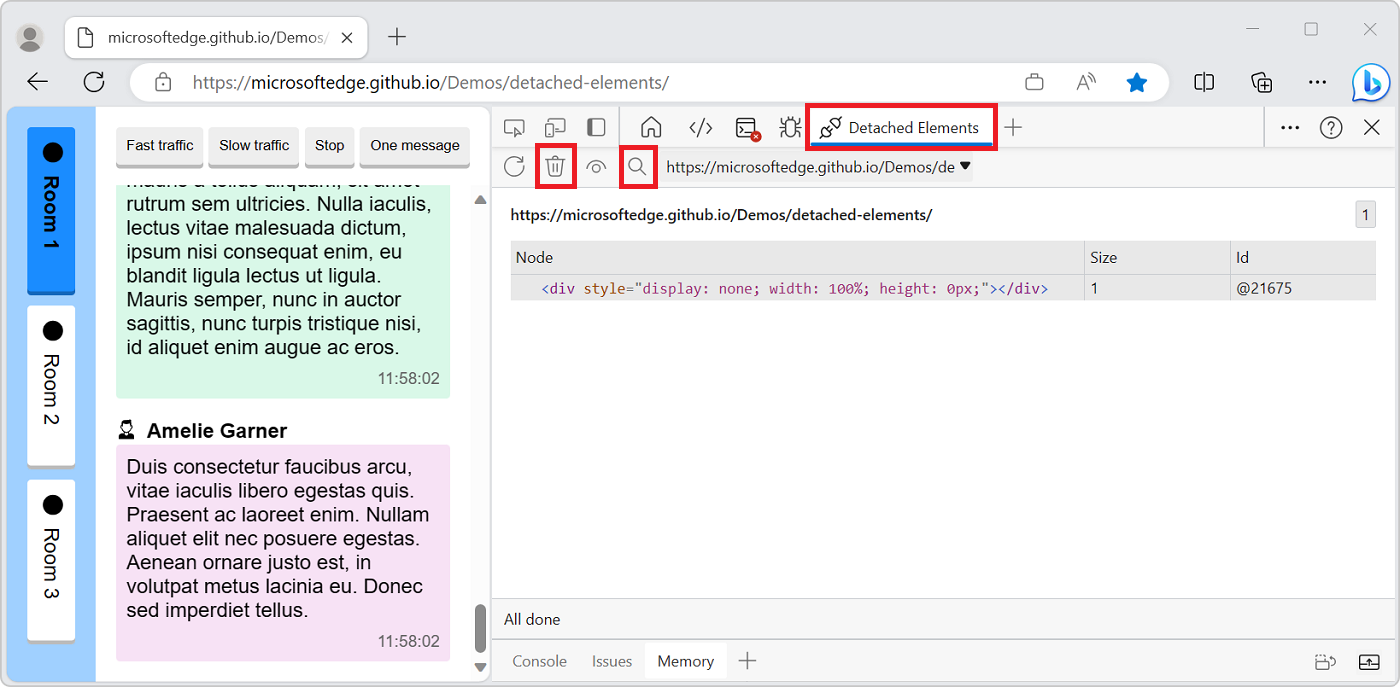
 ) button, or make DevTools wider. The Detached Elements tool opens:
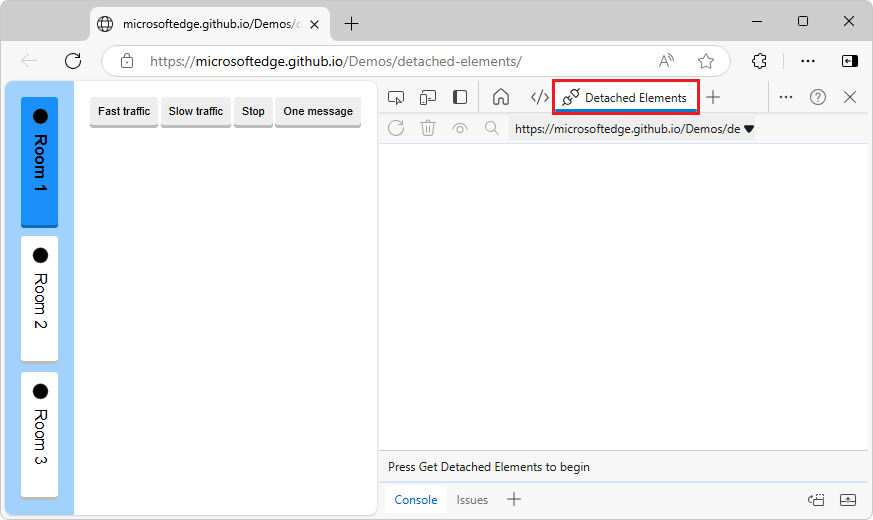
Generate messages, which will be stored by the JavaScript instance of the Room class:
In the demo webpage, click the Fast traffic button.
The demo webpage begins generating messages and displaying them in the webpage:
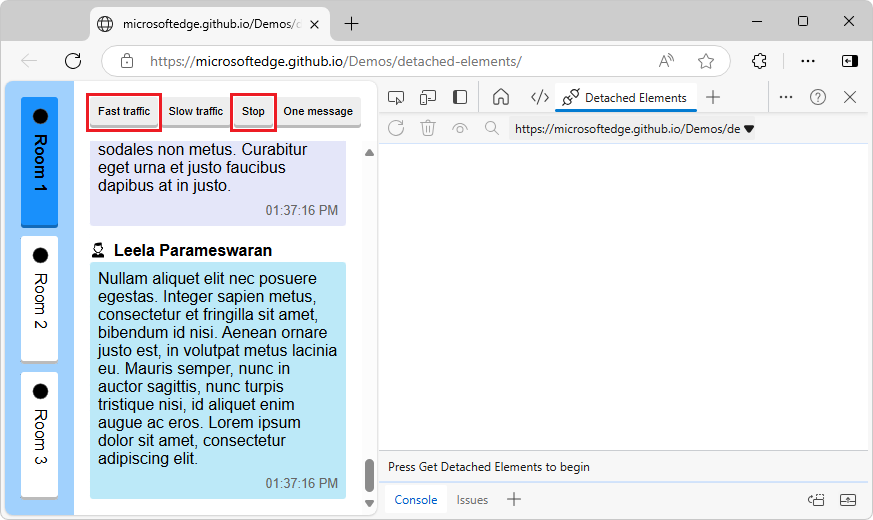
After some messages are displayed, click the Stop button in the demo webpage.
Each message is a
<div class="message">element that's referenced by the Room 1 instance of theRoomclass. There are no detached elements in the webpage DOM tree, because all of the message elements are attached to the present, Room 1 instance of the Room class.Change to a different instance of the Room class, so elements become detached:
In the demo webpage, click the Room 2 button, which corresponds to another instance of the
Roomclass.In the webpage, the messages disappear:
The messages that were generated for the Room 1 instance of the Room class (
<div class="message">elements) are no longer attached to the DOM, but they're still referenced by the Room 1 instance of the Room class. They are detached elements, which can cause memory leaks, unless they are going to be used again by the webpage.Get the list of detached elements:
In DevTools, in the Detached Elements tool, click the Collect garbage (
 ) icon.
The browser runs garbage collection, removing any nodes that are no longer referenced by a JavaScript object.
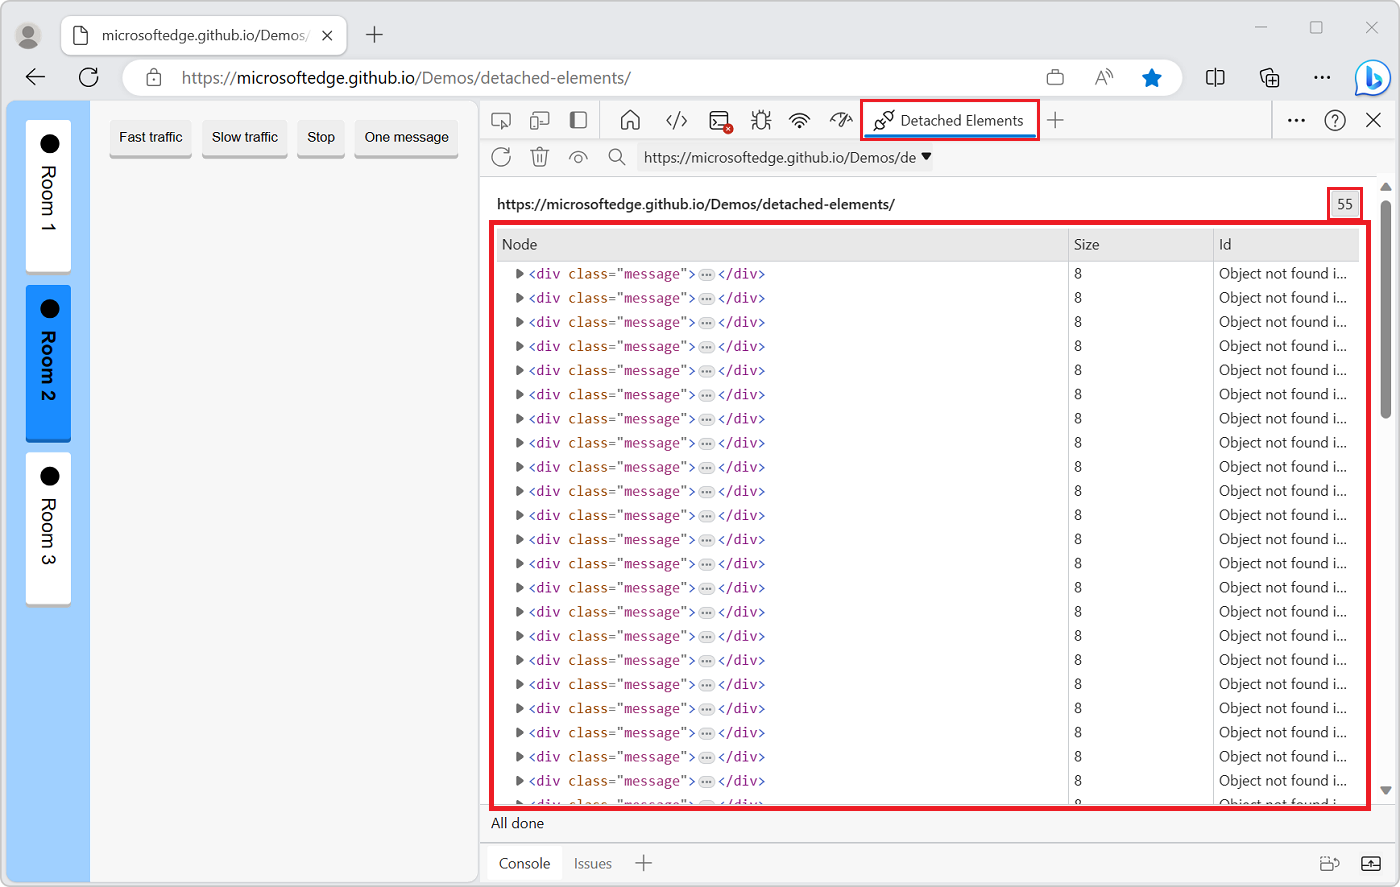
In the Detached Elements tool, click the Get Detached Elements (
 ) button.
The detached DOM elements that can't be garbage-collected are displayed:
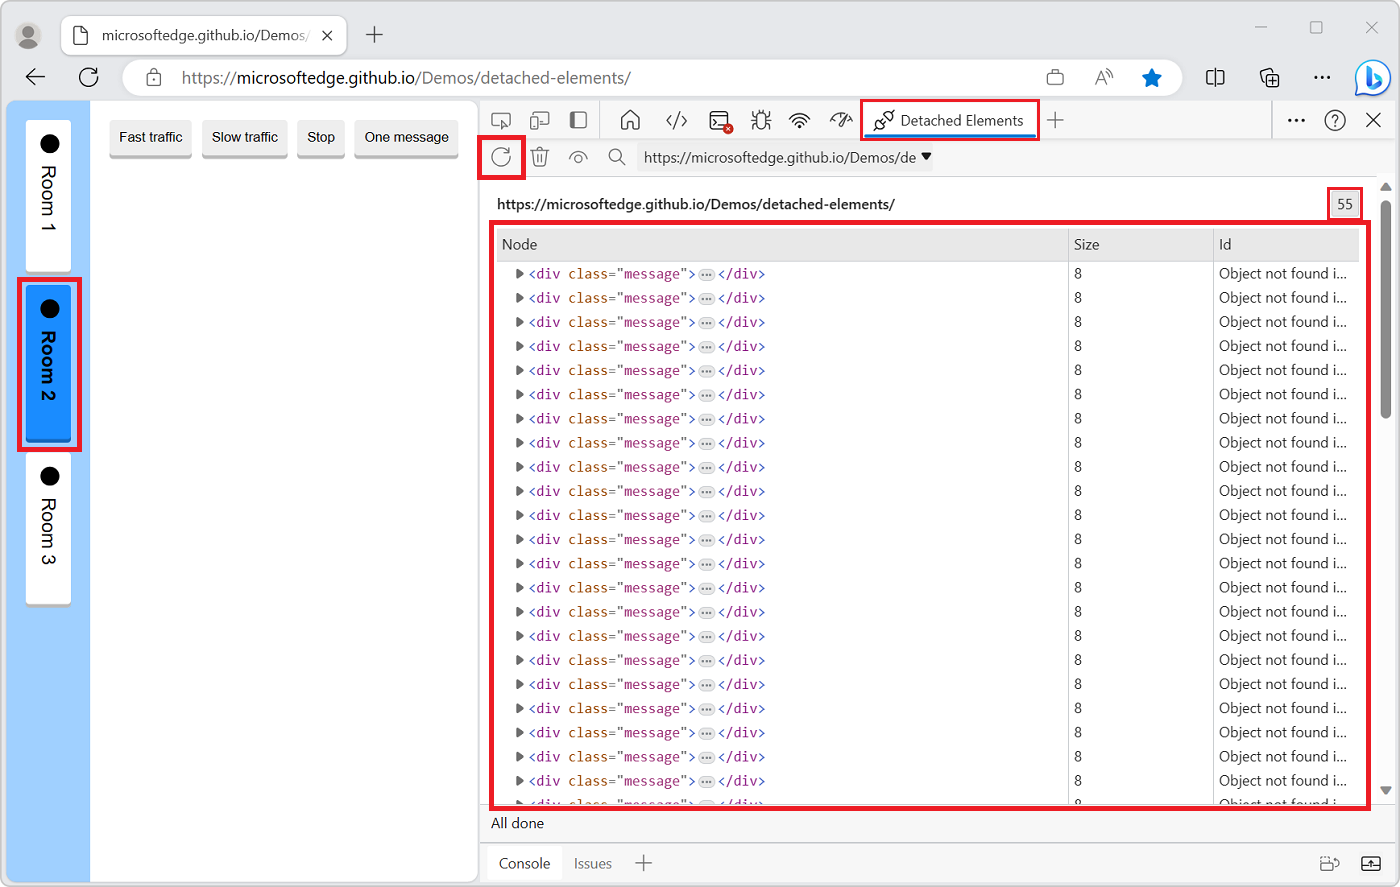
These detached elements are memory leaks, if they aren't going to be reused by the application.
Identify the JavaScript code that references a particular detached element:
In the Detached Elements tool, click the Analyze (
 ) button.
A message is briefly displayed at the bottom of the Detached Elements tool, Taking a memory heap snapshot..., and then the message All done. The Memory tool opens in the Quick View panel at the bottom of DevTools:
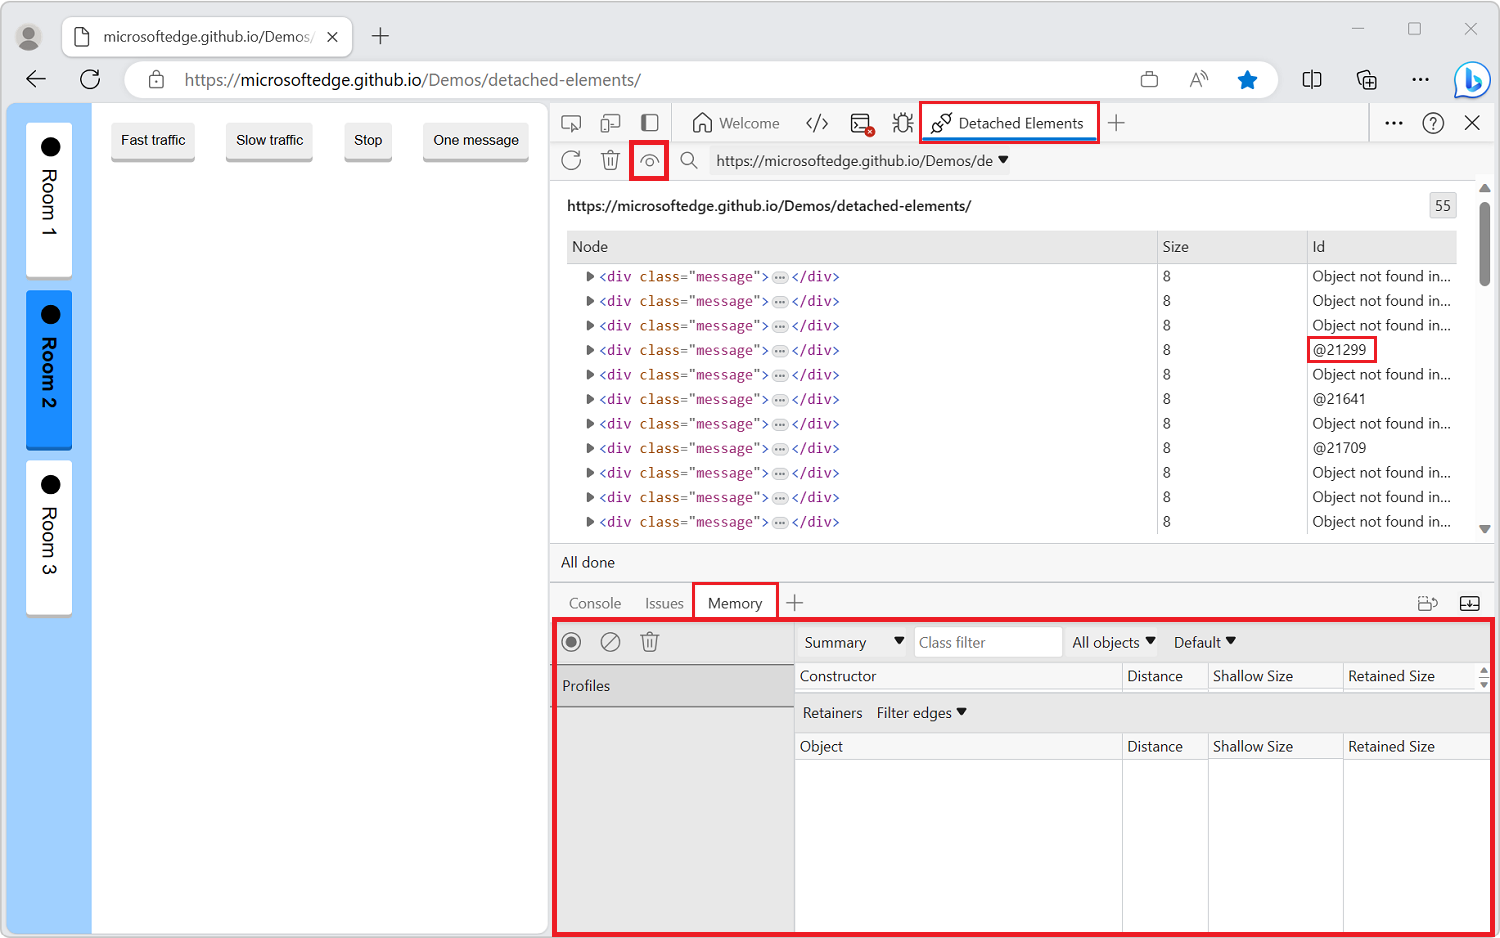
If Profiling type option buttons are displayed in the Memory tool instead of a Summary and Retainers UI, click the Analyze (
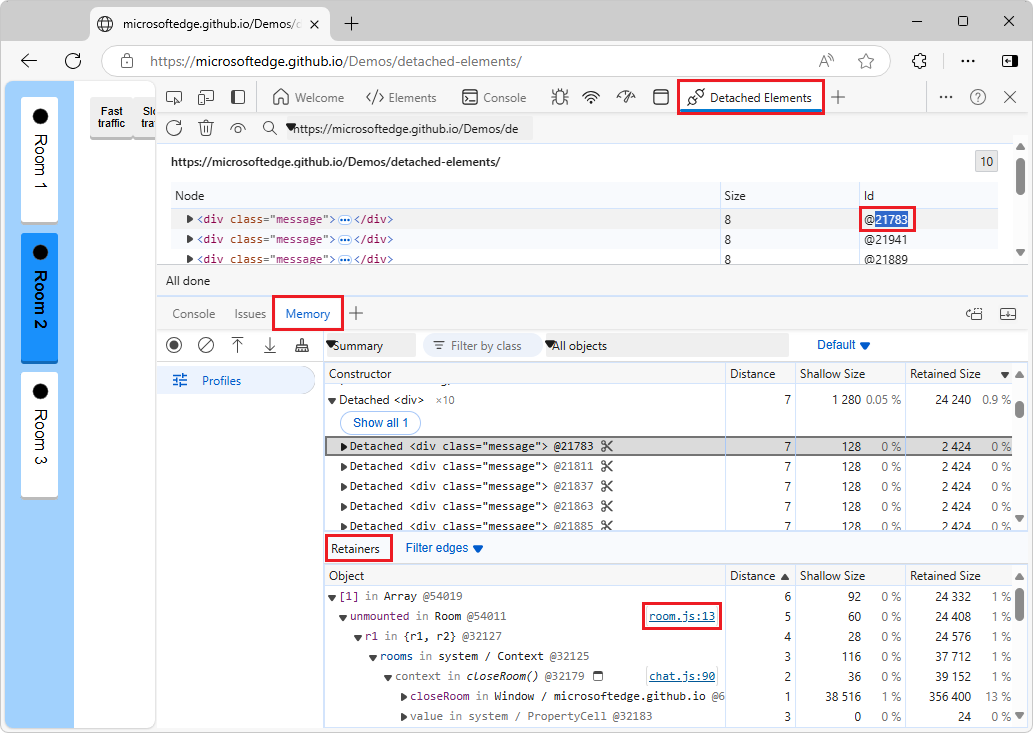
) button again.In the Detached Elements tool, in the Id column, double-click an ID, such as @21299 or @21783.
This is the unique identifier of one of the
<div class="message">elements in the memory heap snapshot. The Memory tool displays retainers in the Retainers tab:The Memory tool automatically selects the object in the heap that is referencing the detached element. Such an object is called a retainer.
In the Retainers tab, in a retainer sub-entry about the
unmountedmember, such as unmounted in Room @54011, click the link room.js:13.The Sources tool opens in the Activity Bar and shows line 13 of the file room.js (the
Roomconstructor):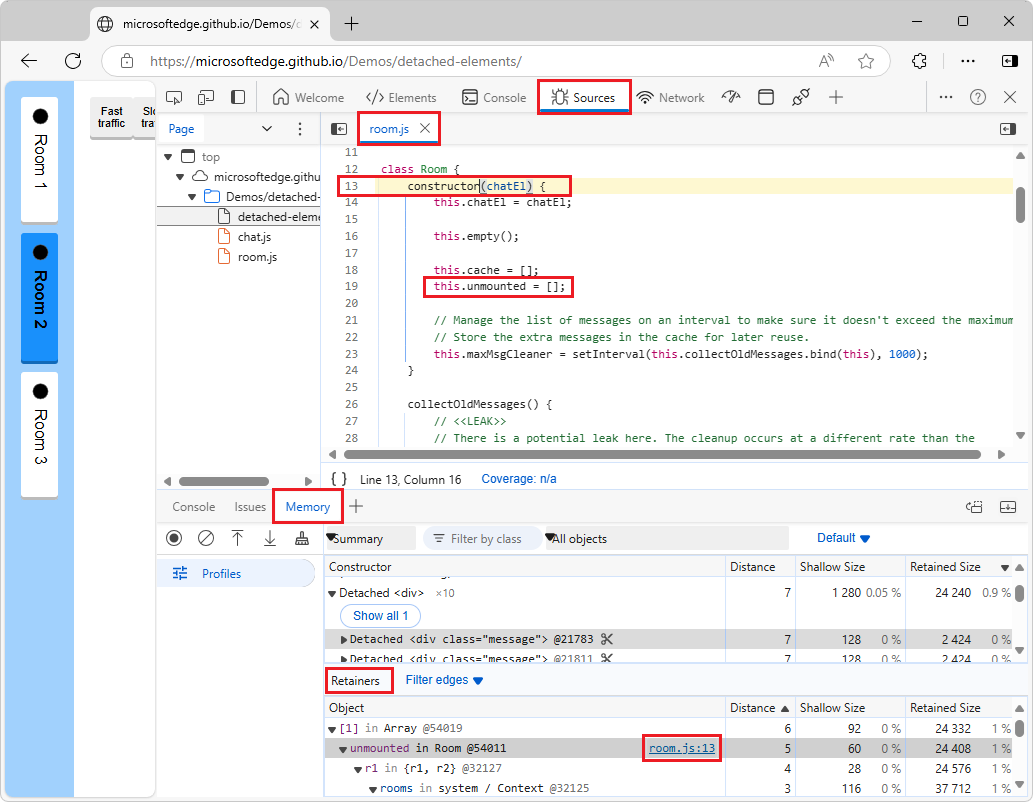
unmountedis an array member of theRoomclass, defined in line 19 in the constructor:this.unmounted = [];.Scroll down to line 49,
this.unmounted.push(el);within thehidemethod of theRoomclass: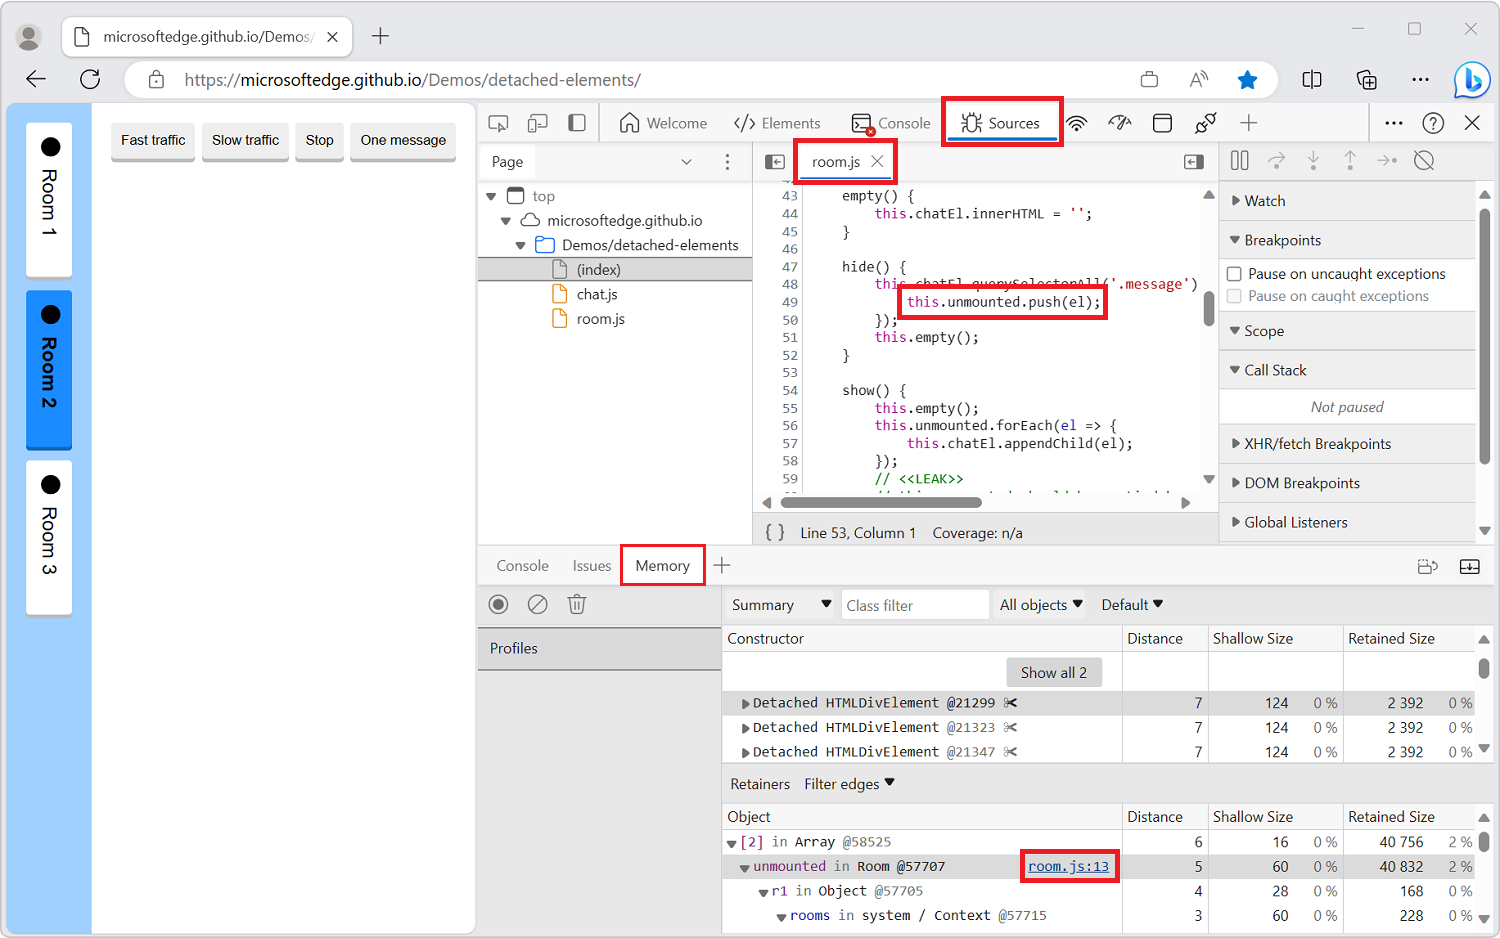
The code adds each message in the room to the
unmountedarray. Theunmountedarray is the object that is referencing the detached element.
In the JavaScript code, you have now identified the retainer object (the unmounted array) that's preventing the detached element from being garbage-collected by the browser.
You've found detached elements that the browser can't garbage-collect, and located the JavaScript object that's still referencing the detached element. You can then change the JavaScript code to release the element, to reduce the number of detached elements on the webpage, increasing webpage performance and responsiveness.
Identify the DOM node that's causing other DOM nodes to be retained
Because the DOM is a fully connected graph, when one DOM node is retained in memory by JavaScript it can cause other DOM nodes to be retained with it.
To identify the culprit node in a detached tree that is causing the entire tree to be retained:
Click the Detach Elements (
 ) icon to destroy the parent-child links inside the detached tree.
Click the Collect garbage (
) icon.Parent-child links are removed inside the detached tree, and the remaining item is the DOM node that caused other DOM nodes to be retained:
Change the selected target to a different origin
To check for detached elements from different origins or frames by using the Selected target dropdown list:
Click the Selected target dropdown list:
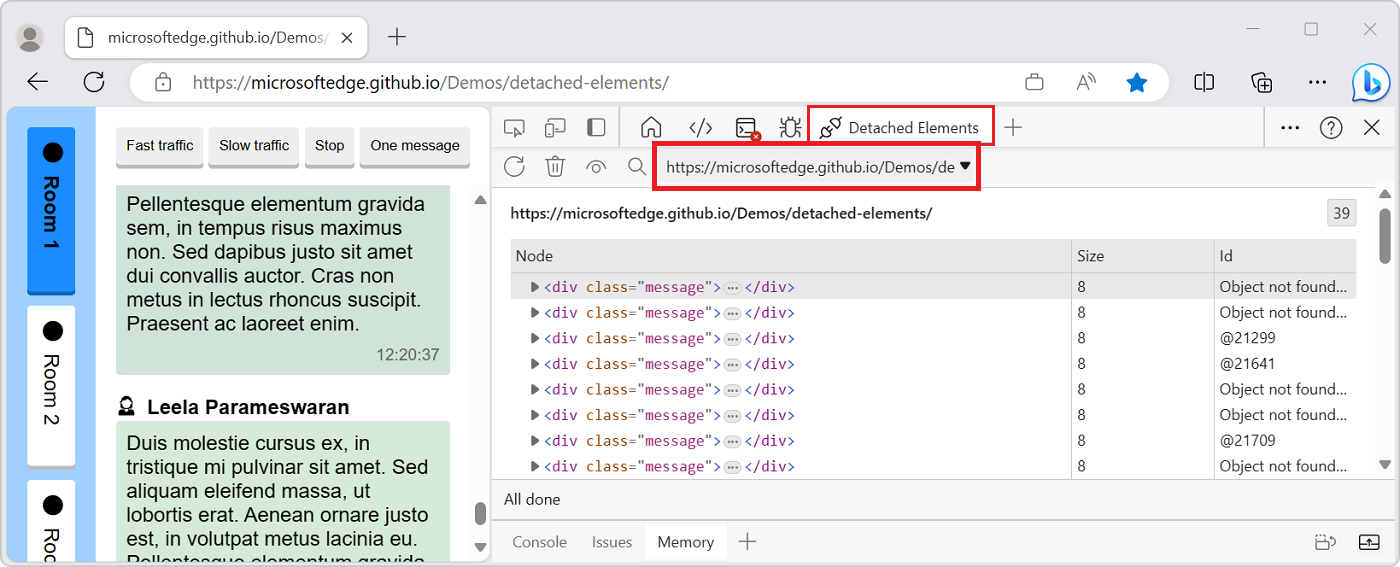
Select a different origin.
The new origin is displayed in the Detached Elements tool.
About detached elements and memory leaks
Detached elements aren't always an indication of a memory leak, and memory leaks aren't always caused by detached elements. Memory leaks depend on the context of your application.
A memory leak can occur in your application when an element is no longer attached to the Document Object Model (DOM) tree, but is still referenced by some JavaScript running on the webpage. These elements are called detached elements. For the browser to garbage-collect (GC) the detached element, the element must not be referenced from the DOM tree or from JavaScript code.
Memory issues affect webpage performance, including memory leaks, memory bloat, and frequent garbage collections. Symptoms for your users include:
- The performance of a webpage gets progressively worse over time.
- The performance of a webpage is consistently bad.
- The performance of a webpage is delayed or appears to pause frequently.
Run GC before getting detached elements, to show only elements that can't be GC'd
To only show the elements that are detached from the DOM tree and that can't be garbage-collected, always click Collect Garbage first, and then click Get Detached Elements.
Even though some elements might appear as detached at one point in time, you won't know whether they are actually still referenced by JavaScript code in the webpage until you run GC. When switching between chat rooms in the demo app, the web page removes the elements that are used to display messages from the DOM. But switching to a different instance of the Room class doesn't delete these elements entirely and references to these elements still exist, so, these elements stay in memory.
Re-attaching elements
For the Detached Elements demo webpage, it makes sense to retain the list of chat messages, so that if a user switches back to Room 1, the message log is preserved. Similarly, a feed in social media might detach elements as users scroll past them, and reattach them to the DOM when users scroll back up.
When the Detached elements tool reports detached elements, it's not necessarily a memory leak. It's up to you to decide what's a memory leak and what's not. Maybe your app will re-attach those elements later (instead of having to re-create them, which could be slower).
Detaching DOM nodes is a useful approach, as long as you eventually reuse those detached elements (or delete them). The value of the Detached elements tool is, when you suspect a memory leak, you can check whether there's an increasing number of unexpected detached DOM elements being reported by the tool.
Long-running apps and unmounting components
Be sure to unmount components. For long-running apps, small memory leaks of only a few kilobytes can noticeably degrade performance over time. For webpages that use the React framework, React maintains a virtualized copy of the DOM. Failing to properly unmount components can potentially lead to an application leaking large parts of the virtual DOM.
Reporting issues
If you find issues with how the Detached Elements feature works, contact the Microsoft Edge DevTools team to send feedback about the Detached Elements feature and memory leak debugging.
See also
- Tools for investigating detached elements in Fix memory problems - comparison of tools to view detached elements.
Demo:
- Detached Elements demo webpage
- MicrosoftEdge/Demos > detached-elements repo folder - source code.