Bemærk
Adgang til denne side kræver godkendelse. Du kan prøve at logge på eller ændre mapper.
Adgang til denne side kræver godkendelse. Du kan prøve at ændre mapper.
This tutorial shows you how to debug a plug-in in Microsoft Dataverse by using Plug-in Profiler. Use it to replay execution in Visual Studio and troubleshoot faster.
- Tutorial: Write and register a plug-in
- Tutorial: Debug a plug-in (This tutorial)
- Tutorial: Update a plug-in
For detailed explanations of supporting concepts and technical details, see:
Goal
Because the plug-in executes on a remote server, you can't attach a debugger to the plug-in process. The plug-in profiler captures a profile of an executing plug-in and allows you to replay the execution of the plug-in by using Visual Studio on your local computer.
Prerequisites
- All the prerequisites for Tutorial: Write and register a plug-in apply. See Prerequisites. The exception is that Visual Studio 2019 or later is required to install and use Power Platform Tools.
- If you didn't complete the previous tutorial, you can use the general steps in this tutorial with a different registered plug-in.
Install plug-in profiler
You can run the Plug-in Profiler from two tools: the Plug-in Registration Tool and Power Platform Tools for Visual Studio. This tutorial provides instructions for using both tools.
If you don't already have the Plug-in Registration tool installed and open, follow the steps in Tutorial: Write and register a plug-in to open it. Complete the Connect using the Plug-in Registration tool section.
In the Plug-in Registration tool, select Install Profiler.
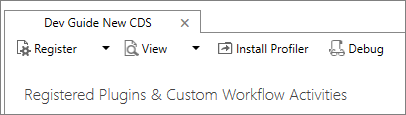
When you complete the preceding steps, you add a new managed solution named Plug-in Profiler to your Microsoft Dataverse development environment.
Start profiling
Follow these steps to begin profiling a plug-in's execution.
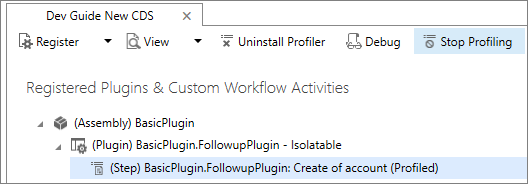
In the Plug-in Registration tool, select the (Step) BasicPlugin.FollowupPlugin: Create of account step that you registered earlier, and select Start Profiling.
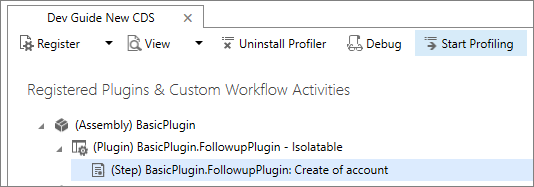
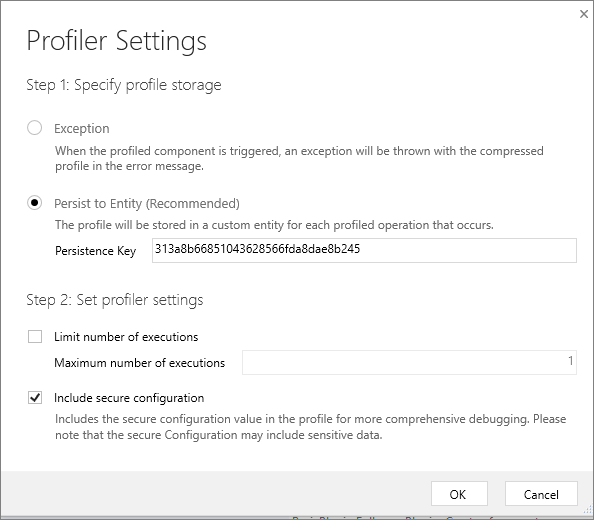
When the Profiler Settings dialog appears, accept the default settings and select OK.
Tip
For alternate information about running the profiler installed with the Plug-in Registration Tool, see Run the plug-in profiler from a Command Prompt window.
Capture a profile
In your model-driven (or other) app, create a new account to execute the plug-in. This action captures an instance of the plug-in executing and persists it as a Plug-in Profile table row in Dataverse. You can see this row in Power Apps under Tables > Plug-in Profile by choosing Data.
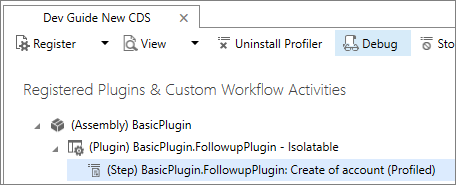
In the Plug-in Registration tool, select Debug.
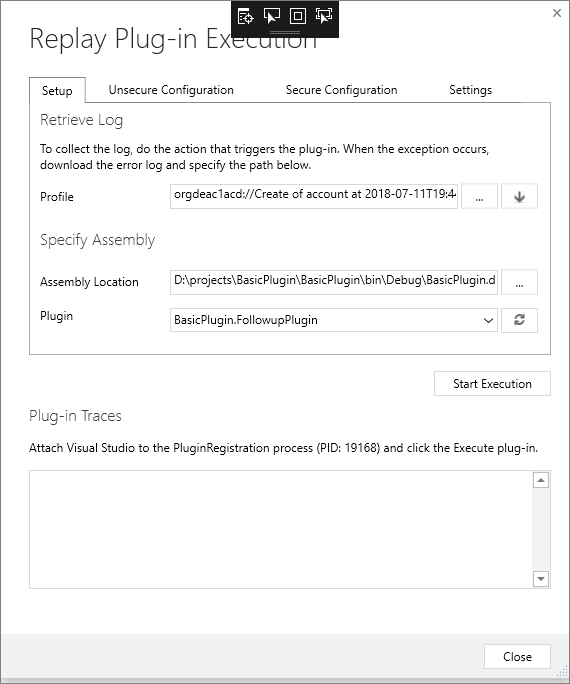
In the Replay Plug-in Execution dialog, on the Setup tab, select the
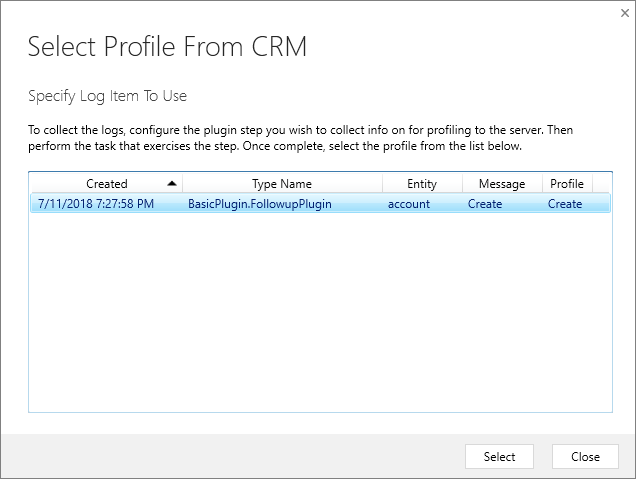
 icon to open the Select Profile from CRM dialog.
In the Select Profile from CRM dialog, select the profile where Type Name equals BasicPlugin.FollowupPlugin and represents the profile captured when you last triggered the plug-in.
Debug your plug-in
Follow these steps to debug your plug-in code.
In the Replay Plug-in Execution dialog, on the Setup tab, in the Specify Assembly section, click the ellipses (…) button and choose the location of your
BasicPlugin.dll.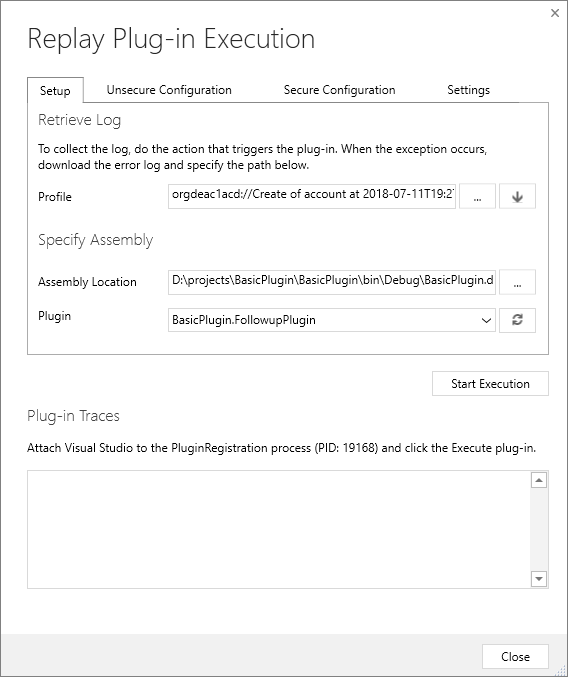
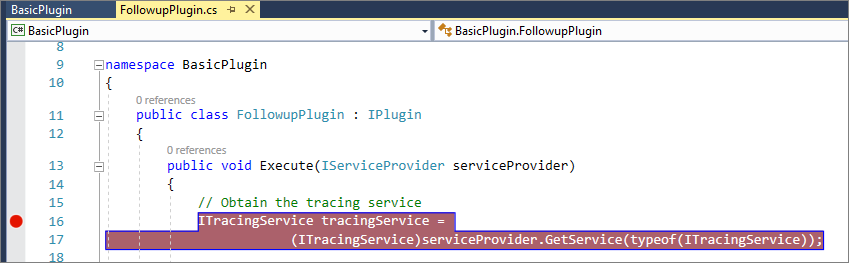
In your Visual Studio project, set a breakpoint in your plug-in class.
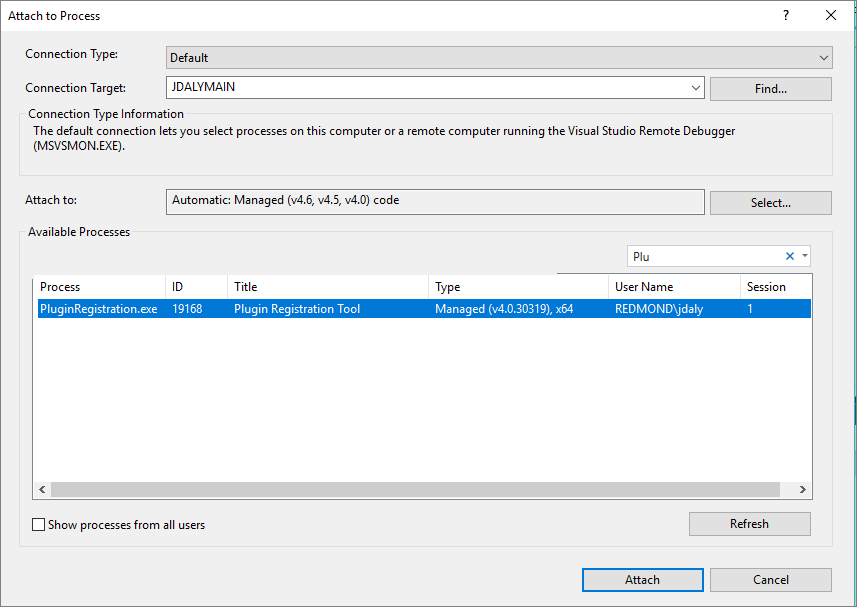
In your Visual Studio project, select Debug > Attach to Process….
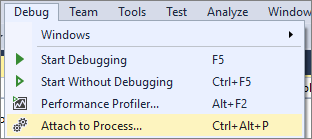
Select the PluginRegistration.exe process and click Attach.
Note
The Plug-in Registration tool now runs in debug mode.
In the Replay Plug-in Execution dialog, click Start Execution.
In your Visual Studio project, the code pauses at the breakpoint you set earlier.

Step through your code to debug.
Stop profiling
Follow these steps to stop profiling the plug-in's execution.
Close the Replay Plug-in Execution dialog.
In the Plug-in Registration tool, select Stop Profiling.
Next steps
To learn more about common tasks you perform with plug-ins, continue to Tutorial: Update a plug-in.
If you don't plan to continue to the next tutorial, unregister the BasicPlugin assembly you created in this step. For instructions, see Unregister assembly, plug-in, and step.
Run the plug-in profiler from a Command Prompt window
While it's often better to run the profiler interactively from the Plug-in Registration tool, you can run the profiler from a Command Prompt window independent of the tool. This method is useful to get the plug-in profile log from a customer's Dynamics 365 apps server to debug a failed plug-in. A developer can use that log to replay the plug-in's execution in the Plug-in Registration tool and debug the plug-in by using Visual Studio.
Procedure: run the plug-in profiler from a Command Prompt
- Open a Command Prompt window and set the working directory to the folder where you downloaded the Plug-in Registration tool
PluginRegistration.exe. - Type this command to see the available run-time parameters:
PluginProfiler.Debugger.exe /?. - Review the supported parameter list and re-run the PluginProfiler.Debugger.exe program with the appropriate parameters.