Capture a TCP dump from a Windows node in an AKS cluster
Networking issues may occur when you're using a Microsoft Azure Kubernetes Service (AKS) cluster. To help investigate these issues, this article explains how to capture a TCP dump from a Windows node in an AKS cluster, and then download the capture to your local machine.
Prerequisites
- Azure CLI, version 2.0.59 or later. You can open Azure Cloud Shell in the web browser to enter Azure CLI commands. Or install or upgrade Azure CLI on your local machine. To find the version that's installed on your machine, run
az --version. - An AKS cluster. If you don't have an AKS cluster, create one using Azure CLI or through the Azure portal.
Step 1: Find the nodes to troubleshoot
How do you determine which node to pull the TCP dump from? You first get the list of nodes in the AKS cluster using the Kubernetes command-line client, kubectl. Follow the instructions to connect to the cluster and run the kubectl get nodes --output wide command using the Azure portal or Azure CLI. A node list that's similar to the following output appears:
$ kubectl get nodes --output wide
NAME                                STATUS   ROLES   AGE     VERSION   INTERNAL-IP    EXTERNAL-IP   OS-IMAGE                         KERNEL-VERSION     CONTAINER-RUNTIME
akswin000000                        Ready    agent   3m8s    v1.20.9   10.240.0.4     <none>        Windows Server 2019 Datacenter   10.0.17763.2237    docker://20.10.6
akswin000001                        Ready    agent   3m50s   v1.20.9   10.240.0.115   <none>        Windows Server 2019 Datacenter   10.0.17763.2237    docker://20.10.6
akswin000002                        Ready    agent   3m32s   v1.20.9   10.240.0.226   <none>        Windows Server 2019 Datacenter   10.0.17763.2237    docker://20.10.6
Step 2: Connect to a Windows node
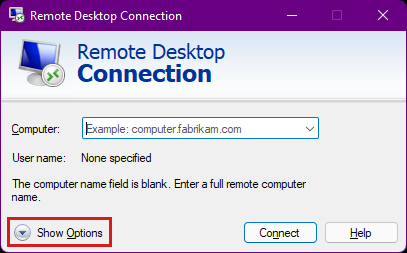
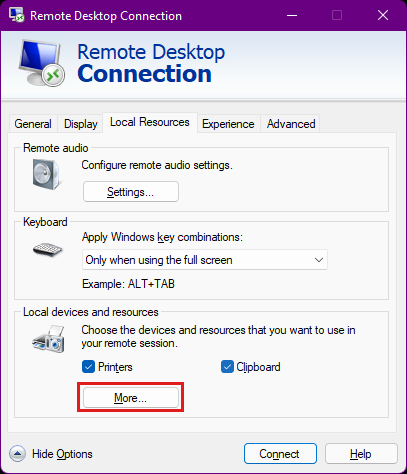
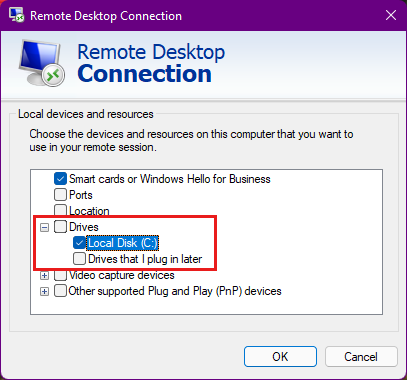
The next step is to establish a connection to the AKS cluster node. You authenticate either using a Secure Shell (SSH) key, or using the Windows admin password in a Remote Desktop Protocol (RDP) connection. Both methods require creating an intermediate connection, because you can't currently connect directly to the AKS Windows node. Whether you connect to a node through SSH or RDP, you need to specify the user name for the AKS nodes. By default, this user name is azureuser.
If you have an SSH key, create an SSH connection to the Windows node. The SSH key doesn't persist on your AKS nodes. The SSH key reverts to what was initially installed on the cluster during any:
- Reboot
- Version upgrade
- Node image upgrade
Step 3: Create a packet capture
When you're connected to the Windows node through SSH or RDP, a form of the Windows command prompt appears:
azureuser@akswin000000 C:\Users\azureuser>
Now open a command prompt and enter the Network Shell (netsh) command below for capturing traces (netsh trace start). This command starts the packet capture process.
netsh trace start capture=yes tracefile=C:\Users\azureuser\AKS_node_name.etl
Output appears that's similar to the following text:
Trace configuration:
-------------------------------------------------------------------
Status:             Running
Trace File:         AKS_node_name.etl
Append:             Off
Circular:           On
Max Size:           250 MB
Report:             Off
While the trace is running, replicate your issue many times. This action ensures the issue has been captured within the TCP dump. Note the time stamp while you replicate the issue. To stop the packet capture when you're done, enter netsh trace stop:
azureuser@akswin000000 C:\Users\azureuser>netsh trace stop
Merging traces ... done
Generating data collection ... done
The trace file and additional troubleshooting information have been compiled as "C:\Users\azureuser\AKS_node_name.cab".
File location = C:\Users\azureuser\AKS_node_name.etl
Tracing session was successfully stopped.
Step 4: Transfer the capture locally
After you complete the packet capture, identify the helper pod so you can copy the dump locally. Open a second console, and then get a list of pods by running kubectl get pods, as shown below.
kubectl get pods
NAME                                                    READY   STATUS    RESTARTS   AGE
azure-vote-back-6c4dd64bdf-m4nk7                        1/1     Running   2          3d21h
azure-vote-front-85b4df594d-jhpzw                       1/1     Running   2          3d21h
node-debugger-aks-nodepool1-38878740-vmss000000-6ztp6   1/1     Running   0          3m58s
The helper pod has a prefix of node-debugger-aks, as shown in the third row. Replace the pod name, and then run the following Secure Copy (scp) commands. These commands retrieve the event trace log (.etl) and archive (.cab) files, which are generated for the packet capture.
scp -o 'ProxyCommand ssh -p 2022 -W %h:%p azureuser@127.0.0.1' azureuser@10.240.0.97:AKS_node_name.cab .
scp -o 'ProxyCommand ssh -p 2022 -W %h:%p azureuser@127.0.0.1' azureuser@10.240.0.97:AKS_node_name.etl .
Output similar to the following text appears:
$ scp -o 'ProxyCommand ssh -p 2022 -W %h:%p azureuser@127.0.0.1' azureuser@10.240.0.97:AKS_node_name.cab .

Authorized uses only. All activity may be monitored and reported.
AKS_node_name.cab                                                                  100%  571KB 984.0KB/s   00:00

scp -o 'ProxyCommand ssh -p 2022 -W %h:%p azureuser@127.0.0.1' azureuser@10.240.0.97:AKS_node_name.etl .

Authorized uses only. All activity may be monitored and reported.
AKS_node_name.etl                                                                  100% 1536KB   1.3MB/s   00:01

Contact us for help
If you have questions or need help, create a support request, or ask Azure community support. You can also submit product feedback to Azure feedback community.