Use Visual Studio Tools for Unity
In this section, you'll learn how to use Visual Studio Tools for Unity's integration and productivity features, and how to use the Visual Studio debugger for Unity development.
Open Unity scripts in Visual Studio
Once Visual Studio is set as the external editor for Unity, double-clicking a script from the Unity editor will automatically launch or switch to Visual Studio and open the chosen script.
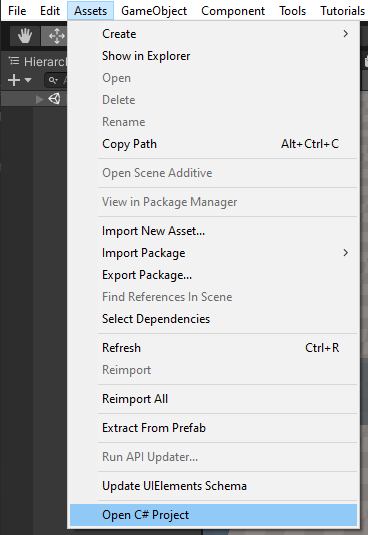
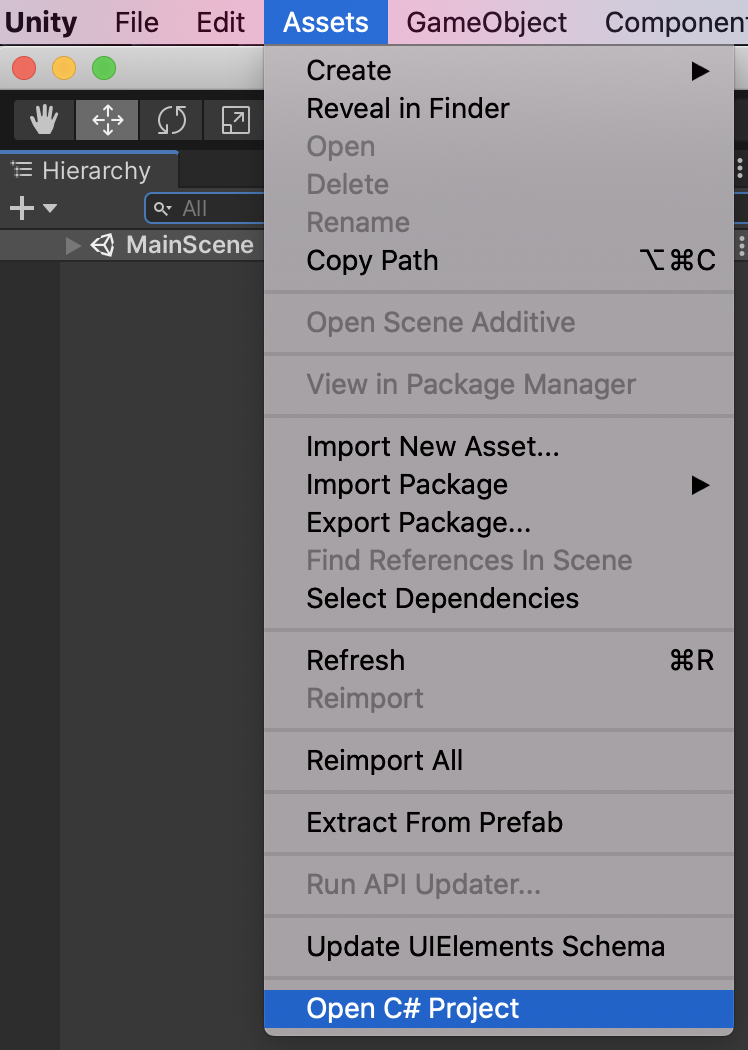
Alternatively, you can open Visual Studio with no script open in the source editor by selecting the Assets > Open C# Project menu in Unity.
Unity documentation access
You can access the Unity scripting documentation quickly from Visual Studio. If Visual Studio Tools for Unity doesn't find the API documentation locally, it will try to find it online.
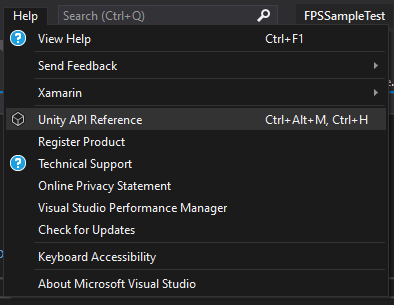
- In Visual Studio, highlight or place the cursor over the Unity API you want to learn about, then press Ctrl+Alt+M, Ctrl+H
- You can also use the Help > Unity API Reference menu instead of the keybinding.
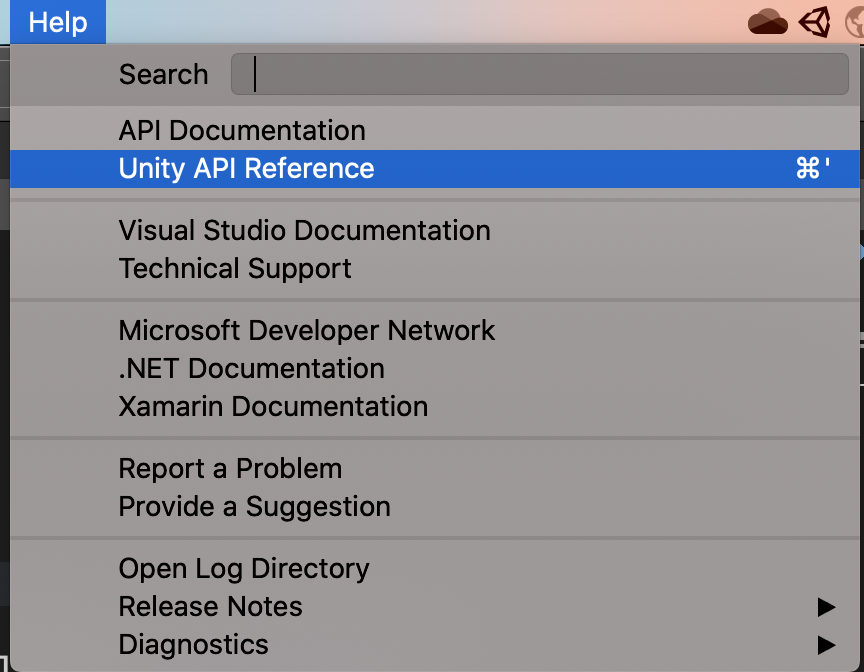
- In Visual Studio for Mac, highlight or place the cursor over the Unity API you want to learn about, then press Cmd+'
- You can also use the Help > Unity API Reference menu instead of the keybinding.
Intellisense for Unity API Messages
Intellisense code-completion makes it easy to implement Unity API messages in MonoBehaviour scripts, and assists with learning the Unity API. To use IntelliSense for Unity messages:
Place the cursor on a new line inside the body of a class that derives from
MonoBehaviour.Begin typing the name of a Unity message, such as
OnTriggerEnter.Once the letters "ontri" have been typed, a list of IntelliSense suggestions appears.

The selection on the list can be changed in three ways:
With the Up and Down arrow keys.
By clicking with the mouse on the desired item.
By continuing to type the name of the desired item.
IntelliSense can insert the selected Unity message, including any necessary parameters:
By pressing Tab.
By pressing Enter.
By double-clicking the selected item.

Unity MonoBehavior scripting wizard
You can use the MonoBehavior wizard to view a list of all the Unity API methods and quickly implement an empty definition. This feature, particularly with the Generate method comments option enabled, is helpful if you are still learning what's available in the Unity API.
To create empty MonoBehavior method definitions with the MonoBehavior wizard:
In Visual Studio, position the cursor where you want the methods to be inserted, then press Ctrl+Shift+M to launch the MonoBehavior wizard. In Visual Studio for Mac, press Cmd+Shift+M.
In the Create script methods window, mark the checkbox next to the name of each method you want to add.
Use the Framework version dropdown to select your desired version.
By default, the methods are inserted at the position of the cursor. Alternatively, you can choose to insert them after any method that's already implemented in your class by changing the value of the Insertion point dropdown to the location you want.
If you want the wizard to generate comments for the methods you selected, mark the Generate method comments checkbox. These comments are meant to help you understand when the method is called and what its general responsibilities are.
Choose the OK button to exit the wizard and insert the methods into your code.


Unity Project Explorer
The Unity Project Explorer shows all of your Unity project files and directories in the same way that the Unity Editor does. This is different than navigating your Unity scripts with the normal Visual Studio Solution Explorer, which organizes them into projects and a solution generated by Visual Studio.
- On the main Visual Studio menu, choose View > Unity Project Explorer. Keyboard shortcut: Alt+Shift+E
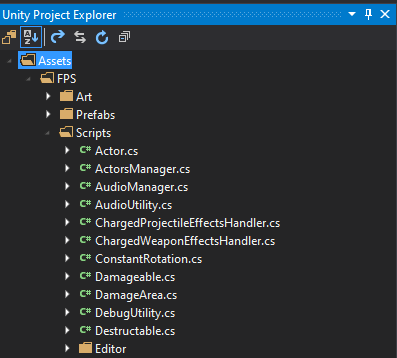
- In Visual Studio for Mac, the Solution Pad automatically behaves like this when a Unity project is opened.
Unity debugging
Visual Studio Tools for Unity lets you debug both editor and game scripts for your Unity project using Visual Studio's powerful debugger.
Debug in the Unity editor
Start debugging
- Connect Visual Studio to Unity by clicking the Play button labeled Attach to Unity, or use the keyboard shortcut F5.

- Connect Visual Studio to Unity by clicking the Play button, or type Command + Return, or F5.

- Switch to Unity and click the Play button to run the game in the editor.


- When the game is running in the Unity editor while connected to Visual Studio, any breakpoints encountered will pause execution of the game and bring up the line of code where the game hit the breakpoint in Visual Studio.
Stop debugging
Click the Stop button in Visual Studio, or use the keyboard shortcut Shift + F5.

Click the Stop button in Visual Studio for Mac, or press Shift + Command + Return.

To learn more about debugging in Visual Studio, see Documentation for First look at the Visual Studio Debugger..
Attach to Unity and Play
For added convenience, you can change the Attach to Unity button to Attach to Unity and Play mode.
Click the small down arrow next to the Attach to Unity button.
Select Attach to Unity and Play from the dropdown menu.

The play button becomes labeled Attach to Unity and Play. Clicking this button or using the keyboard shortcut F5 now automatically switches to the Unity editor and runs the game in the editor, in addition to attaching the Visual Studio debugger.
Starting debugging and playing the Unity editor can be completed in a single step directly from Visual Studio for Mac by choosing the Attach to Unity and Play configuration.

Note
If you started debugging using the Attach to Unity and Play configuration, the Stop button will also stop the Unity Editor.
Debug Unity player builds
You can debug development builds of Unity players with Visual Studio.
Enable script debugging in a Unity player
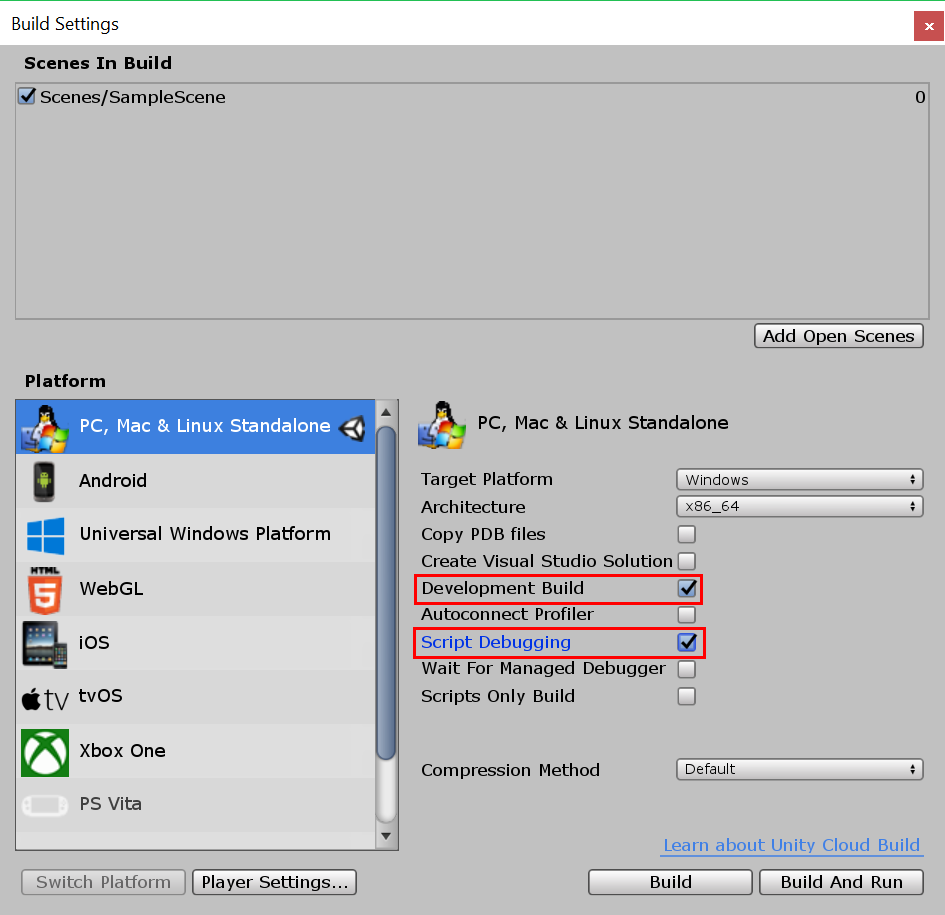
In Unity, open the Build Settings by selecting File > Build Settings.
In the Build Settings window, mark the Development Build and Script Debugging checkboxes.
Select a Unity instance to attach the debugger to
In Visual Studio, on the main menu, choose Debug > Attach Unity Debugger.

The Select Unity Instance dialog displays some information about each Unity instance that you can connect to.

Project The name of the Unity project that's running in this instance of Unity.
Machine The name of the computer or device that this instance of Unity is running on.
Type Editor if this instance of Unity is running as part of the Unity Editor; Player if this instance of Unity is a stand-alone player.
Port The port number of the UDP socket that this instance of Unity is communicating over.
Important
Because Visual Studio Tools for Unity and the Unity instance are communicating over a UDP network socket, your firewall may need rule to allow it. If needed, you may see a prompt, you'll have to authorize the connection so that VSTU and Unity can communicate.
Selecting a Unity instance that doesn't appear in the list
If you have a known Unity Player running that doesn't appear in the list, you can use the Input IP button on the Select Unity Instance window. Enter the IP address and port of the running Unity Player to connect the debugger.
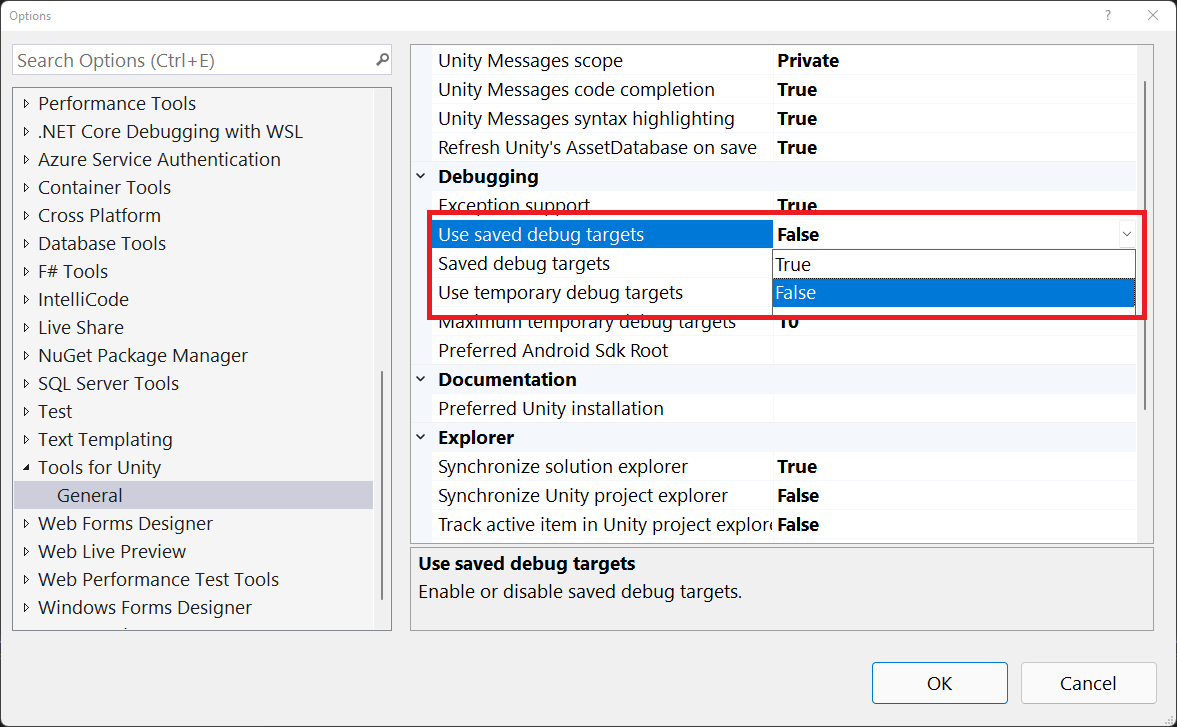
To make it easier for you to continue debugging that player without entering the IP and port each time, enable the Use saved debug targets setting in the Tools > Options > Tools for Unity > General menu.
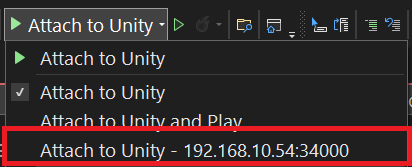
Visual Studio will show saved debug targets as an option in Attach to Unity button.
- In Visual Studio for Mac, on the top menu, choose Run > Attach to Process.
- In the Attach to Process dialog, select Unity Debugger option in the Debugger drop-down menu at the bottom.
- Select a Unity instance from the list and click the Attach button.
Debug a DLL in your Unity project
Many Unity developers are writing code components as external DLLs so that the functionality they develop can be easily shared with other projects. Visual Studio Tools for Unity makes it easy to debug code in these DLLs seamlessly with other code in your Unity project.
Note
At this time, Visual Studio Tools for Unity only supports managed DLLs. It does not support debugging of native code DLLs, such as those written in C++.
Note that the scenario described here assumes that you have the source code—that is, you are developing or re-using your own first-party code, or you have the source code to a third-party library, and plan to deploy it in your Unity project as a DLL. This scenario does not describe debugging a DLL for which you do not have the source code.
To debug a managed DLL project used in your Unity project
Add your existing DLL project to the Visual Studio solution generated by Visual Studio Tools for Unity. Less commonly, you might be starting a new managed DLL project to contain code components in your Unity project; if that's the case, you can add a new managed DLL project to the Visual Studio solution instead.
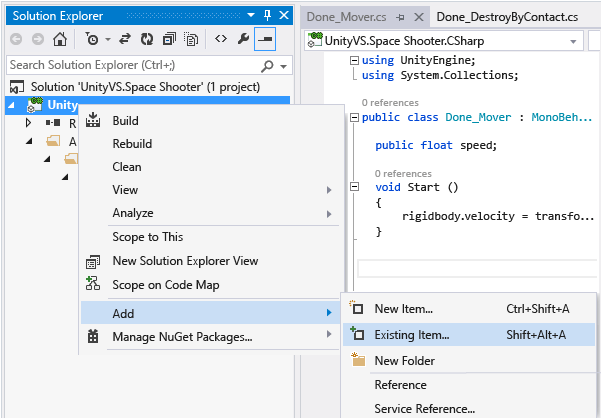
In either case, Visual Studio Tools for Unity maintains the project reference, even if it has to regenerate the project and solution files again, so you only need to perform these steps once.
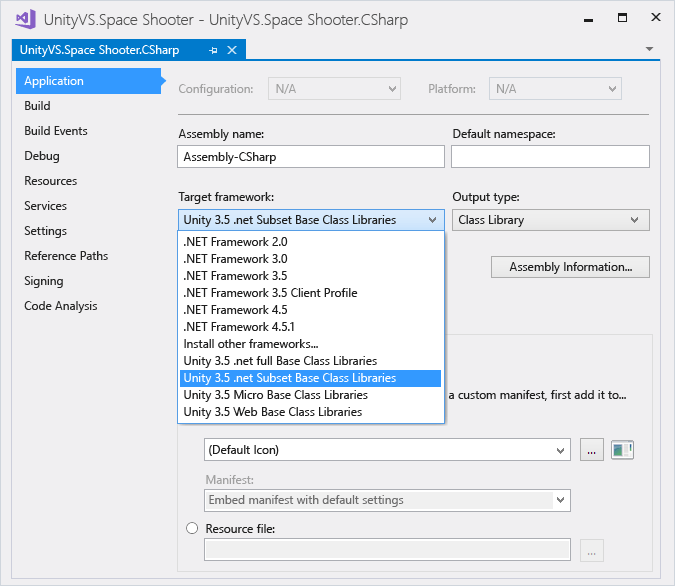
Reference the correct Unity framework profile in the DLL project. In Visual Studio, in the DLL project's properties, set the Target framework property to the Unity framework version you're using. This is the Unity Base Class Library that matches the API compatibility that your project targets, such as the Unity full, micro, or web base class libraries. This prevents your DLL from calling framework methods that exist in other frameworks or compatibility levels, but which might not exist in the Unity framework version you're using.
Note
The following is only required if you are using Unity's legacy runtime. If you are using the new Unity runtime, you don't need to use those dedicated 3.5 profiles anymore. Use a .NET 4.x profile compatible with your Unity version.
Copy the DLL to your Unity project's Asset folder. In Unity, assets are files that are packaged and deployed together with your Unity app so that they can be loaded at run-time. Since DLLs are linked at run time, DLLs must be deployed as assets. To be deployed as an asset, the Unity Editor requires the DLLs to be put inside the Assets folder in your Unity project. There are two ways you can do this:
Modify the build settings of your DLL project to include a post-built task that copies the output DLL and PDB files from its output folder to the Assets folder of your Unity project.
Modify the build settings of your DLL project to set its output folder to be the Assets folder of your Unity project. Both DLL and PDB files will be placed in the Assets folder.
The PDB files are needed for debugging because they contain the DLL's debugging symbols, and map the DLL code to its source code form. If you are targeting the legacy runtime, Visual Studio Tools for Unity will use information from the DLL and PDB to create a DLL.MDB file, which is the debug symbol format used by the legacy Unity scripting engine. If you are targeting the new runtime, and using Portable-PDB, Visual Studio Tools for Unity will not try to do any symbol conversion as the new Unity runtime is able to natively consume Portable-PDBs.
More information about PDB generation can be found here. If you are targeting the new runtime, please make sure that "Debugging Information" is set to "Portable", in order to properly generate Portable-PDB. If you are targeting the legacy runtime, you need to use "Full".
Debug your code. You can now debug your DLL source code together with your Unity project's source code, and use all the debugging features you are used to, such as breakpoints and stepping through code.
Keyboard shortcuts
You can quickly access the Unity Tools for Visual Studio functionality by using their keyboard shortcuts. Here's a summary of the shortcuts that are available.
| Command | Shortcut | Shortcut command name |
|---|---|---|
| Open the MonoBehavior Wizard | Ctrl+Shift+M | EditorContextMenus.CodeWindow.ImplementMonoBehaviours |
| Open the Unity Project Explorer | Alt+Shift+E | View.UnityProjectExplorer |
| Access Unity documentation | Ctrl+Alt+M, Ctrl+H | Help.UnityAPIReference |
| Attach to Unity debugger (player or editor) | no default | Debug.AttachUnityDebugger |
You can change the shortcut key combinations if you don't like the default. For information on how to change it, see Identify and customize keyboard shortcuts in Visual Studio.
| Command | Shortcut | Shortcut command name |
|---|---|---|
| Open the MonoBehavior Wizard | Cmd+Shift+M | EditorContextMenus.CodeWindow.ImplementMonoBehaviours |
| Access Unity documentation | Cmd+' | Help.UnityAPIReference |
You can change the shortcut key combinations if you don't like the default. For information on how to change it, see Customizing the IDE.