Bemærk
Adgang til denne side kræver godkendelse. Du kan prøve at logge på eller ændre mapper.
Adgang til denne side kræver godkendelse. Du kan prøve at ændre mapper.
Visual Studio Live Share's collaborative debugging feature is a powerful and unique way to debug an issue. This feature enables a collaborative experience to troubleshoot problems. Participants in your session can also use it to investigate issues that might be environment-specific by providing a shared debugging session on the host's machine.
Tip
Given all participants can independently navigate and edit files, as a host, you might want to restrict which files guests can access in your project via a .vsls.json file. You should also be aware that Console/REPL access means that participants can execute commands on your machine, so you should only co-debug with those you trust. As a guest, it's also important to realize you might not be able to follow the debugger as it steps into certain files restricted as a result of these settings. See controlling file access and visibility for details.
To use it, the collaboration session host needs to start debugging via the usual means in Visual Studio.

After the debugger attaches on the host's side, all guests are automatically attached. While there's only one debugging "session" running on the host's machine, all participants are connected to it and have their own view.
Tip
If you want to change when and how co-debugging happens, you can change the default behaviors via Tools > Options > Live Share settings.
Anyone can step through the debugging process, which enables seamless switching between collaborators without having to negotiate control.
Note
See platform support for the state of debugging features by language or platform.
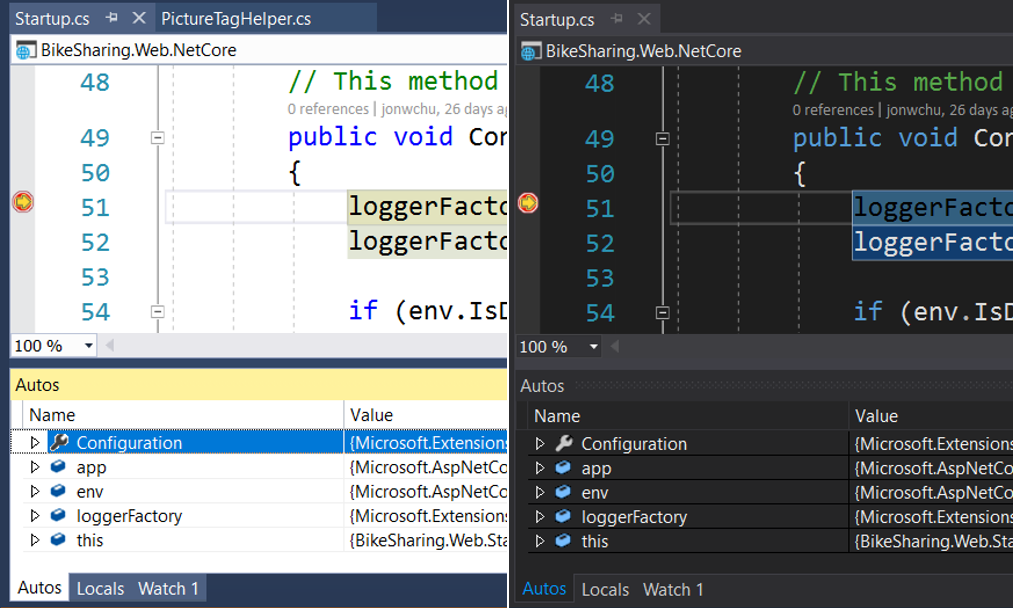
Each collaborator can investigate different variables, jump to different files in the call stack, inspect variables, and even add or remove breakpoints. Each participant can use co-editing features to track where the others are located. Participants can seamlessly switch between concurrently investigating different aspects of the problem and collaboratively debugging.
Note
While in a read-only collaboration session, guests won't be able to step through the debugging process. They can however still add or remove breakpoints, and inspect variables.
Tip
You can also participate in Visual Studio Code debugging sessions from Visual Studio and vice versa! Check out the Visual Studio Code instructions on co-debugging for more information.
Automatic web app sharing
For ASP.NET Web App projects, if the host's project is configured to automatically start a web browser to connect to the running web application when debugging, Live Share automatically does the same on each guest's machine! This process is done in a secure way and, by default, the remote web application is only available to guests during the debugging session.
See share a server for information on how to share server access for other project types and during the session.
Tip
If you don't like the automated browser sharing behavior and want to change it, you can update settings in Tools > Options > Live Share.
Change when Visual Studio joins debugging sessions
Guests are automatically attached to debugging sessions when the host shares them by default. However, in some cases you might find this behavior disruptive. Fortunately, you can change it as follows:
- Go to Tools > Options > Live Share
- Change the Debug session join behavior to one of the following:
| Option | Behavior |
|---|---|
| Automatic | The default. As a guest, you'll automatically join any shared debugging session the host starts. |
| Prompt | As a guest, you're prompted to join a shared debugging session when it's started by the host. |
| Manual | As a guest, you'll need to manually join any debugging sessions. See detaching and reattaching. |
Detaching and reattaching
As a guest, you might want to stop debugging temporarily. You can click the stop icon in the debug toolbar to detach the debugger without affecting the host or other guests.
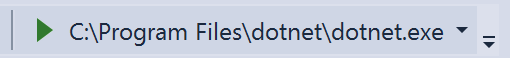
You might have updated settings so you no longer auto-attach, or want to reattach later. You can select the preferred running debugging session from the Select Startup Item... drop-down.
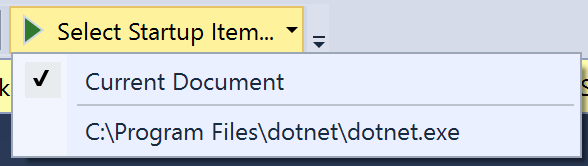
Then click it to attach.