Investigate incidents in Microsoft Defender for Endpoint
Applies to:
- Microsoft Defender for Endpoint Plan 1
- Microsoft Defender for Endpoint Plan 2
- Microsoft Defender XDR
Investigate incidents that affect your network, understand what they mean, and collate evidence to resolve them.
When you investigate an incident, you'll see:
- Incident details
- Incident comments and actions
- Tabs (alerts, devices, investigations, evidence, graph)
Analyze incident details
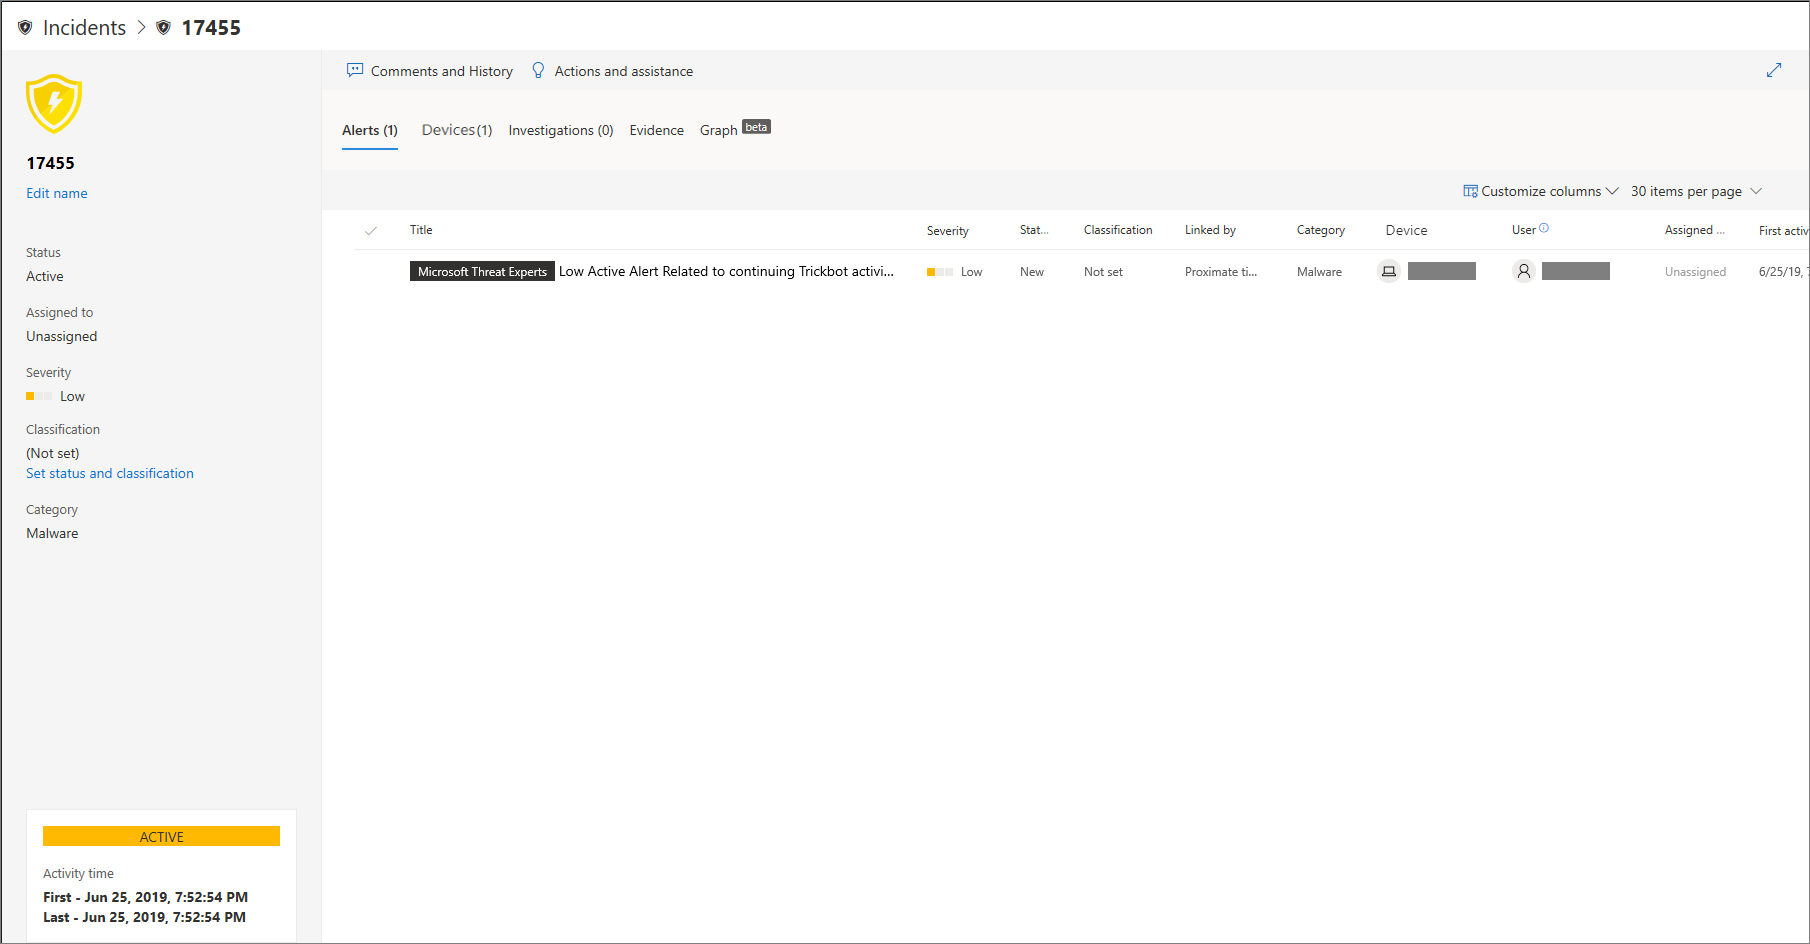
Click an incident to see the Incident pane. Select Open incident page to see the incident details and related information (alerts, devices, investigations, evidence, graph).
Alerts
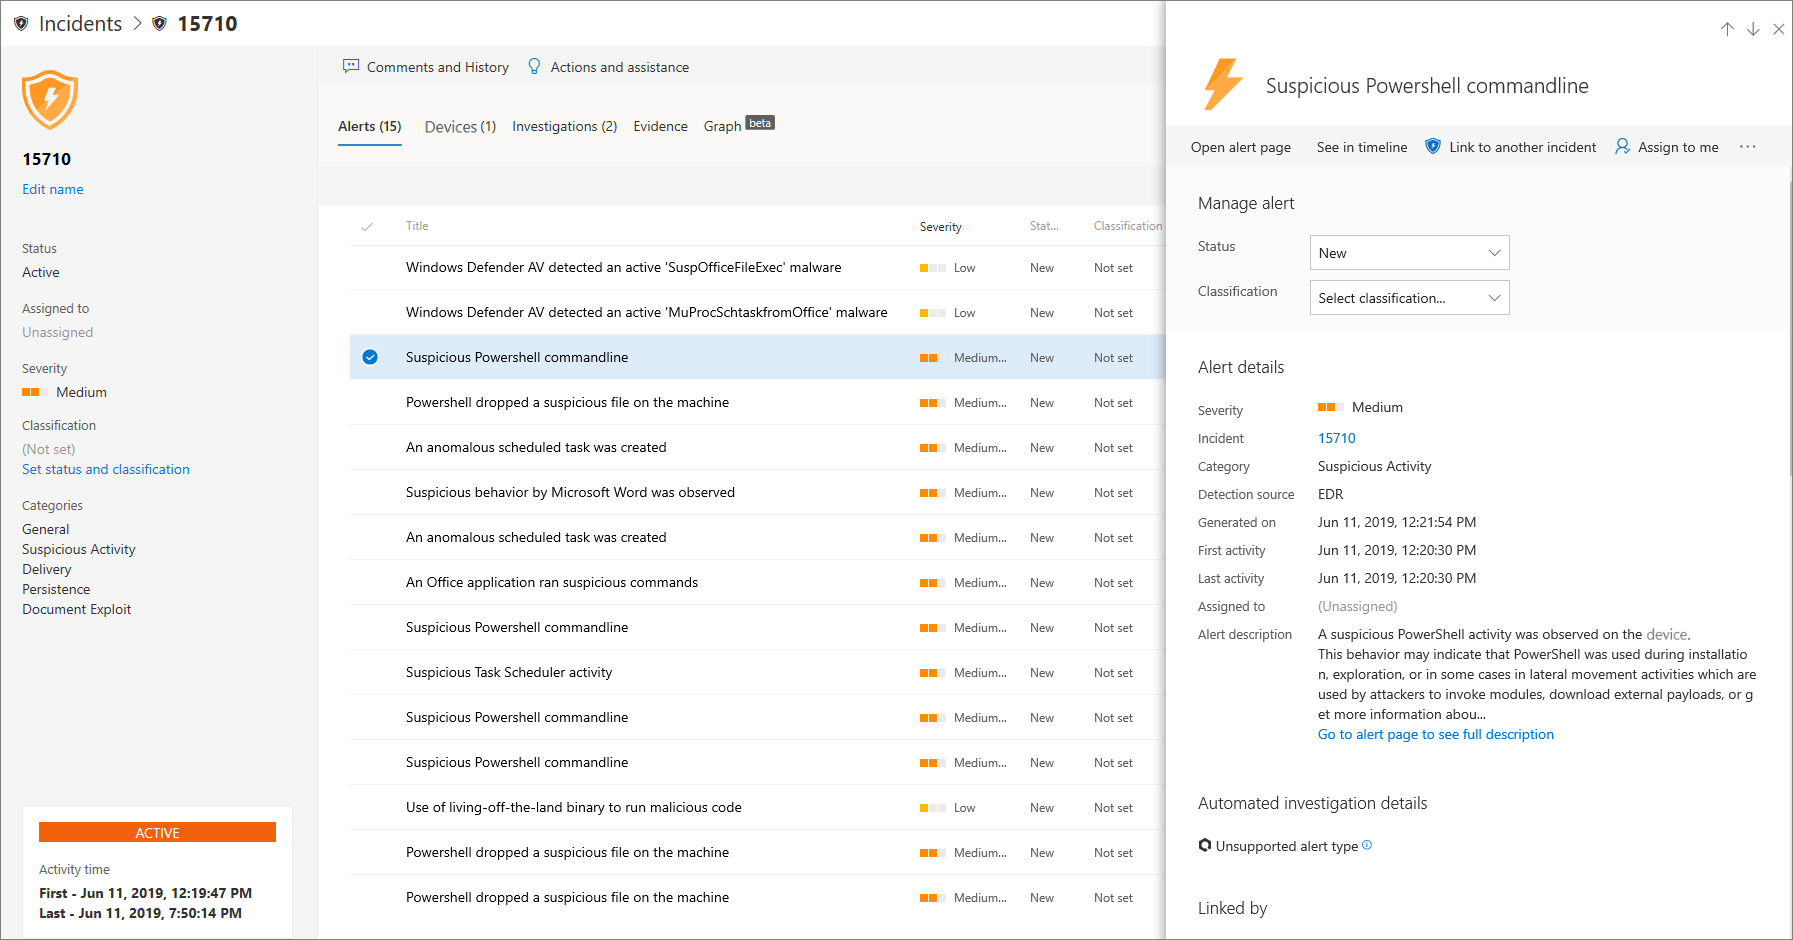
You can investigate the alerts and see how they were linked together in an incident. Alerts are grouped into incidents based on the following reasons:
- Automated investigation - The automated investigation triggered the linked alert while investigating the original alert
- File characteristics - The files associated with the alert have similar characteristics
- Manual association - A user manually linked the alerts
- Proximate time - The alerts were triggered on the same device within a certain timeframe
- Same file - The files associated with the alert are exactly the same
- Same URL - The URL that triggered the alert is exactly the same
You can also manage an alert and see alert metadata along with other information. For more information, see Investigate alerts.
Devices
You can also investigate the devices that are part of, or related to, a given incident. For more information, see Investigate devices.
Investigations
Select Investigations to see all the automatic investigations launched by the system in response to the incident alerts.
Going through the evidence
Microsoft Defender for Endpoint automatically investigates all the incidents' supported events and suspicious entities in the alerts, providing you with autoresponse and information about the important files, processes, services, and more.
Each of the analyzed entities will be marked as infected, remediated, or suspicious.
Visualizing associated cybersecurity threats
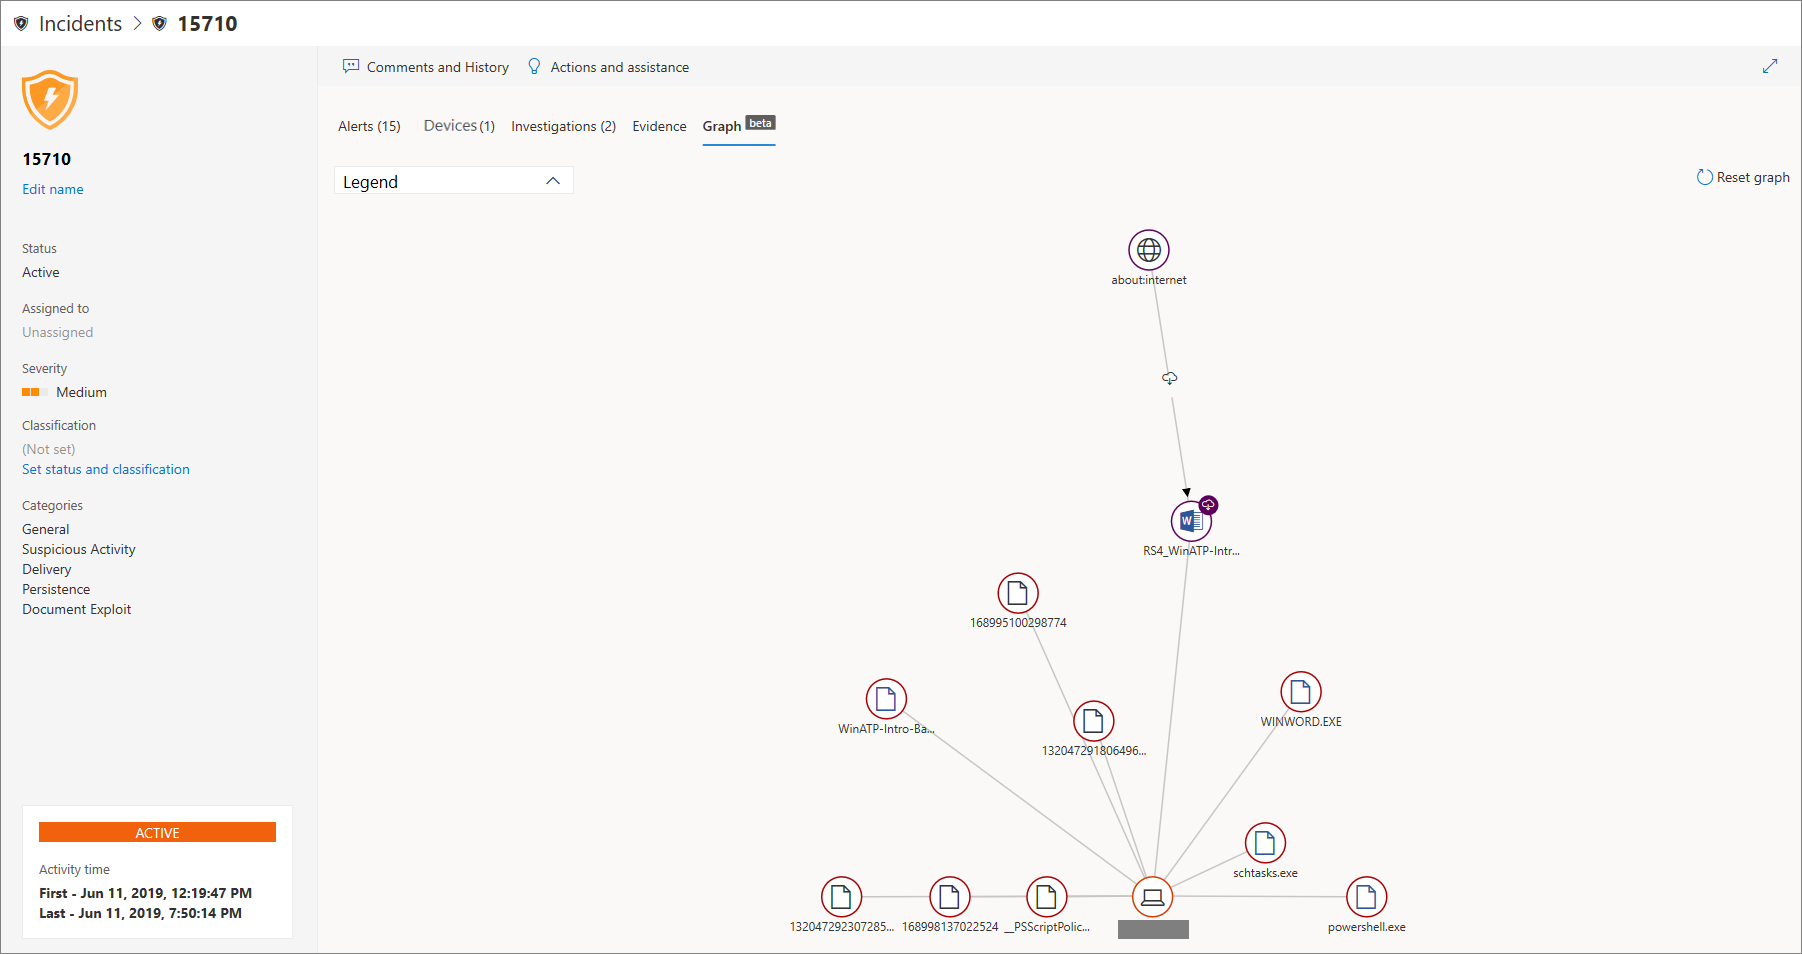
Microsoft Defender for Endpoint aggregates the threat information into an incident so you can see the patterns and correlations coming in from various data points. You can view such correlation through the incident graph.
Incident graph
The Graph tells the story of the cybersecurity attack. For example, it shows you what was the entry point, which indicator of compromise or activity was observed on which device. etc.
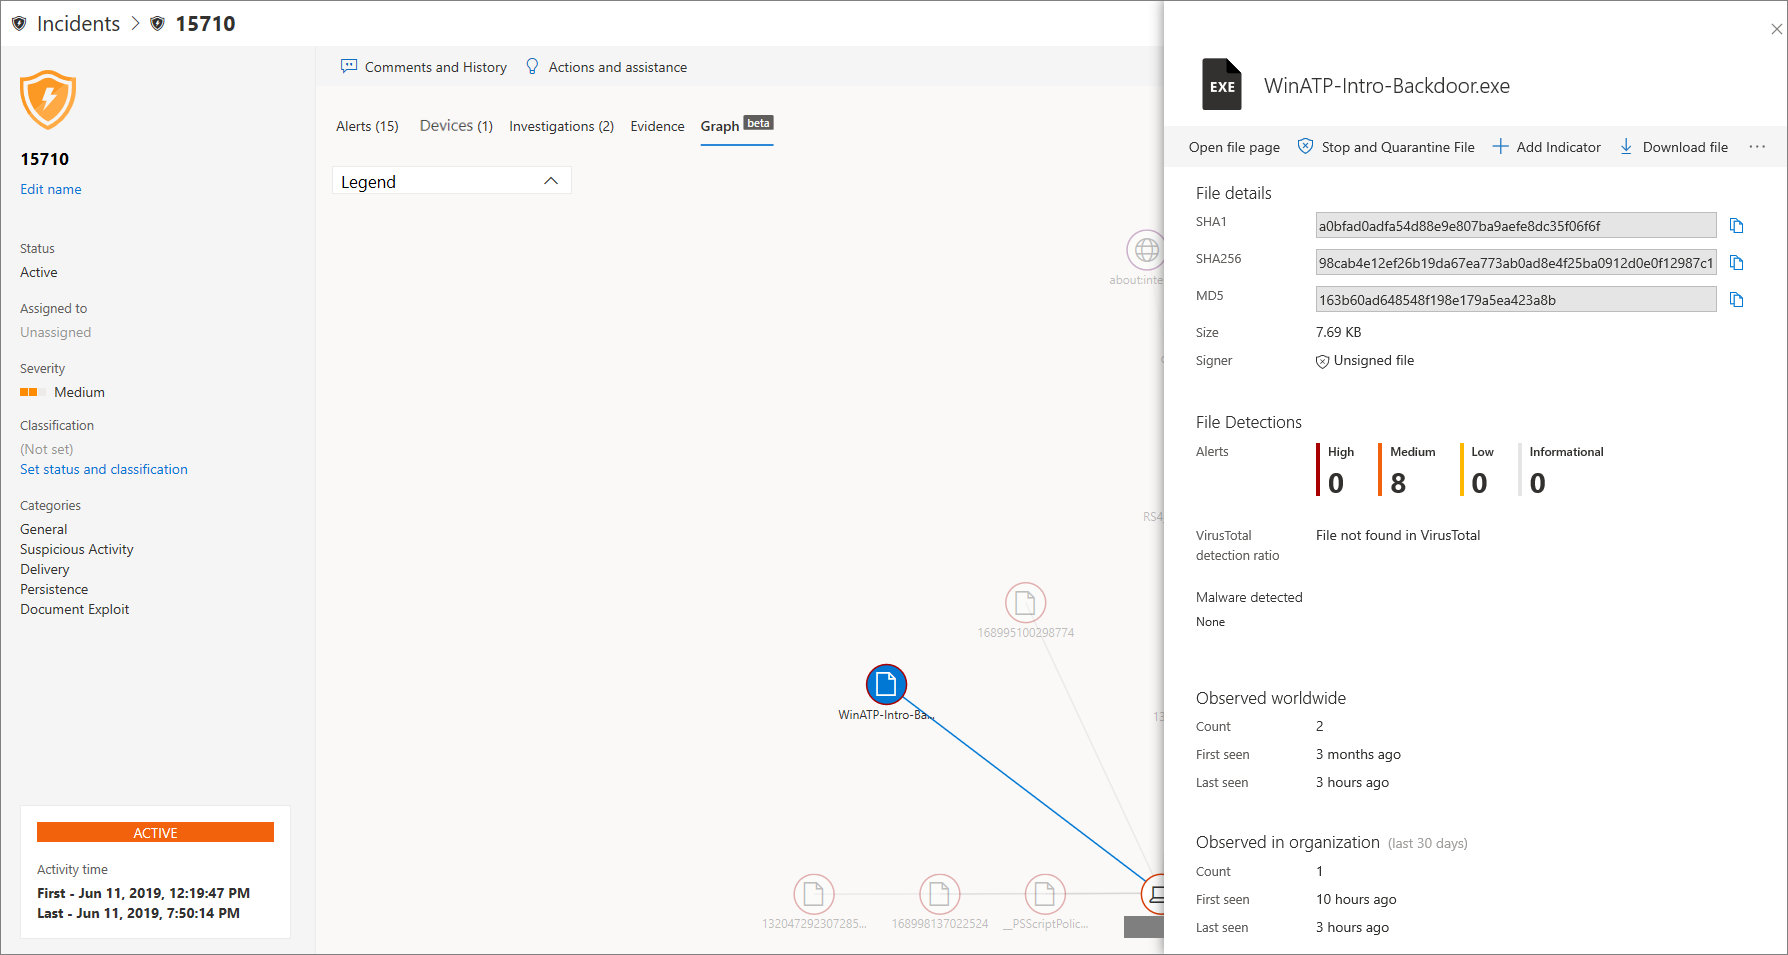
You can click the circles on the incident graph to view the details of the malicious files, associated file detections, how many instances have there been worldwide, whether it's been observed in your organization, if so, how many instances.
Related topics
- Incidents queue
- Investigate incidents in Microsoft Defender for Endpoint
- Manage Microsoft Defender for Endpoint incidents
Tip
Do you want to learn more? Engage with the Microsoft Security community in our Tech Community: Microsoft Defender for Endpoint Tech Community.


