Note
Access to this page requires authorization. You can try signing in or changing directories.
Access to this page requires authorization. You can try changing directories.
You can use Azure Database for MySQL Flexible Server to configure audit logs. Audit logs can be used to track database-level activity, including connection, administration, data definition language (DDL), and data manipulation language (DML) events. These types of logs are commonly used for compliance purposes. You ordinarily use database auditing to:
- Account for all actions that happen within a particular schema, table, or row, or that affect specific content.
- Prevent users (or others) from inappropriate actions based on their accountability.
- Investigate suspicious activity.
- Monitor and gather data about specific database activities.
This article discusses how to use MySQL audit logs, Log Analytics tools, or a workbook template to visualize auditing information for Azure Database for MySQL Flexible Server.
In this tutorial, you'll learn how to:
- Configure auditing by using the Azure portal or the Azure CLI
- Set up diagnostics
- View audit logs by using Log Analytics
- View audit logs by using workbooks
Prerequisites
- Quickstart: Create an instance of Azure Database for MySQL with the Azure portal.
- Create a Log Analytics workspace.
Configure auditing by using the Azure portal
Sign in to the Azure portal.
Select your flexible server instance.
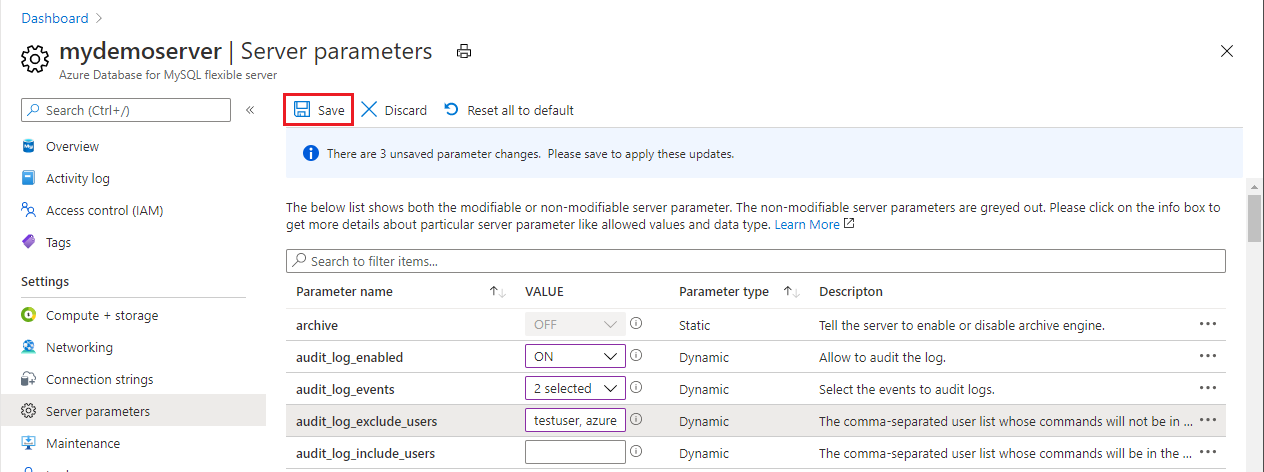
On the left pane, under Settings, select Server parameters.
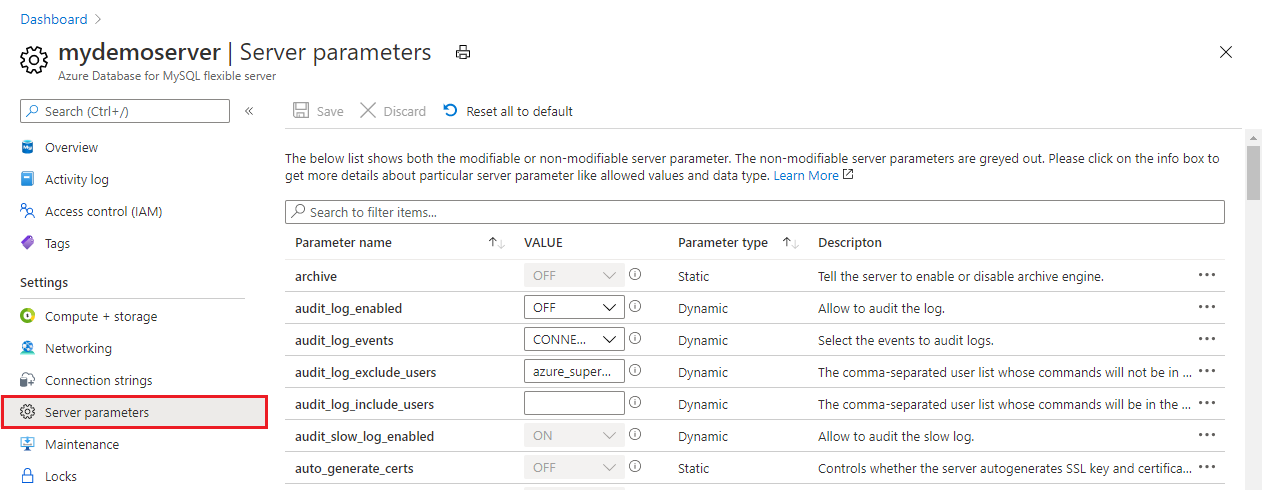
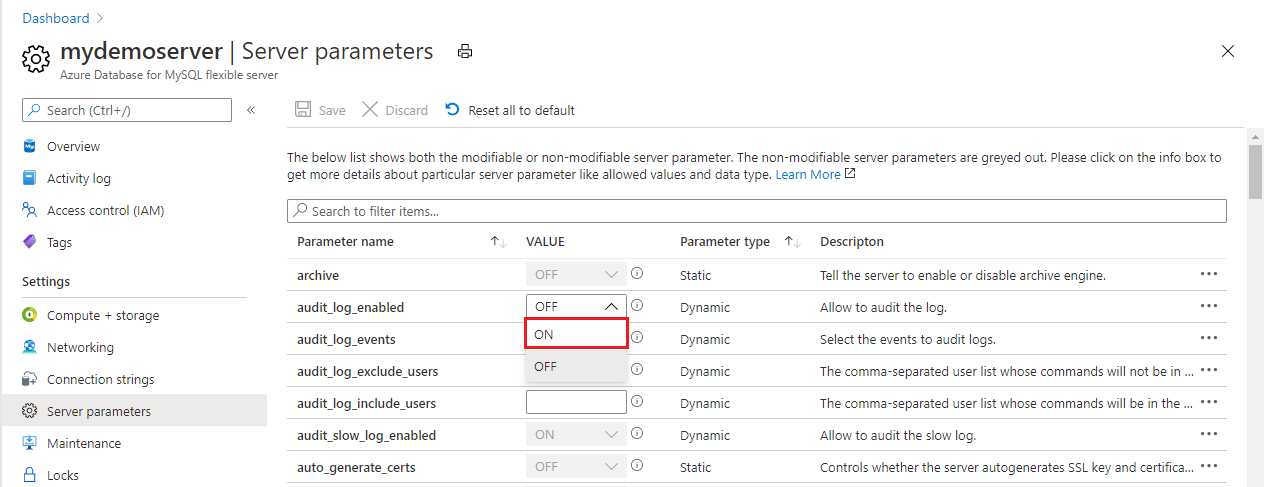
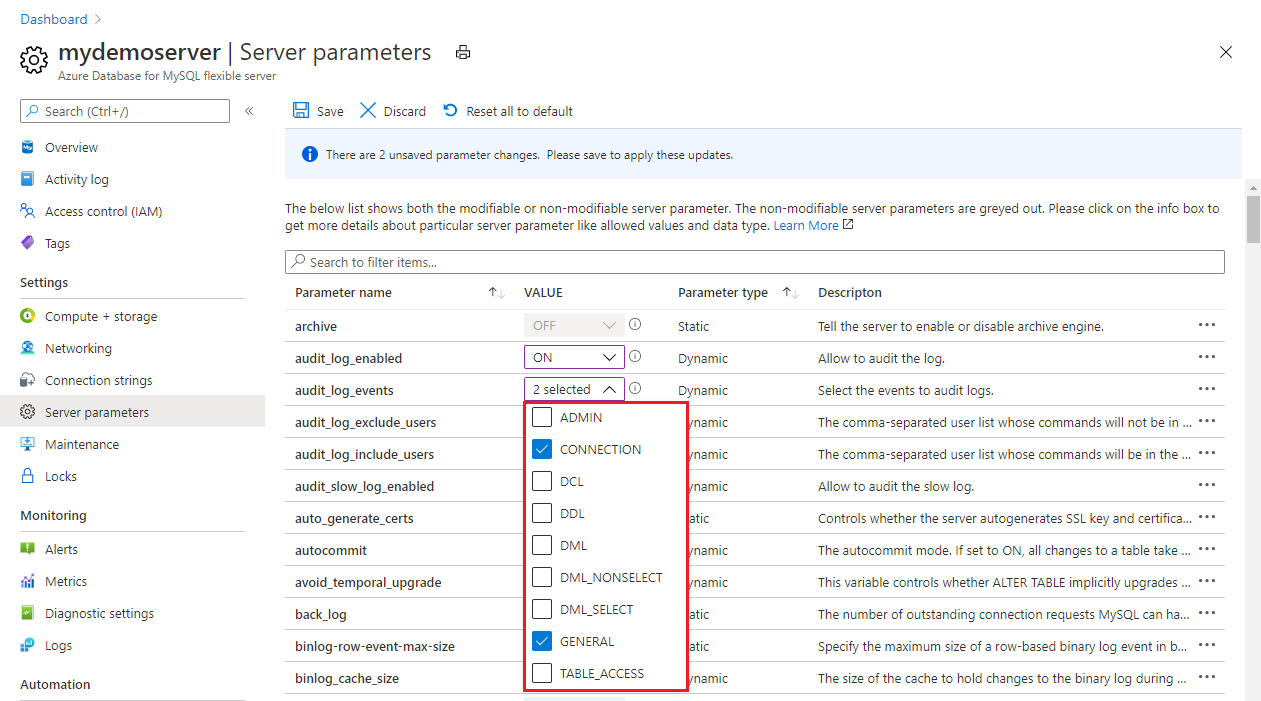
For the audit_log_enabled parameter, select ON.
For the audit_log_events parameter, in the dropdown list, select the event types to be logged.
For the audit_log_exclude_users and audit_log_include_users parameters, specify any MySQL users to be included or excluded from logging by providing their MySQL usernames.
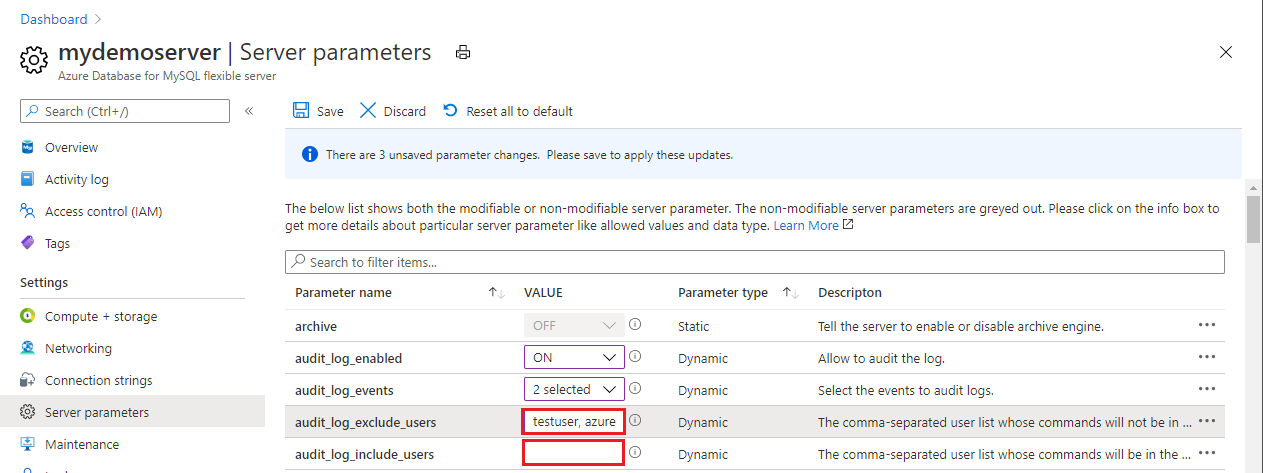
Select Save.


Configure auditing by using the Azure CLI
Alternatively, you can enable and configure auditing for your flexible server from the Azure CLI by running the following command:
# Enable audit logs
az mysql flexible-server parameter set \
--name audit_log_enabled \
--resource-group myresourcegroup \
--server-name mydemoserver \
--value ON
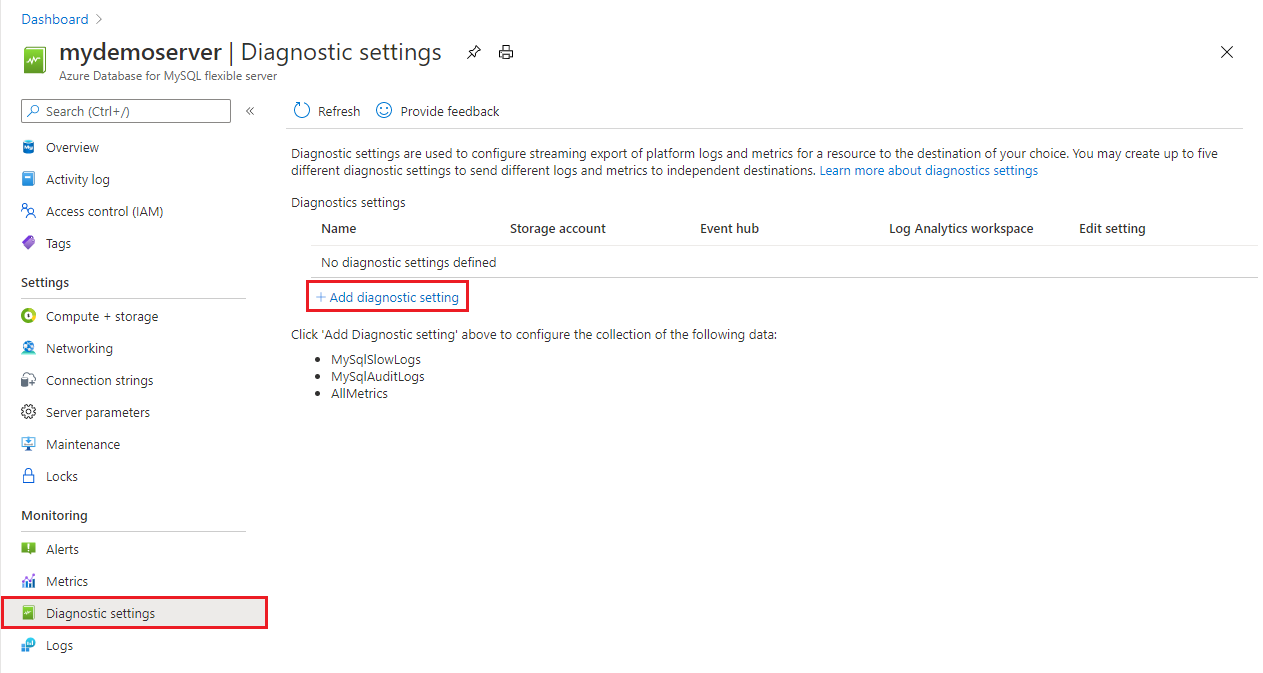
Set up diagnostics
Audit logs are integrated with Azure Monitor diagnostics settings to allow you to pipe your logs to any of three data sinks:
- A Log Analytics workspace
- An event hub
- A storage account
Note
You should create your data sinks before you configure the diagnostics settings. You can access the audit logs in the data sinks you've configured. It can take up to 10 minutes for the logs to appear.
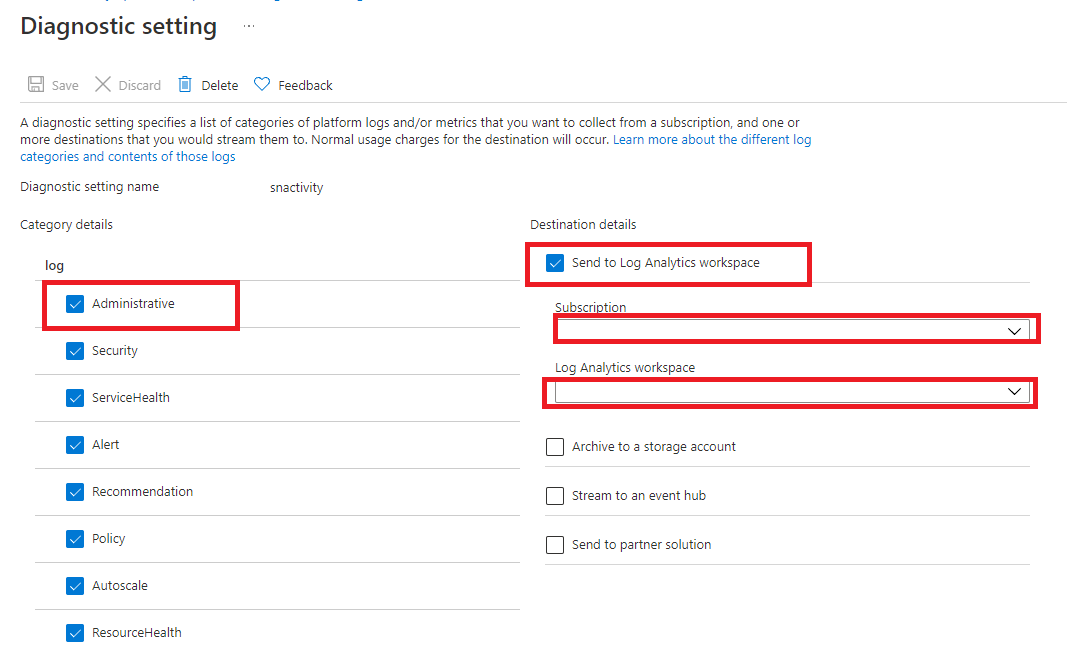
On the left pane, under Monitoring, select Diagnostic settings.
On the Diagnostics settings pane, select Add diagnostic setting.
In the Name box, enter a name for the diagnostics setting.
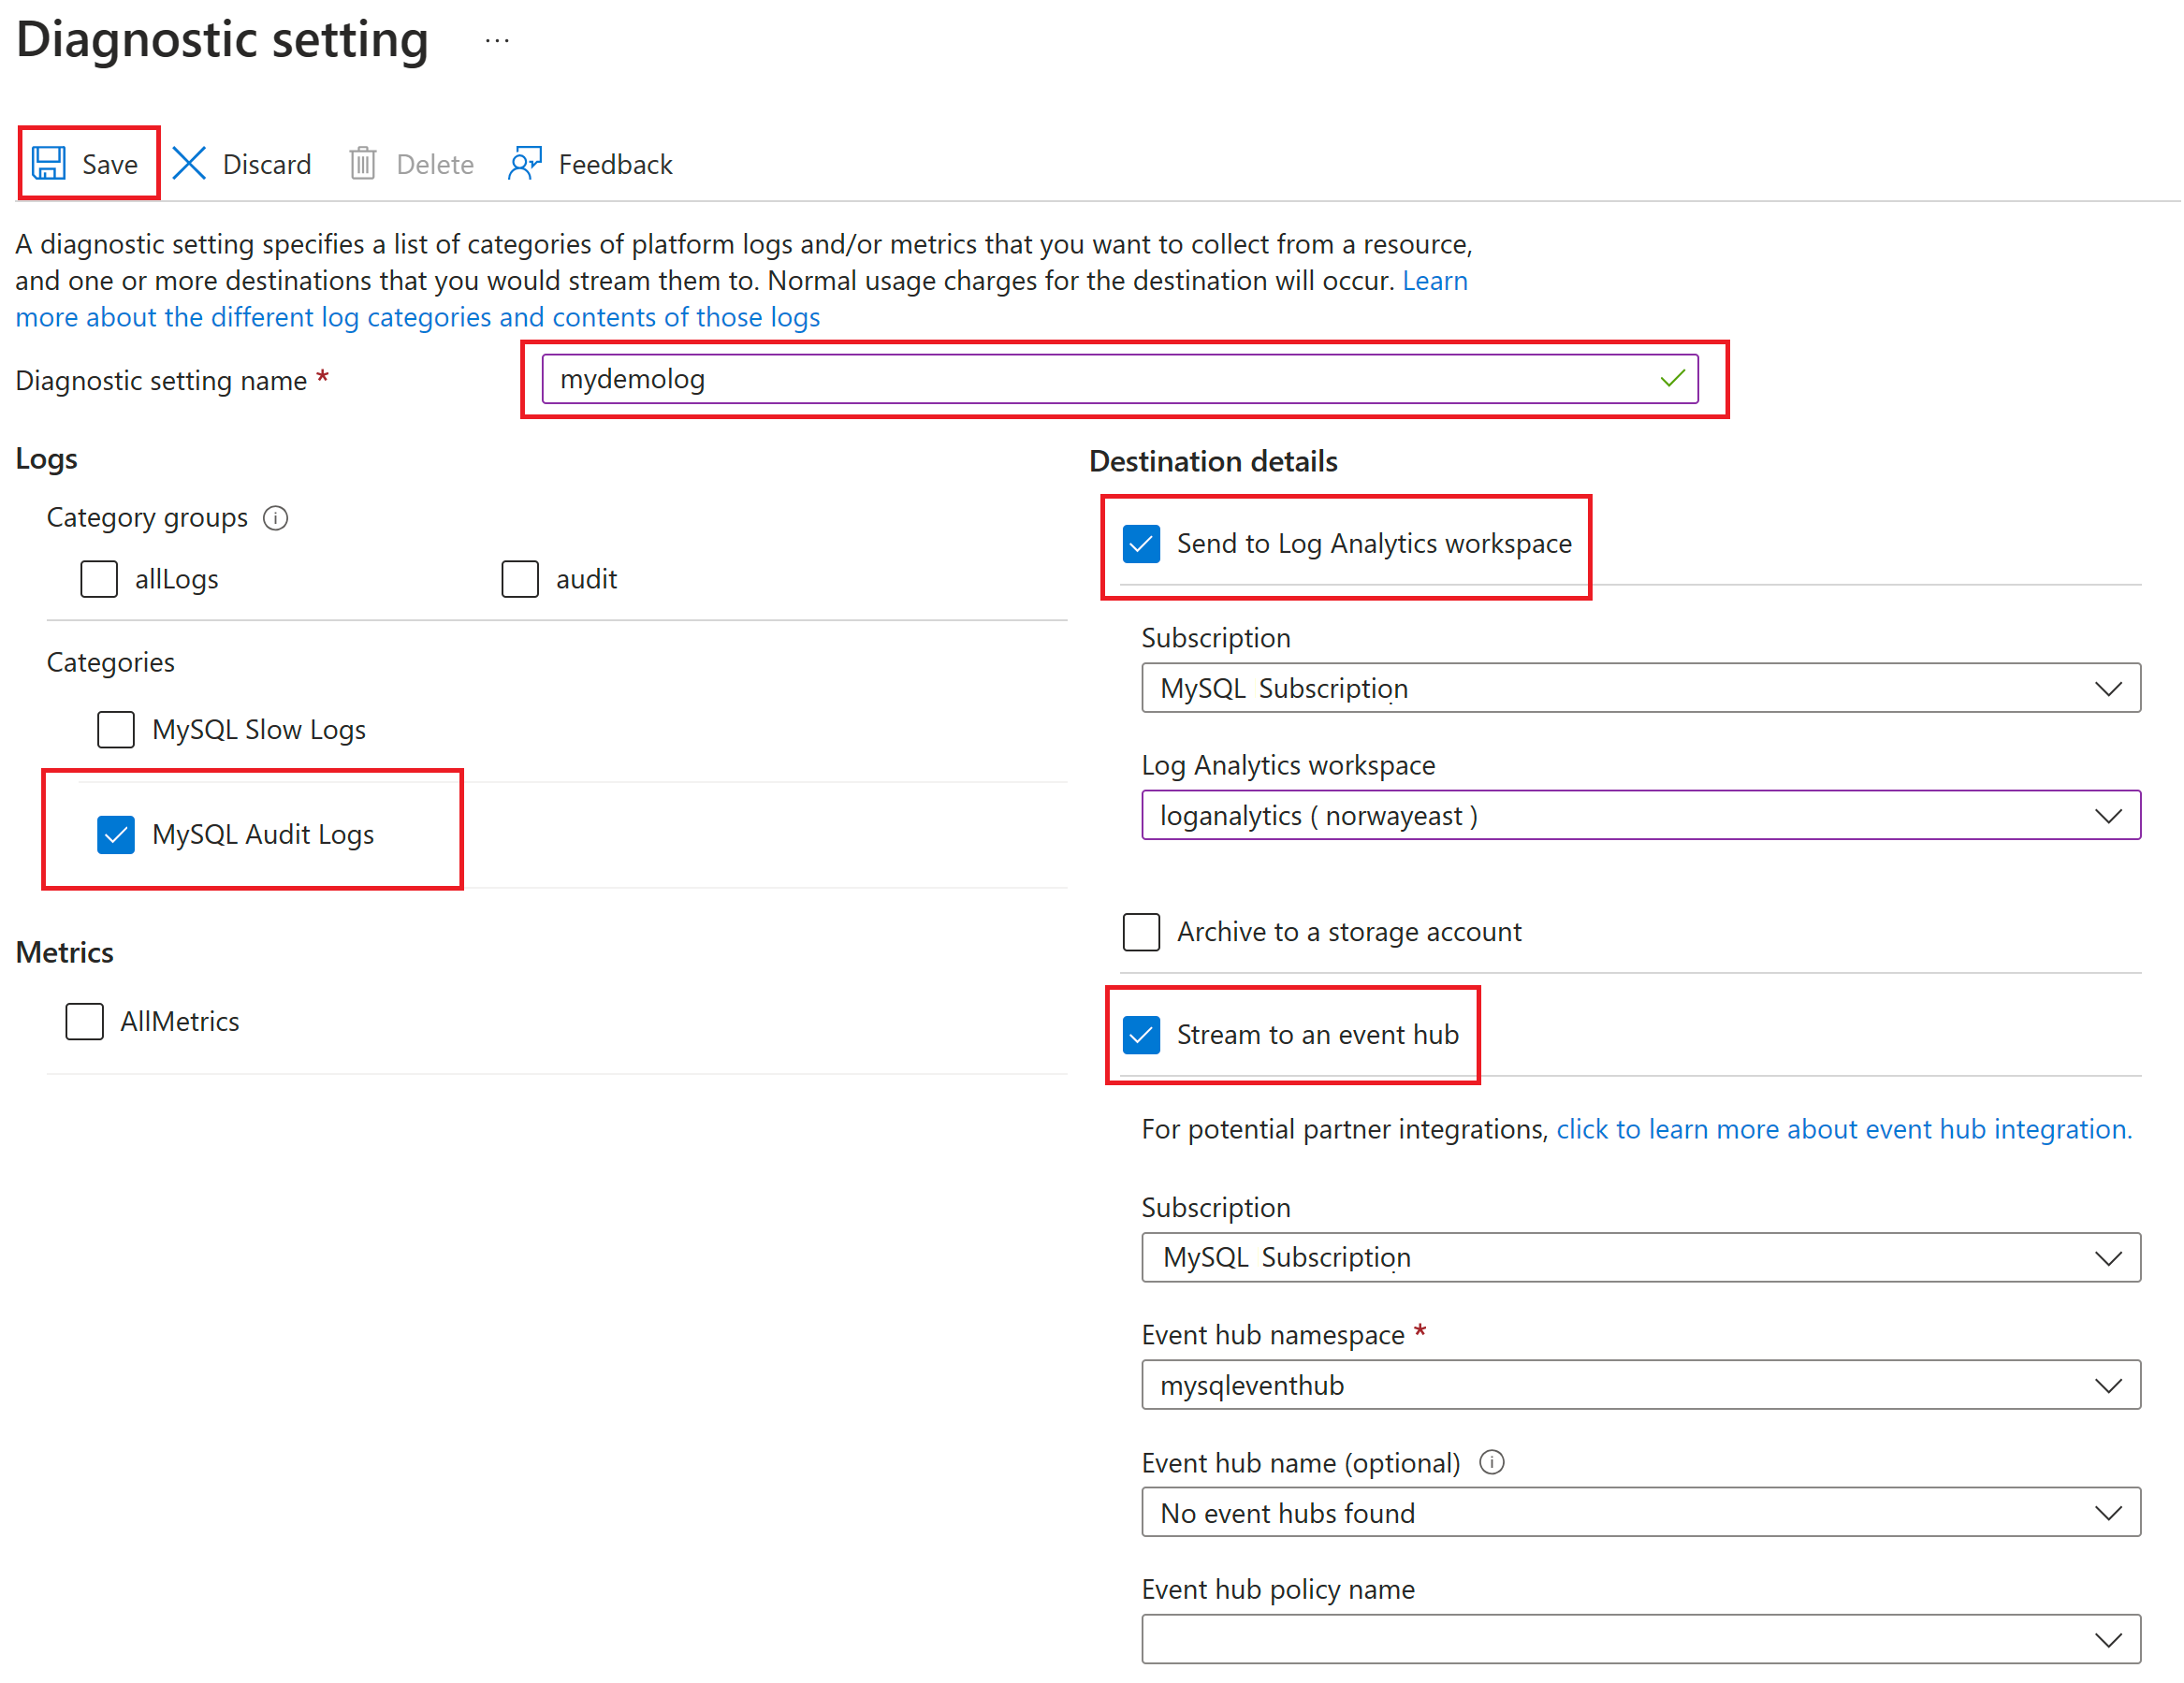
Specify which destinations (Log Analytics workspace, an event hub, or a storage account) to send the audit logs to by selecting their corresponding checkboxes.
Note
For this tutorial, you'll send the audit logs to a Log Analytics workspace.
Under Log, for the log type, select the MySqlAuditLogs checkbox.
After you've configured the data sinks to pipe the audit logs to, select Save.


View audit logs by using Log Analytics
In Log Analytics, on the left pane, under Monitoring, select Logs.
Close the Queries window.
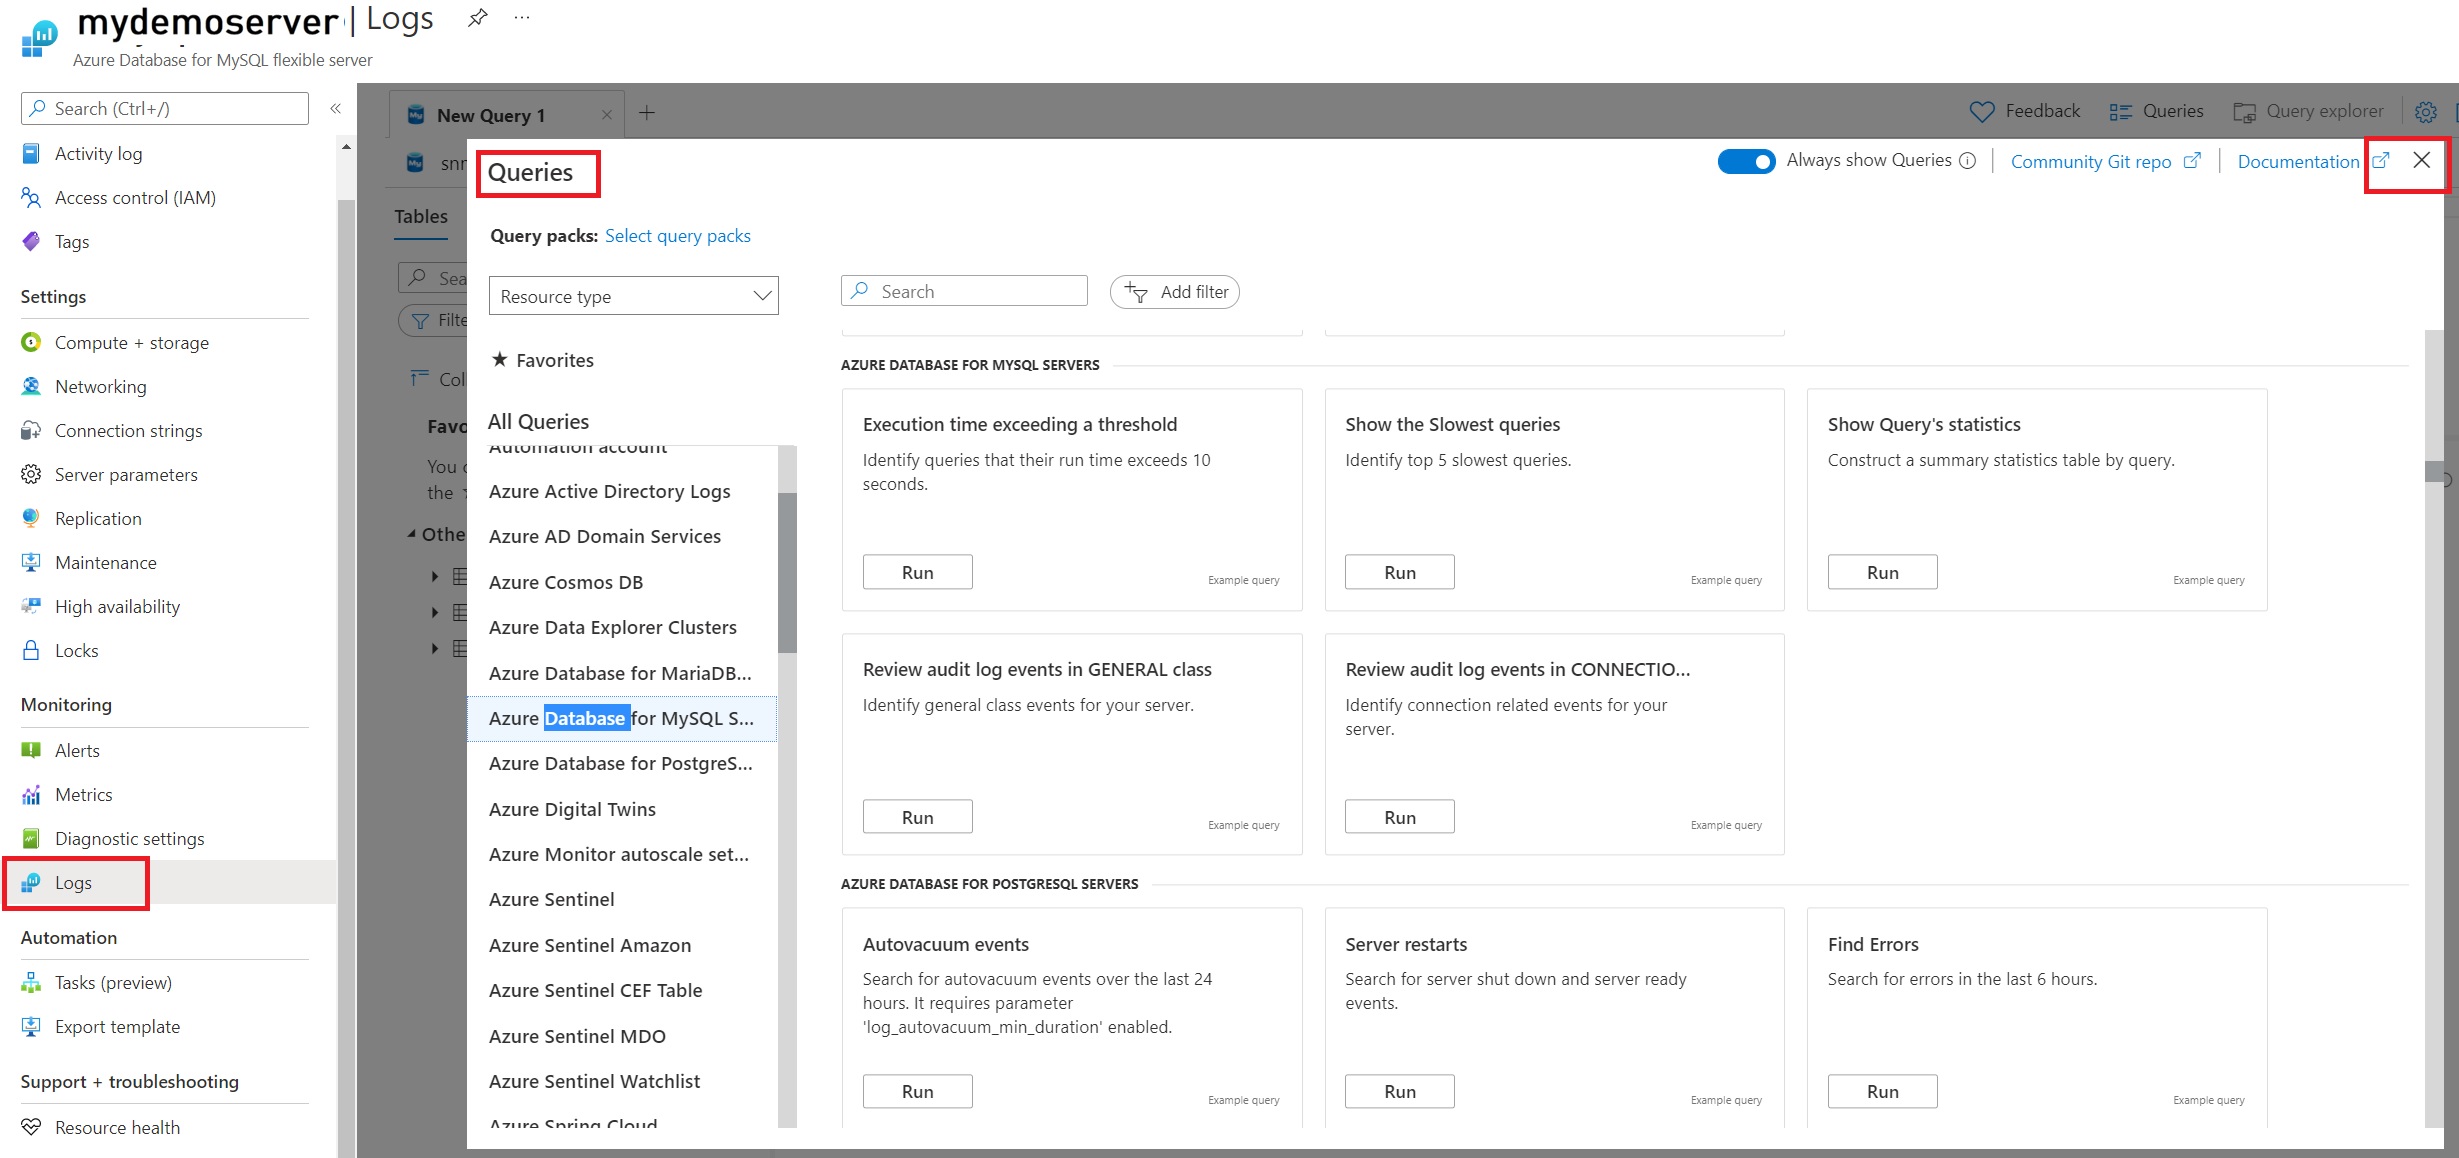
In the query window, you can write the query to be executed. For example, to find a summary of audited events on a particular server, we've used the following query:
AzureDiagnostics
    |where Category =='MySqlAuditLogs'
    |project TimeGenerated, Resource, event_class_s, event_subclass_s, event_time_t, user_s ,ip_s , sql_text_s
    |summarize count() by event_class_s,event_subclass_s
    |order by event_class_s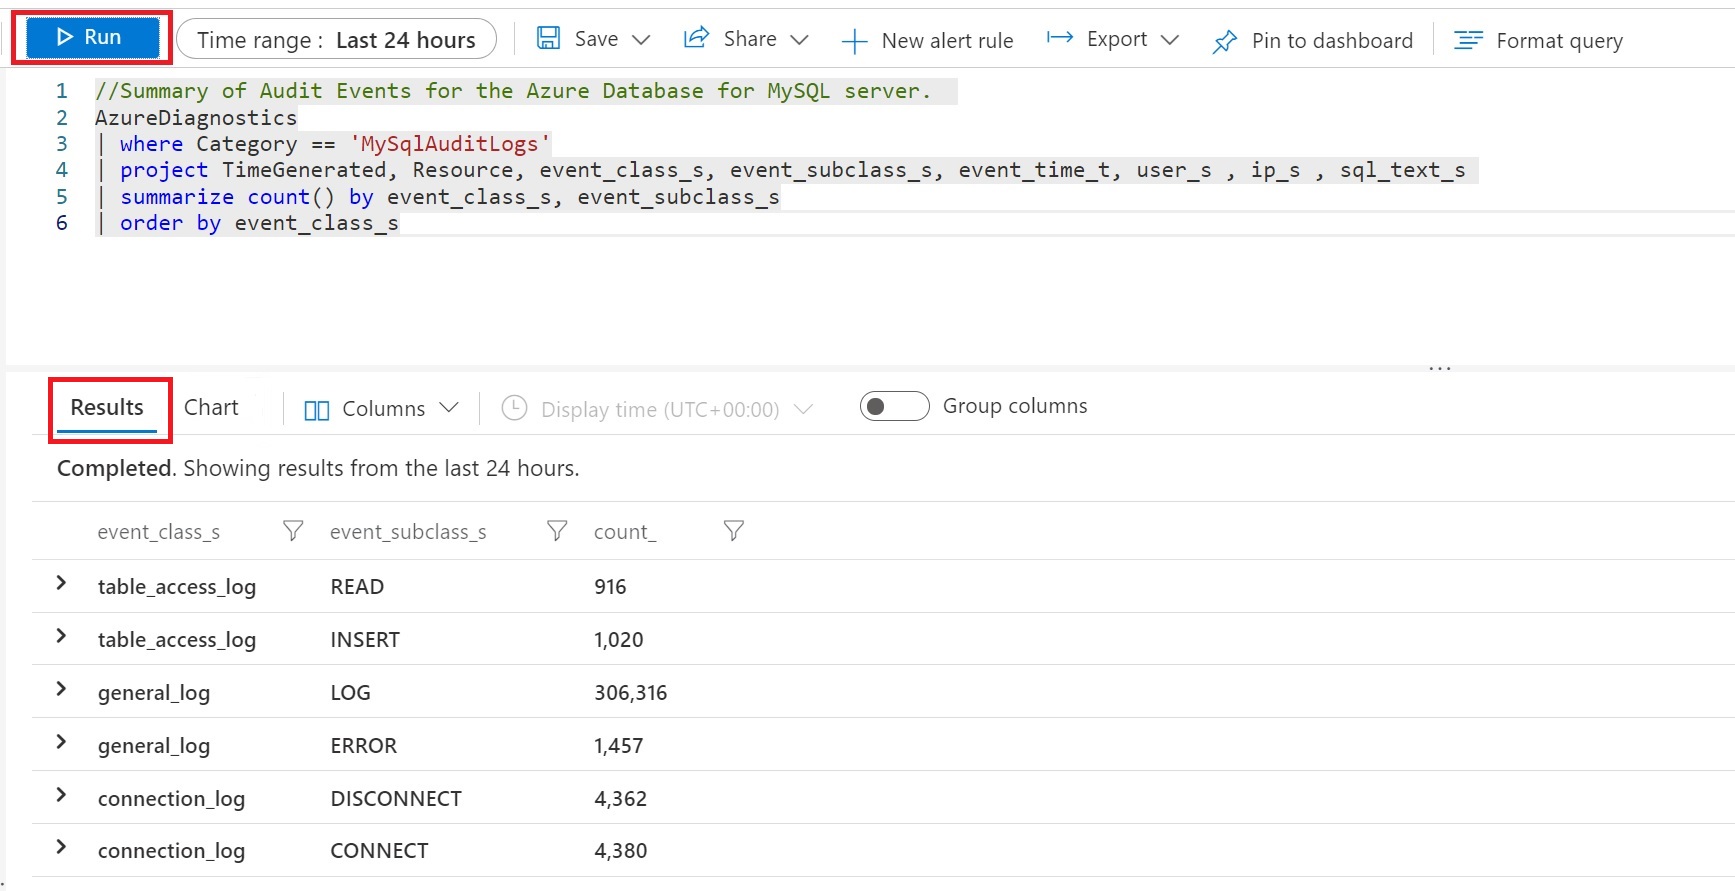
View audit logs by using workbooks
The workbook template that you use for auditing requires you to create diagnostics settings to send platform logs.
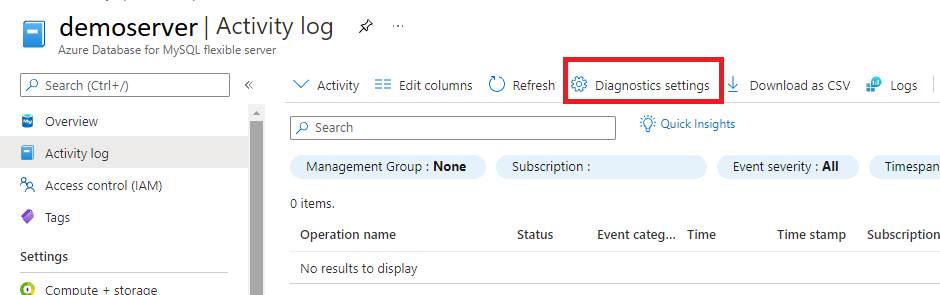
In Azure Monitor, on the left pane, select Activity log, and then select Diagnostics settings.
On the Diagnostic setting pane, you can add a new setting or edit an existing one. Each setting can have no more than one of each destination type.
Note
You can access the slow query logs in the data sinks (Log Analytics workspace, storage account, or event hub) that you've already configured. It can take up to 10 minutes for the logs to appear.
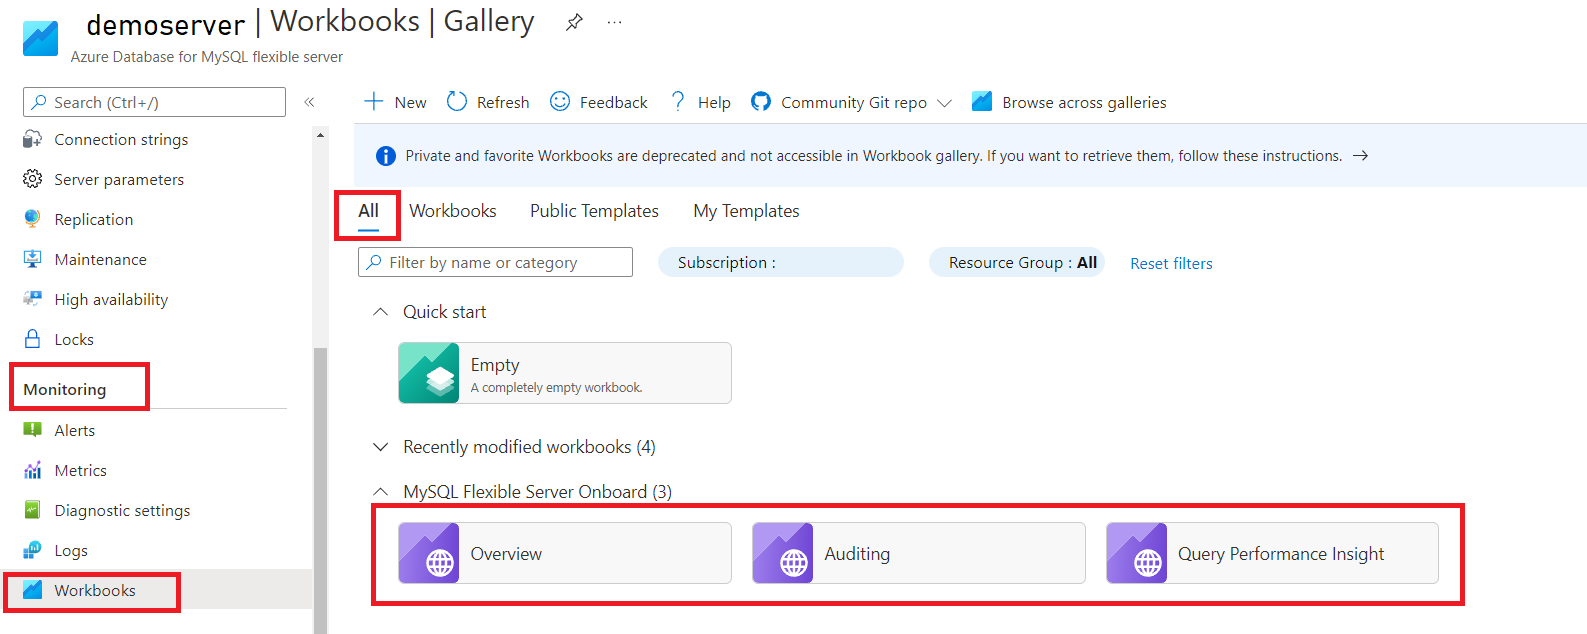
In the Azure portal, on the left pane, under Monitoring for your Azure Database for MySQL Flexible Server instance, select Workbooks.
Select the Auditing workbook.


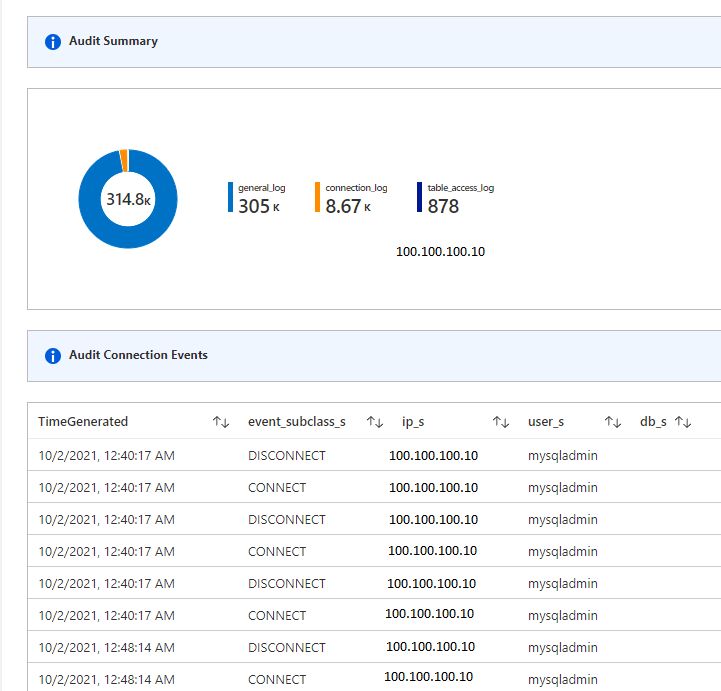
In the workbook, you can view the following visualizations:
- Administrative Actions on the service
- Audit Summary
- Audit Connection Events Summary
- Audit Connection Events
- Table Access Summary
- Errors Identified

Note
- You can also edit these templates and customize them according to your requirements. For more information, see the "Editing mode" section of Azure Workbooks.
- For a quick view, you can also pin the workbooks or Log Analytics query to your dashboard. For more information, see Create a dashboard in the Azure portal.
The Administrative Actions on the service view gives you details on activity performed on the service. It helps to determine the what, who, and when for any write operations (PUT, POST, DELETE) that are performed on the resources in your subscription.
You can use other visualizations to help you understand the details of database activity. Database security has four parts:
- Server security: Responsible for preventing unauthorized personnel from accessing the database.
- Database connection: The administrator should check to see whether any database updates have been performed by authorized personnel.
- Table access control: Shows the access keys of the authorized users and what tables within the database each is authorized to handle.
- Database access restriction: Particularly important for those who've uploaded a database to the internet, and helps prevent outside sources from getting access to your database.