Note
Access to this page requires authorization. You can try signing in or changing directories.
Access to this page requires authorization. You can try changing directories.
Dashboards are a focused and organized view of your cloud resources in the Azure portal. Use dashboards as a workspace where you can monitor resources and quickly launch tasks for day-to-day operations. For example, you can build custom dashboards based on projects, tasks, or user roles in your organization.
Important
This article describes the older dashboard experience, which you can still access. If you're using the improved dashboard editing experience, see Create and manage dashboards in Dashboard hub (preview).
The Azure portal provides a default dashboard as a starting point. You can edit this default dashboard, and you can create and customize additional dashboards.
All dashboards are private when created, and each user can create up to 100 private dashboards. If you publish and share a dashboard with other users in your organization, the shared dashboard is implemented as an Azure resource in your subscription, and doesn't count towards the private dashboard limit.
Create a new dashboard
This example shows how to create a new private dashboard with an assigned name.
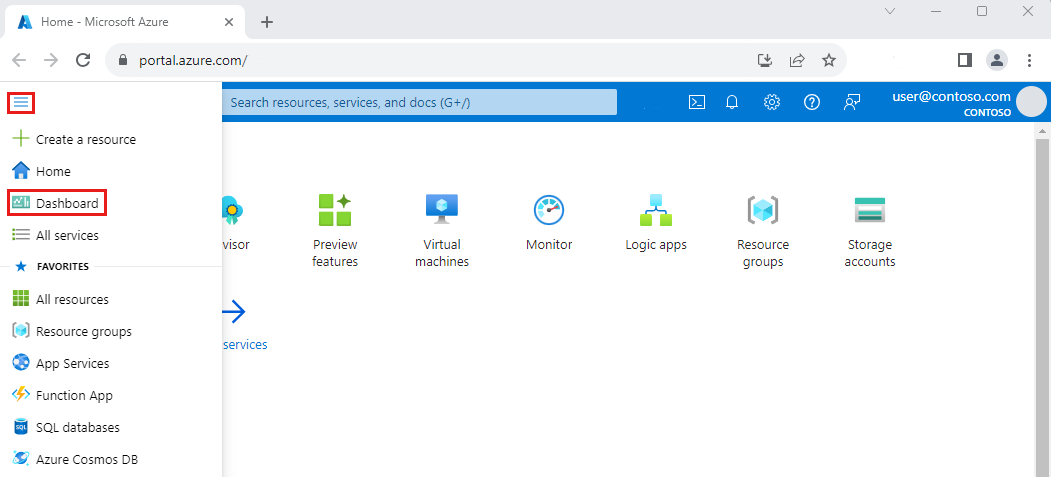
Sign in to the Azure portal.
From the Azure portal menu, select Dashboard. Your default view might already be set to dashboard.
Select Create, then select Custom.
This action opens the Tile Gallery, from which you can select tiles that display different types of information. You'll also see an empty grid representing the dashboard layout, where you can arrange the tiles.
Select the text in the dashboard label and enter a name that will help you easily identify the custom dashboard.
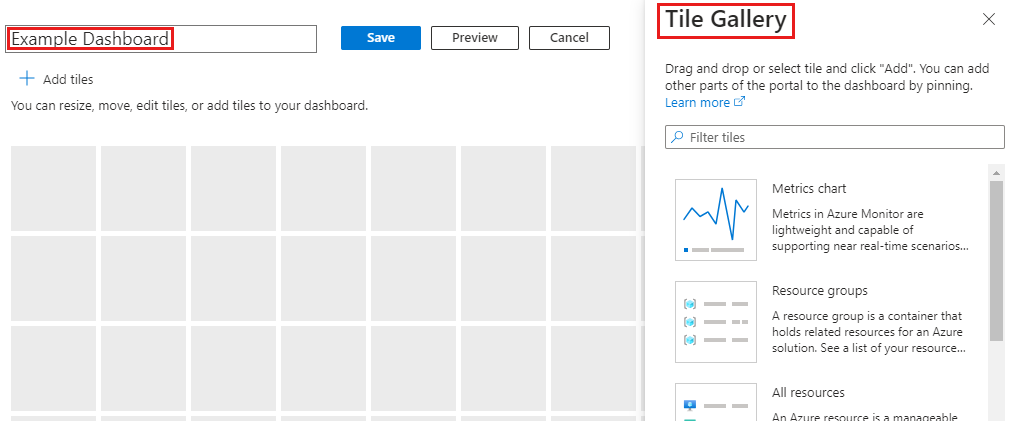
To save the dashboard as is, select Save in the page header.
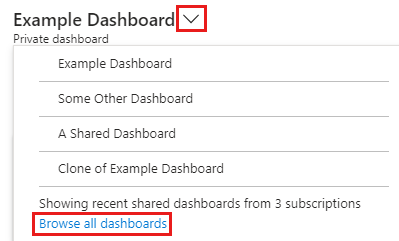
The dashboard view now shows your new dashboard. Select the arrow next to the dashboard name to see other available dashboards. The list might include dashboards that other users have created and shared.
Tip
If you have an existing dashboard and want to create a new one that is similar, you can clone your dashboard and use the duplicate copy as a starting point.
Edit a dashboard
Now, let's edit the example dashboard you created to add, resize, and arrange tiles that show your Azure resources or display other helpful information. We'll start by working with the Tile Gallery, then explore other ways to customize dashboards.
Add tiles from the Tile Gallery
To add tiles to a dashboard by using the Tile Gallery, follow these steps.
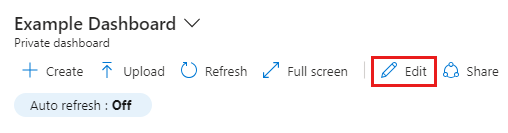
Select Edit from the dashboard's page header.
Browse the Tile Gallery or use the search field to find a certain tile. Select the tile you want to add to your dashboard.
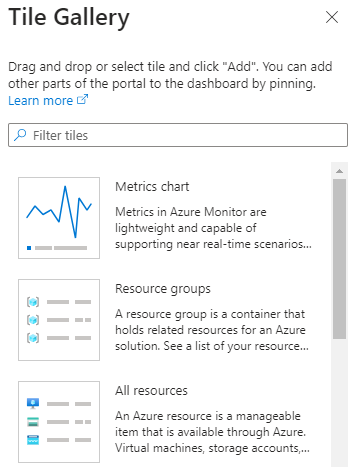
Select Add to add the tile to the dashboard with a default size and location. Or, drag the tile to the grid and place it where you want.
To save your changes, select Save. You can also preview the changes without saving by selecting Preview. This preview mode also allows you to see how filters affect your tiles. From the preview screen, you can select Save to keep the changes, Cancel to remove them, or Edit to go back to the editing options and make further changes.

Resize or rearrange tiles
To change the size of a tile, or to rearrange the tiles on a dashboard, follow these steps:
Select Edit from the page header.
Select the context menu in the upper right corner of a tile. Then, choose a tile size. Tiles that support any size also include a "handle" in the lower right corner that lets you drag the tile to the size you want.
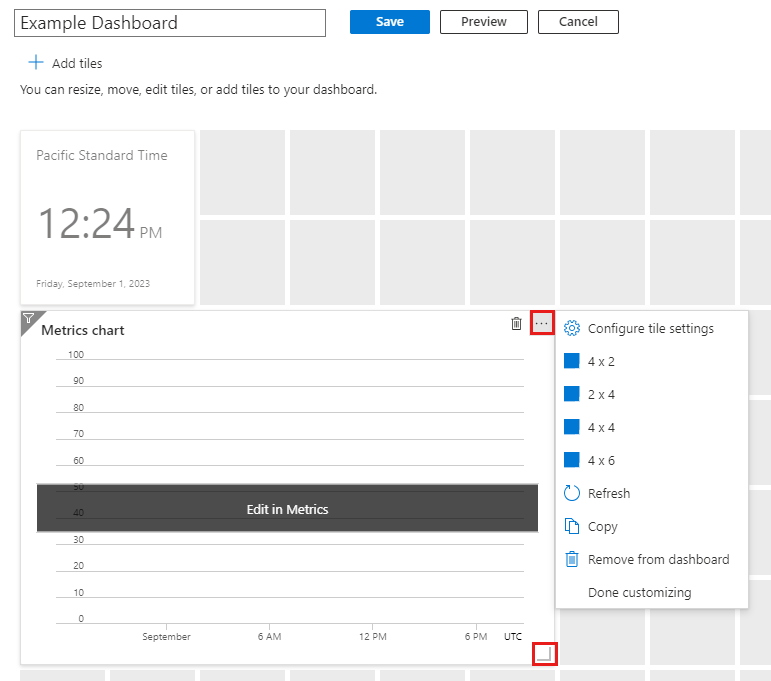
Select a tile and drag it to a new location on the grid to arrange your dashboard.
When you're finished, select Save.
Pin content from a resource page
Another way to add tiles to your dashboard is directly from a resource page.
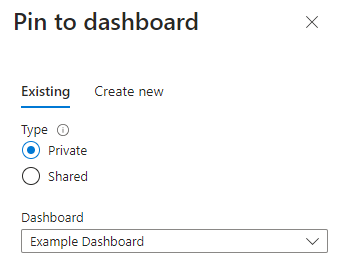
Many resource pages include a pin icon in the page header, which means that you can pin a tile representing the source page. In some cases, a pin icon may also appear by specific content within a page, which means you can pin a tile for that specific content, rather than the entire page.
![]()
Select this icon to pin the tile to an existing private or shared dashboard. You can also create a new dashboard which will include this pin by selecting Create new.
Copy a tile to a new dashboard
If you want to reuse a tile on a different dashboard, you can copy it from one dashboard to another. To do so, select the context menu in the upper right corner and then select Copy.
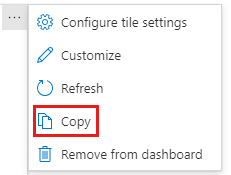
You can then select whether to copy the tile to a different private or shared dashboard, or create a copy of the tile within the dashboard you're already working in. You can also create a new dashboard that includes a copy of the tile by selecting Create new.
Modify tile settings
Important
This article describes the older dashboard experience, which you can still access. If you're using the improved dashboard editing experience, see Create and manage dashboards in Dashboard hub (preview).
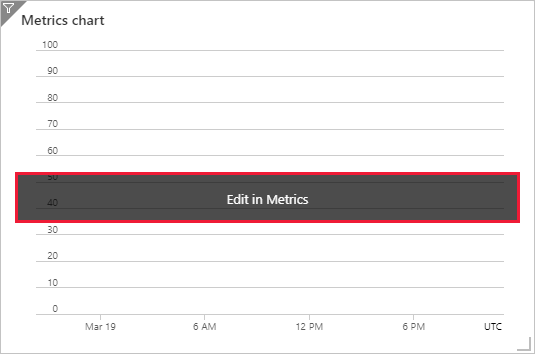
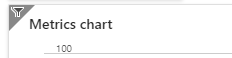
Some tiles might require more configuration to show the information you want. For example, the Metrics chart tile has to be set up to display a metric from Azure Monitor. You can also customize tile data to override the dashboard's default time settings and filters, or to change the title and subtitle of a tile.
Note
The Markdown tile lets you display custom, static content on your dashboard. This can be any information you provide, such as basic instructions, an image, a set of hyperlinks, or even contact information. For more information about using markdown tiles, see Use a markdown tile on Azure dashboards to show custom content.
Change the title and subtitle of a tile
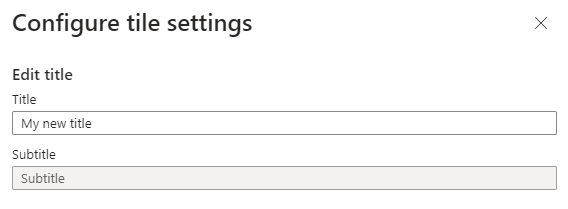
Some tiles allow you to edit their title and/or subtitle. To do so, select Configure tile settings from the context menu.
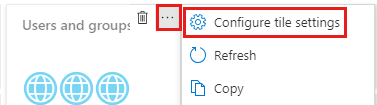
Make your changes, then select Apply.
Complete tile configuration
Any tile that requires configuration displays a banner until you customize the tile. For example, in the Metrics chart, the banner reads Edit in Metrics. Other banners may use different text, such as Configure tile.
To customize the tile:
If needed, select Save or Cancel near the top of the page to exit edit mode.
Select the banner, then do the required setup.
Apply dashboard filters
Near the top of your dashboard, you'll see options to set the Auto refresh and Time settings for data displayed in the dashboard, along with an option to add additional filters.
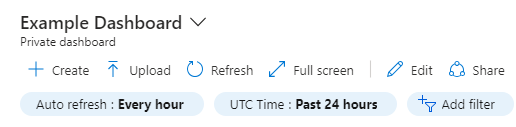
To change how often data is refreshed, select Auto refresh, then choose a new refresh interval. When you've made your selection, select Apply.
The default time settings are UTC Time, showing data for the Past 24 hours. To change this, select the button and choose a new time range, time granularity, and/or time zone, then select Apply.
To apply additional filters, select Add filter. The options you'll see will vary depending on the tiles in your dashboard. For example, you may see options to filter data for a specific subscription or location. In some cases, you'll see that no additional filters are available.
If you see additional filter options, select the one you'd like to use and make your selections. The filter will then be applied to your data.
To remove a filter, select the X in its button.
Override dashboard filters for specific tiles
Tiles which support filtering have a  filter icon in the top-left corner of the tile. These tiles allow you to override the global filters with filters specific to that tile.
To do so, select Configure tile settings from the tile's context menu, or select the filter icon. Then you can change the desired filters for that tile. For example, some tiles provide an option to override the dashboard time settings at the tile level, allowing you to select a different time span to refresh data.
When you apply filters for a particular tile, the left corner of that tile changes to show a double filter icon, indicating that the data in that tile reflects its own filters.
Delete a tile
To remove a tile from a dashboard, do one of the following:
Select the context menu in the upper right corner of the tile, then select Remove from dashboard.
Select Edit to enter customization mode. Hover in the upper right corner of the tile, then select the
 delete icon to remove the tile from the dashboard.
Clone a dashboard
To use an existing dashboard as a template for a new dashboard, follow these steps:
Make sure that the dashboard view is showing the dashboard that you want to copy.
In the page header, select
 Clone.
A duplicate copy of the dashboard, named Clone of (your dashboard name), opens in edit mode. You can then rename and customize the new dashboard.
Publish and share a dashboard
When you create a dashboard, it's private by default, which means you're the only one who can see it. To make dashboards available to others, you can publish and share them. For more information, see Share Azure dashboards by using Azure role-based access control.
Open a shared dashboard
To find and open a shared dashboard, follow these steps.
Select the arrow next to the dashboard name.
Select from the displayed list of dashboards. If the dashboard you want to open isn't listed:
Select Browse all dashboards.
Select the Type equals filter, then select Shared dashboard.
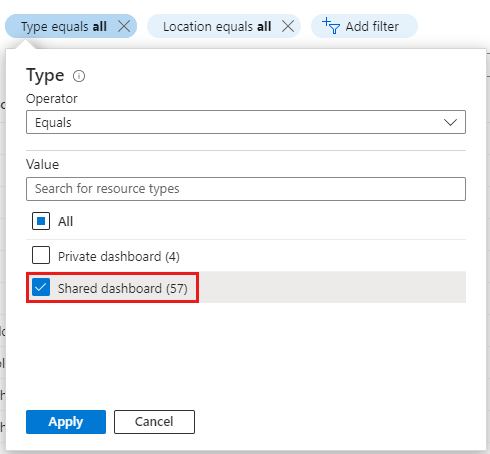
Select a dashboard from the list of shared dashboards. If you don't see the one you want, use the filters to limit the results shown, such as selecting a specific subscription or filtering by name.
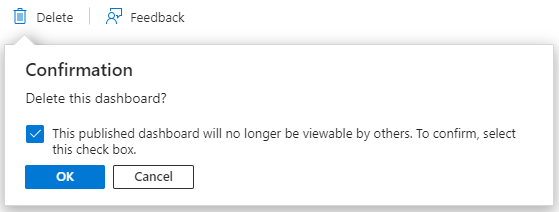
Delete a dashboard
You can delete your private dashboards, or a shared dashboard that you created or have permissions to modify.
To permanently delete a private or shared dashboard, follow these steps.
Select the dashboard you want to delete from the list next to the dashboard name.
Select
Delete from the page header.For a private dashboard, select OK on the confirmation dialog to remove the dashboard. For a shared dashboard, on the confirmation dialog, select the checkbox to confirm that the published dashboard will no longer be viewable by others. Then, select OK.