Monitor with RAN metrics in Azure portal
Once you have set up your radio access network (RAN) insights resource, you can view your RAN metrics. RAN metrics are platform metrics that are collected from the RAN Element Management System (EMS) offered by the RAN partner and stored by Azure Monitor Metrics.
These are a subset of metrics chosen from the RAN vendor’s EMS based on customer feedback, focusing on key KPIs crucial for monitoring and troubleshooting. The streamed metrics are stored and presented in a secure and compliant manner, in adherence to Microsoft’s security standards and policies. Users can use RAN metrics to save time managing systems and to correlate events more easily on the network.
Visualize RAN metrics using the Azure portal
RAN metrics are collected per site resource and aggregated across all access points connected. See Supported metrics with Azure Monitor for the RAN metrics available for retrieval included under microsoft.mobilenetwork/radioAccessNetworks.
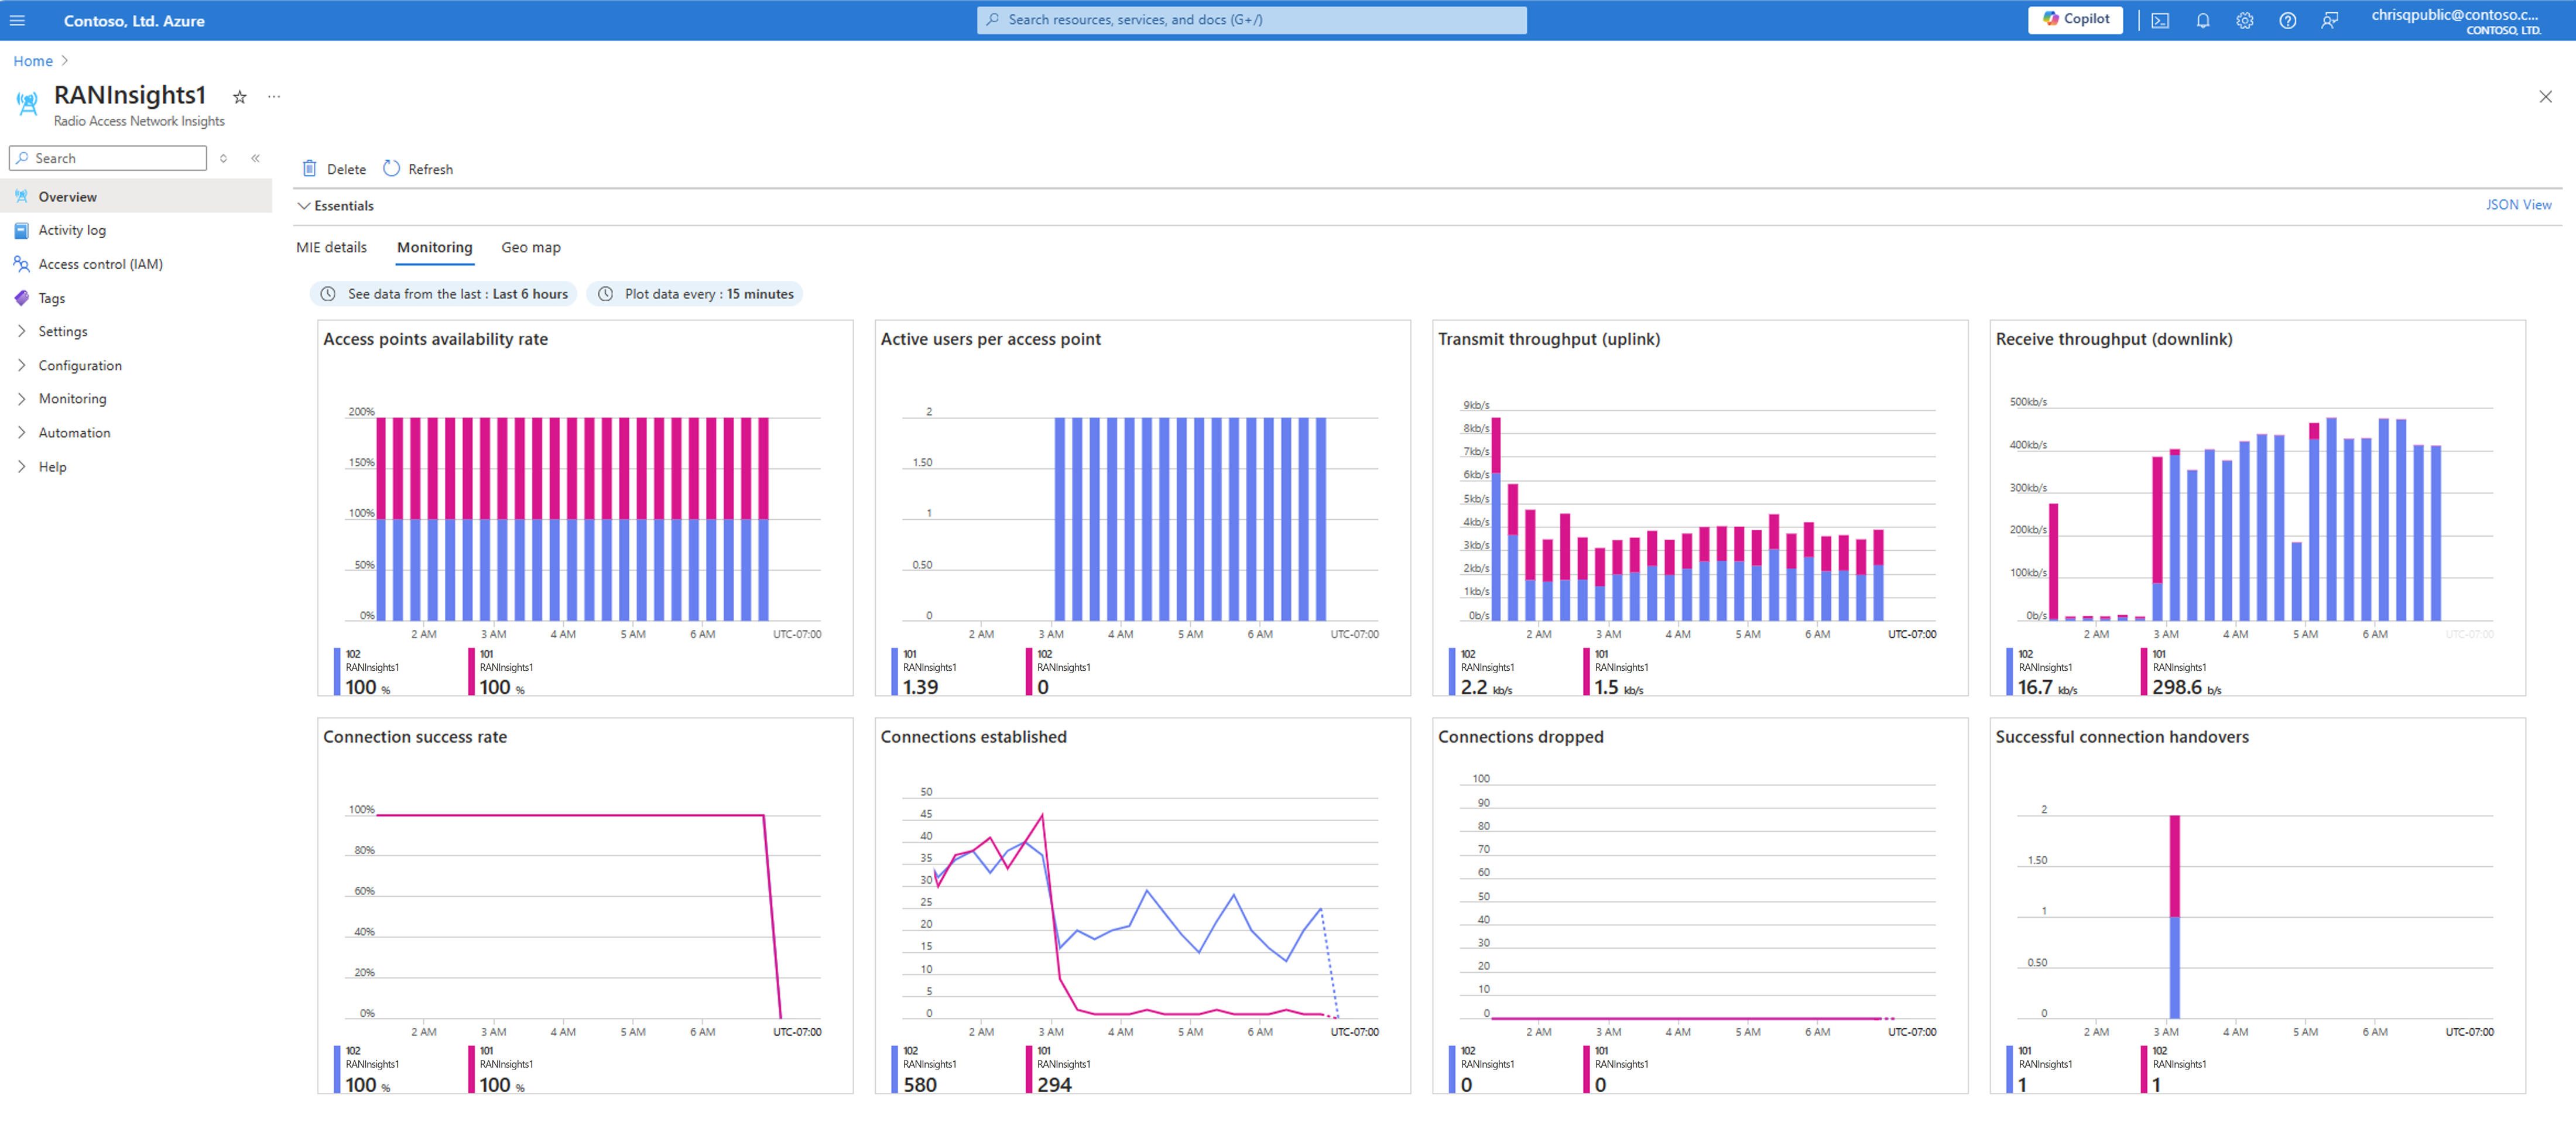
You can use the Azure portal to monitor your access points performance, reliability, and connection status. The RAN insights resource's Overview page under the Monitoring tab provides a prebuilt dashboard containing RAN metrics received.
To view more metrics on and create custom charts, select the Metrics tab under the RAN insights resource:
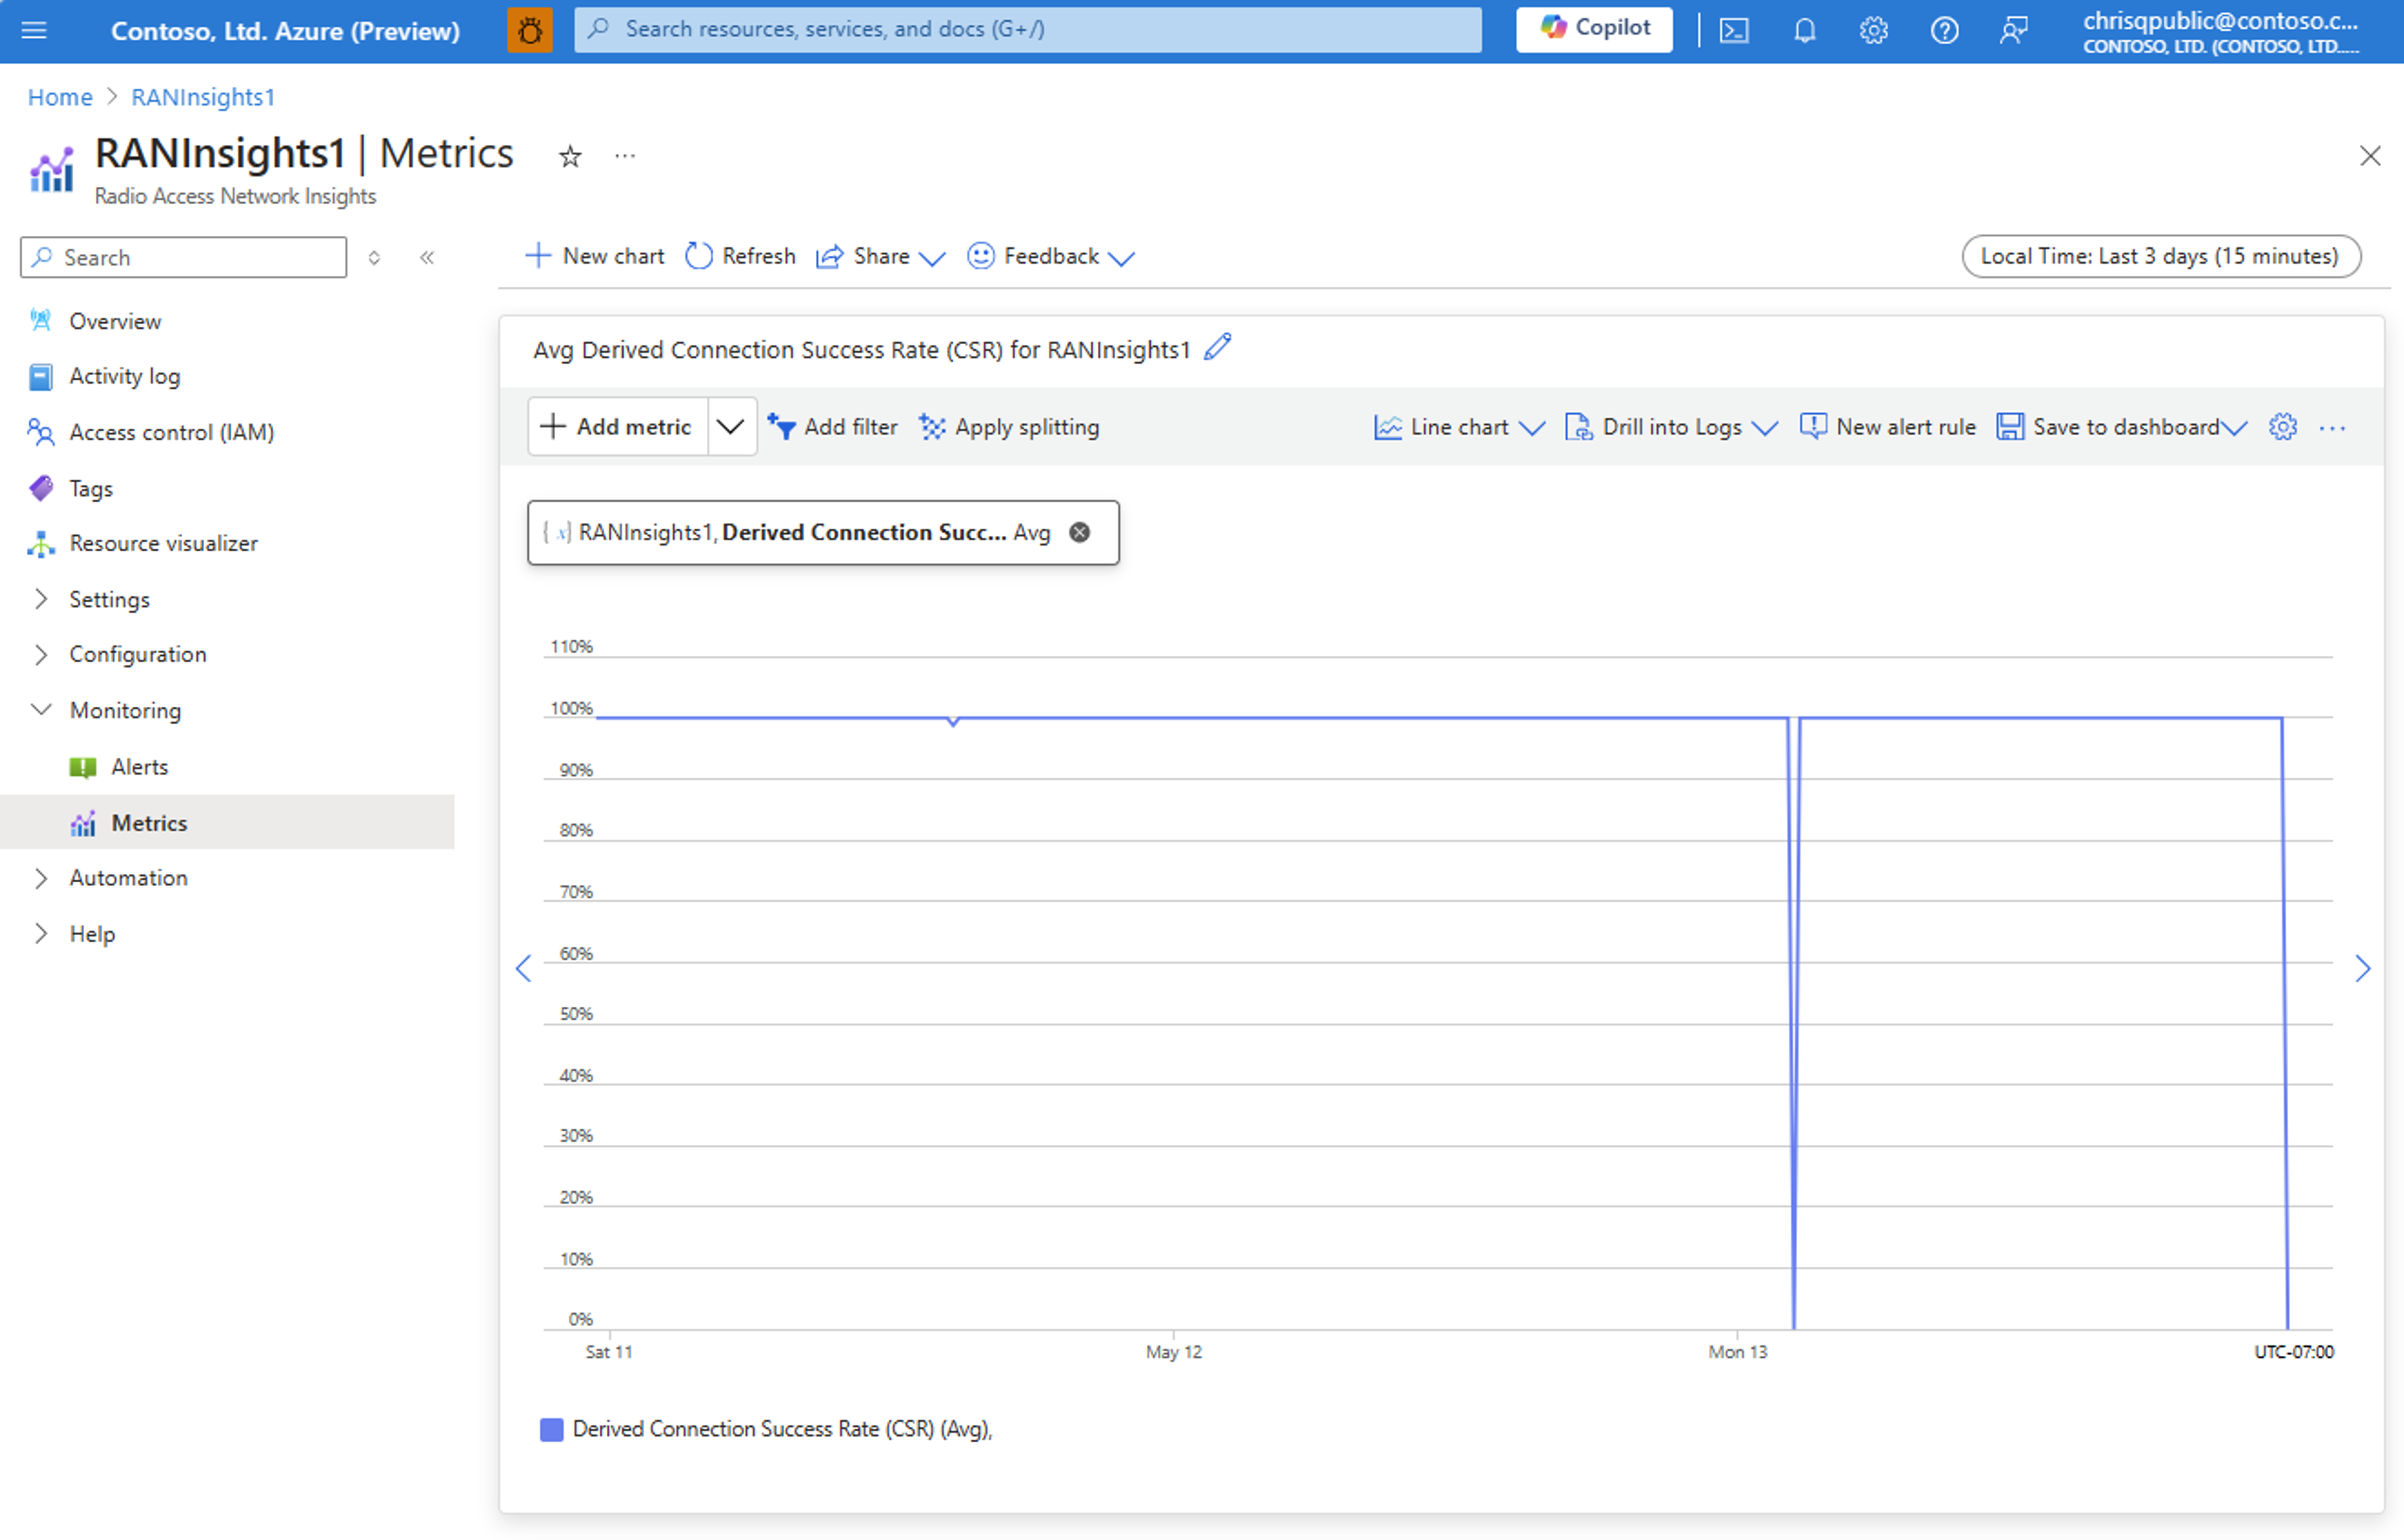
Using the buttons just above the charts, you can edit the timespan from which the data shown in the charts and the granularity of how that data is plotted.
Timespan options range from showing the previous hour of data to the previous 7 days of data and granularity options range from plotting every minute to plotting every 12 hours. For detailed information on interacting with the Azure Monitor graphics, see Get started with metrics explorer
Note that the EMS might provide metrics at intervals up to 15 minutes apart. For an optimal experience, adjust the plotting rate to match the value recommended by the EMS provider. For instance, if your RAN provider emits metrics every 5 minutes, it's advisable to set the Time granularity to 5 minutes accordingly.
You can also set alerts on each of your RAN metrics. By following Create Azure Monitor metric alert rules. RAN metrics are available for monitoring and retrieval for up to 30 days.
RAN metrics descriptions
The following table lists common RAN metrics. The RAN metrics available in your deployment are dependent on the RAN vendor.
We provide both direct metrics, which originate directly from the EMS, and derived metrics, which are calculated in Azure based on direct metrics.
| Direct Metric Name | Definition |
|---|---|
| Online Status | Used to define the online status of any access point (0 for offline and 1 for online). Note not all EMS systems provide this metric. If metric is not provided or if the access point is removed from the network, then will show as 0. |
| Active Users | Active user equipment on a given Access Point. This is the mean number of devices/ UEs in RRC connected mode during the sampling interval. |
| Connections Successfully Established | Number of established radio connections on an access point in the last sampling period. For example, in 5G, this reports the number of RRC Connection Setups Complete received by the gNodeB from the UEs. |
| Connection Attempts | Number of connection attempts on an access point in the last sampling period. |
| Abnormal Connection Terminations | Number of connections that have been abnormally terminated on a given access point during the last sampling interval. An abnormal termination occurs, for example, when the radio connection with the UE has been lost. |
| Initially Established Connections | Number of connections that were initially established with this access point during the last sampling period. In 5G, it counts the number of “Initial UE Context Setup Response” sent from the gNodeB-CU-CP to the AMF. |
| Connections Successfully Re-Established | Number of connections re-established on this access point since last downtime. |
| Re-Connection Attempts | Number of reconnection attempts per access point during the last sampling period. A reconnection attempt occurs, for example, when the UE has detected a failure of an already established connection (for example, radio link failure) and the UE triggers the procedure to recover from it. |
| Additionally Established Connections | Number of additional connections established in each access point during the last sampling interval. In 4G, this metric counts the number of E-RAB setup responses sent by the eNodeB to the UE. |
| Successful Connection Handovers | Number of successful connection handovers (of any type) per access point during the last sampling period. |
| Attempted Connection Handovers | Number of attempts made to handover connections per access point during the last sampling interval. |
| Downtime | Number of seconds that the access point was down during the sampling interval. The reasons for the access point being down include technical faults, network issues and admin action. Note not all EMS systems provide this metric. |
| Availability Rate | Percent of the time that the access point was available during the last sampling period. This metric is calculated using the downtime metric and sampling time. The health status for geo maps is also based on the availability rate metric. It indicates green if the metric is 100%, red if 0%, and orange if between 0-100%. |
| Transmit Volume | Volume of data transmitted by a given access point during the last sampling interval. In 5G, this is the N3 interface traffic. |
| Receive Volume | Volume of data received on a given access point during the last sampling interval. In 5G, this is the N3 interface traffic. |
| Active Transmit Time | Total time during the sample period when there was an active Transmit operation (actual time spent by the access point transmitting data). |
| Active Receive Time | Total duration within this period where there was an active receive operation, that is, the actual time spent by the access point receiving data. |
| Receive Data Rate | Rate of the received data (volume of traffic received by access point during a sampling interval divided by the duration of the interval). ReceiveDataRate will always be lower (or equal) than ReceiveThroughput. |
| Transmit Data Rate | Rate of the transmitted data (volume of traffic transmitted by access point during a sampling interval divided by the duration of the interval). TransmitDataRate will always be lower (or equal) than TransmitThroughput. |
| Derived Metric Name | Definition |
|---|---|
| Connection Success Rate (CSR) | Percentage of successful radio connections established on a given access point. |
| Mobility Success Rate (MSR) | Percentage of successful handovers across the radio on the given access point. |
| Transmit Throughput | Volume of data transmitted from a given access point divided by the active transmit time reported by the given access point. |
| Receive Throughput | Volume of data received on a given access point divided by the active receive time reported by that access point. |
Related content
Feedback
Coming soon: Throughout 2024 we will be phasing out GitHub Issues as the feedback mechanism for content and replacing it with a new feedback system. For more information see: https://aka.ms/ContentUserFeedback.
Submit and view feedback for