Structure Log Analytics queries
Administrators build Log Analytics queries from data stored in dedicated tables in a Log Analytics workspace. Some common dedicated tables include Event, Syslog, Heartbeat, and Alert. When you build a Kusto Query Language (KQL) query, you begin by determining which tables in the Azure Monitor Logs repository have the data you're looking for.
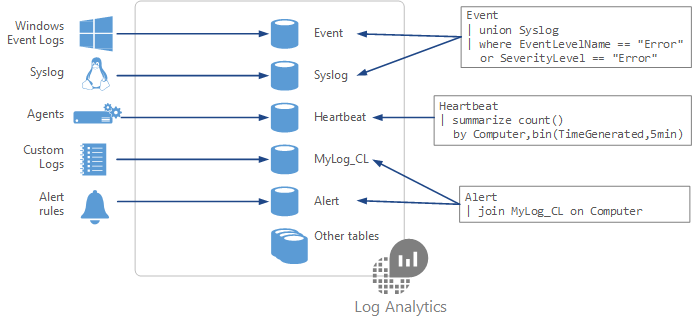
The following illustration highlights how KQL queries use the dedicated table data for your monitored services and resources.

Things to know about KQL query structure
Let's take a closer look at dedicated table data and how to structure a KQL log query.
Each of your selected data sources and solution stores its data in dedicated tables in your Log Analytics workspace.
Documentation for each data source and solution includes the name of the data type that it creates and a description of each of its properties.
The basic structure of a query is a source table followed by a series of commands (referred to as operators).
A query can have a chain of multiple operators to refine your data and perform advanced functions.
Each operator in a query chain begins with a pipe character
|.Many queries require data from a single table only, but other queries can use various options and include data from multiple tables.
KQL log query examples
Let's review some common KQL log query operators and example syntax.
We can build queries to search for data in the StormEvent table that has five entries:
| type | event | severity | start | duration | region |
|---|---|---|---|---|---|
Water |
Freezing rain |
1 |
6:00 AM 01-27-2023 |
3 hours |
1, 2 |
Wind |
High winds |
1 |
8:00 AM 01-27-2023 |
12 hours |
1, 2, 4, 5 |
Temperature |
Below freezing |
2 |
11:00 PM 01-26-2023 |
10 hours |
1, 2, 4, 5 |
Water |
Snow |
3 |
4:00 PM 01-26-2023 |
10 hours |
1, 2, 4, 5 |
Water |
Flood warning |
2 |
9:00 AM 01-26-2023 |
10 hours |
3 |
To find other operators and examples, review: Analyze monitoring data with Kusto Query Language - Training | Microsoft Learn.
Count number of items
Use the count operator to discover the number of records in an input record set.
The following example returns the number of records in the StormEvent table. The query results reveal the StormEvent table has five entries.
StormEvent | count
Query results:
| count |
|---|
5 |
Return first number of items
Use the top operator to see the first N records of your input record set, sorted by your specified columns. The columns correspond to data properties defined in the dedicated table.
The following example returns the first three data records for StormEvent. The results table shows the storm event name, the severity, and the forecasted duration.
StormEvent | top 3 by event severity duration
Query results:
| event | severity | duration |
|---|---|---|
Freezing rain |
1 |
3 hours |
High winds |
1 |
12 hours |
Below freezing |
2 |
10 hours |
Find matching items
Use the where operator to filter your table to the subset of rows that match the supplied predicate value. The predicate value indicates what to search for in the table, as in where=="find-this".
The following example filters the data records for StormEvent to use only records that match "snow."
StormEvent | where event=="snow"
Your query filters to one row in the StormEvent table:
| type | event | severity | start | duration | region |
|---|---|---|---|---|---|
Water |
Snow |
3 |
4:00 PM 01-26-2023 |
10 hours |
1, 2, 4, 5 |