Diagnostic settings in Azure Monitor
This article provides details on creating and configuring diagnostic settings to send Azure platform metrics, resource logs, and the activity log to different destinations.
Each Azure resource requires its own diagnostic setting, which defines the following criteria:
- Sources: The type of metric and log data to send to the destinations defined in the setting. The available types vary by resource type.
- Destinations: One or more destinations to send to.
A single diagnostic setting can define no more than one of each of the destinations. If you want to send data to more than one of a particular destination type (for example, two different Log Analytics workspaces), create multiple settings. Each resource can have up to five diagnostic settings.
Warning
If you need to delete a resource, rename, or move a resource, or migrate it across resource groups or subscriptions, first delete its diagnostic settings. Otherwise, if you recreate this resource, the diagnostic settings for the deleted resource could be included with the new resource, depending on the resource configuration for each resource. If the diagnostics settings are included with the new resource, this resumes the collection of resource logs as defined in the diagnostic setting and sends the applicable metric and log data to the previously configured destination.
Also, it's a good practice to delete the diagnostic settings for a resource you're going to delete and don't plan on using again to keep your environment clean.
The following video walks you through routing resource platform logs with diagnostic settings. The video was done at an earlier time. Be aware of the following changes:
- There are now four destinations. You can send platform metrics and logs to certain Azure Monitor partners.
- A new feature called category groups was introduced in November 2021.
Information on these newer features is included in this article.
Sources
There are three sources for diagnostic information:
- Platform metrics are sent automatically to Azure Monitor Metrics by default and without configuration. For more information on supported metrics, see Supported metrics with Azure Monitor
- Platform logs provide detailed diagnostic and auditing information for Azure resources and the Azure platform they depend on.
- Resource logs aren't collected until they're routed to a destination. For more information on supported logs, see Supported Resource log categories for Azure Monitor
- The Activity log provides information about resources from outside the resource, such as when the resource was created or deleted. Entries exist on their own but can be routed to other locations.
Metrics
The AllMetrics setting routes a resource's platform metrics to other destinations. This option might not be present for all resource providers.
Resource logs
With resource logs, you can select the log categories you want to route individually or choose a category group.
Category groups
Note
Category groups don't apply to all metric resource providers. If a provider doesn't have them available in the diagnostic settings in the Azure portal, then they also won't be available via Azure Resource Manager templates.
You can use category groups to dynamically collect resource logs based on predefined groupings instead of selecting individual log categories. Microsoft defines the groupings to help monitor specific use cases across all Azure services. Over time, the categories in the group might be updated as new logs are rolled out or as assessments change. When log categories are added or removed from a category group, your log collection is modified automatically without you having to update your diagnostic settings.
When you use category groups, you:
- No longer can individually select resource logs based on individual category types.
- No longer can apply retention settings to logs sent to Azure Storage.
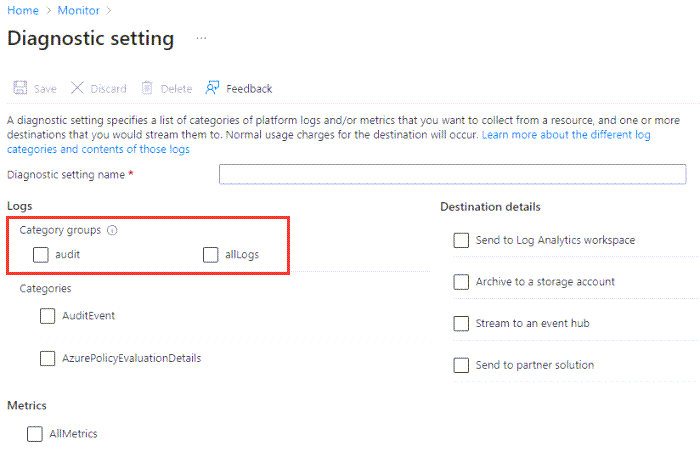
Currently, there are two category groups:
- All: Every resource log offered by the resource.
- Audit: All resource logs that record customer interactions with data or the settings of the service. Audit logs are an attempt by each resource provider to provide the most relevant audit data, but might not be considered sufficient from an auditing standards perspective depending on your use case. As mentioned above, what's collected is dynamic, and Microsoft may change it over time as new resource log categories become available.
The "Audit" category group is a subset of the "All" category group, but the Azure portal and REST API consider them separate settings. Selecting the "All" category group does collect all audit logs even if the "Audit" category group is also selected.
The following image shows the logs category groups on the Add diagnostics settings page.
Note
Enabling Audit for Azure SQL Database does not enable auditing for Azure SQL Database. To enable database auditing, you have to enable it from the auditing blade for Azure Database.
Activity log
See the Activity log settings section.
Destinations
Platform logs and metrics can be sent to the destinations listed in the following table.
To ensure the security of data in transit, all destination endpoints are configured to support TLS 1.2.
| Destination | Description |
|---|---|
| Log Analytics workspace | Metrics are converted to log form. This option might not be available for all resource types. Sending them to the Azure Monitor Logs store (which is searchable via Log Analytics) helps you to integrate them into queries, alerts, and visualizations with existing log data. |
| Azure Storage account | Archiving logs and metrics to a Storage account is useful for audit, static analysis, or back up. Compared to using Azure Monitor Logs or a Log Analytics workspace, Storage is less expensive, and logs can be kept there indefinitely. |
| Azure Event Hubs | When you send logs and metrics to Event Hubs, you can stream data to external systems such as third-party SIEMs and other Log Analytics solutions. |
| Azure Monitor partner solutions | Specialized integrations can be made between Azure Monitor and other non-Microsoft monitoring platforms. Integration is useful when you're already using one of the partners. |
Activity log settings
The activity log uses a diagnostic setting but has its own user interface because it applies to the whole subscription rather than individual resources. The destination information listed here still applies. For more information, see Azure activity log.
Requirements and limitations
This section discusses requirements and limitations.
Time before telemetry gets to destination
After you set up a diagnostic setting, data should start flowing to your selected destination(s) within 90 minutes. When sending logs to a Log Analytics workspace, the table is created automatically if it doesn't already exist. The table is only created when the first log records are received. If you get no information within 24 hours, then you might be experiencing one of the following issues:
- No logs are being generated.
- Something is wrong in the underlying routing mechanism.
If you're experiencing an issue, you can try disabling the configuration and then reenabling it. Contact Azure support through the Azure portal if you continue to have issues.
Metrics as a source
There are certain limitations with exporting metrics:
- Sending multi-dimensional metrics via diagnostic settings isn't currently supported. Metrics with dimensions are exported as flattened single-dimensional metrics, aggregated across dimension values. For example, the IOReadBytes metric on a blockchain can be explored and charted on a per-node level. However, when exported via diagnostic settings, the metric exported shows all read bytes for all nodes.
- Not all metrics are exportable with diagnostic settings. Because of internal limitations, not all metrics are exportable to Azure Monitor Logs or Log Analytics. For more information, see the Exportable column in the list of supported metrics.
To get around these limitations for specific metrics, you can manually extract them by using the Metrics REST API. Then you can import them into Azure Monitor Logs by using the Azure Monitor Data Collector API.
Destination limitations
Any destinations for the diagnostic setting must be created before you create the diagnostic settings. The destination doesn't have to be in the same subscription as the resource sending logs if the user who configures the setting has appropriate Azure role-based access control access to both subscriptions. By using Azure Lighthouse, it's also possible to have diagnostic settings sent to a workspace, storage account, or event hub in another Microsoft Entra tenant.
The following table provides unique requirements for each destination including any regional restrictions.
| Destination | Requirements |
|---|---|
| Log Analytics workspace | The workspace doesn't need to be in the same region as the resource being monitored. |
| Storage account | Don't use an existing storage account that has other, nonmonitoring data stored in it. Splitting the types of data up allow you better control access to the data. If you're archiving the activity log and resource logs together, you might choose to use the same storage account to keep all monitoring data in a central location. To prevent modification of the data, send it to immutable storage. Set the immutable policy for the storage account as described in Set and manage immutability policies for Azure Blob Storage. You must follow all steps in this linked article including enabling protected append blobs writes. The storage account needs to be in the same region as the resource being monitored if the resource is regional. Diagnostic settings can't access storage accounts when virtual networks are enabled. You must enable Allow trusted Microsoft services to bypass this firewall setting in storage accounts so that the Azure Monitor diagnostic settings service is granted access to your storage account. Azure DNS zone endpoints (preview) and Azure Premium LRS (locally redundant storage) storage accounts aren't supported as a log or metric destination. |
| Event Hubs | The shared access policy for the namespace defines the permissions that the streaming mechanism has. Streaming to Event Hubs requires Manage, Send, and Listen permissions. To update the diagnostic setting to include streaming, you must have the ListKey permission on that Event Hubs authorization rule. The event hub namespace needs to be in the same region as the resource being monitored if the resource is regional. Diagnostic settings can't access Event Hubs resources when virtual networks are enabled. You must enable Allow trusted Microsoft services to bypass this firewall setting in Event Hubs so that the Azure Monitor diagnostic settings service is granted access to your Event Hubs resources. |
| Partner solutions | The solutions vary by partner. Check the Azure Native ISV Services documentation for details. |
Diagnostic logs for Application Insights
If you want to store diagnostic logs for Application Insights in a Log Analytics workspace, don't send the logs to the same workspace that the Application Insights resource is based on. This configuration can cause duplicate telemetry to be displayed because Application Insights is already storing this data. Send your Application Insights logs to a different Log Analytics workspace.
When sending Application Insights logs to a different workspace, be aware that Application Insights accesses telemetry across Application Insight resources, including multiple Log Analytics workspaces. Restrict the Application Insights user's access to only the Log Analytics workspace linked with the Application Insights resource. Set the access control mode to Requires workspace permissions and manage permissions through Azure role-based access control to ensure that Application Insights only has access to the Log Analytics workspace that the Application Insights resource is based on.
Controlling costs
There's a cost for collecting data in a Log Analytics workspace, so only collect the categories you require for each service. The data volume for resource logs varies significantly between services.
You might also not want to collect platform metrics from Azure resources because this data is already being collected in Metrics. Only configure your diagnostic data to collect metrics if you need metric data in the workspace for more complex analysis with log queries. Diagnostic settings don't allow granular filtering of resource logs.
Tip
For strategies to reduce your Azure Monitor costs, see Cost optimization and Azure Monitor.