Monitor SSIS operations with Azure Monitor
Note
You can only monitor SSIS operation with Azure Monitor in Azure Data Factory, not in Azure Synapse Pipelines.
To lift & shift your SSIS workloads, you can provision SSIS IR in ADF that supports:
- Running packages deployed into SSIS catalog (SSISDB) hosted by Azure SQL Database server/Managed Instance (Project Deployment Model)
- Running packages deployed into file system, Azure Files, or SQL Server database (MSDB) hosted by Azure SQL Managed Instance (Package Deployment Model)
Once provisioned, you can check SSIS IR operational status using Azure PowerShell or on the Monitor hub of ADF portal. With Project Deployment Model, SSIS package execution logs are stored in SSISDB internal tables or views, so you can query, analyze, and visually present them using designated tools like SSMS. With Package Deployment Model, SSIS package execution logs can be stored in file system or Azure Files as CSV files that you still need to parse and process using other designated tools before you can query, analyze, and visually present them.
Now with Azure Monitor integration, you can query, analyze, and visually present all metrics and logs generated from SSIS IR operations and SSIS package executions on Azure portal. Additionally, you can also raise alerts on them.
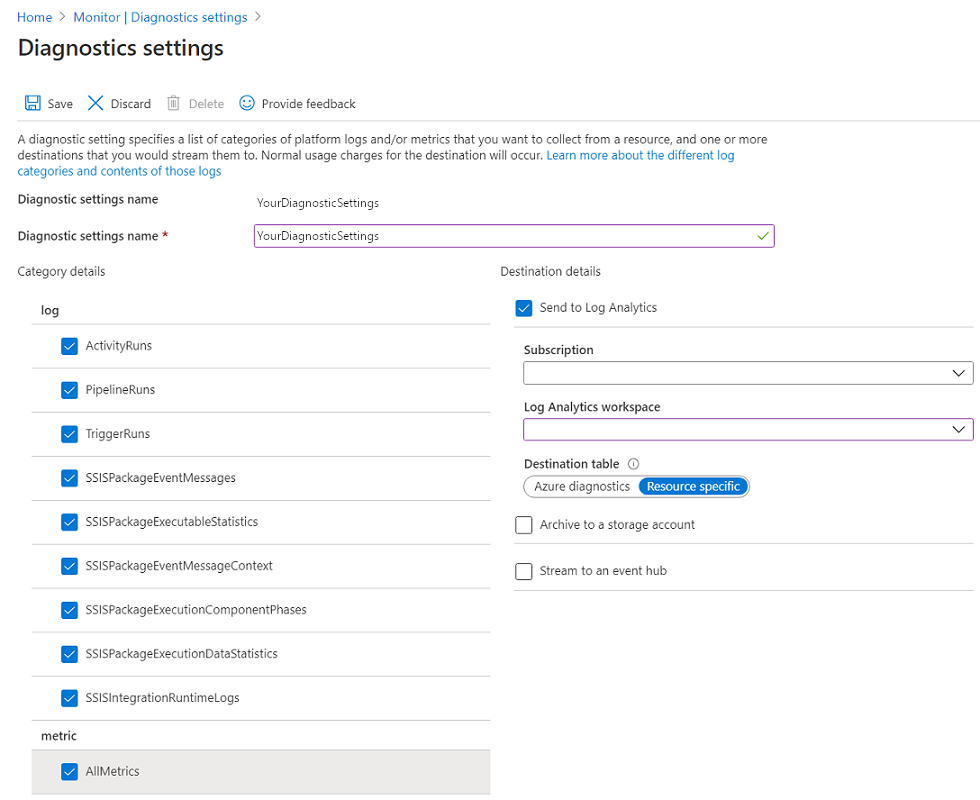
Configure diagnostic settings and workspace for SSIS operations
To send all metrics and logs generated from SSIS IR operations and SSIS package executions to Azure Monitor, you need to configure diagnostics settings and workspace for your ADF.
SSIS operational metrics
SSIS operational metrics are performance counters or numerical values that describe the status of SSIS IR start and stop operations, as well as SSIS package executions at a particular point in time. They're part of Azure Monitor metrics.
When you configure diagnostic settings and workspace for your ADF on Azure Monitor, selecting the AllMetrics check box will make SSIS operational metrics available for interactive analysis using Azure metrics explorer, presentation on Azure dashboard, and near-real time alerts.
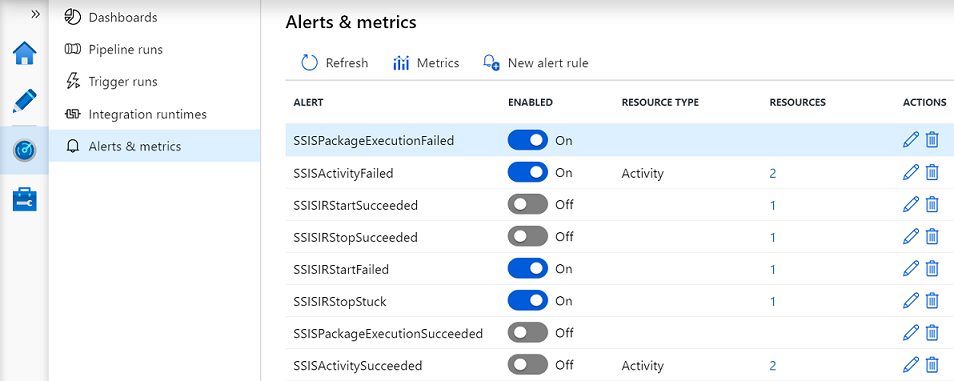
SSIS operational alerts
To raise alerts on SSIS operational metrics from ADF portal, select the Alerts & metrics page of ADF Monitor hub and follow the step-by-step instructions provided.
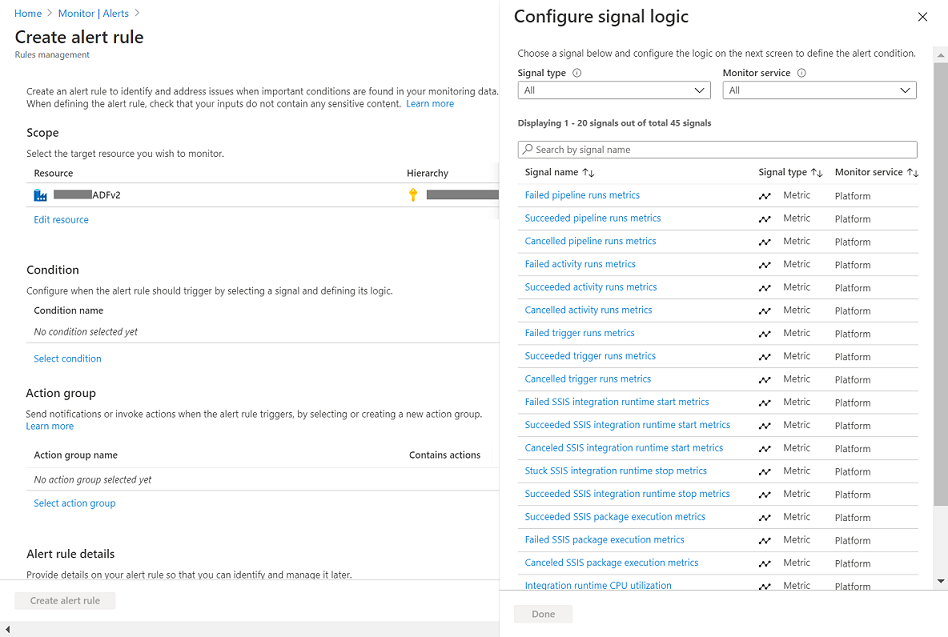
To raise alerts on SSIS operational metrics from Azure portal, select the Alerts page of Azure Monitor hub and follow the step-by-step instructions provided.
SSIS operational logs
SSIS operational logs are events generated by SSIS IR operations and SSIS package executions that provide enough context on any identified issues and are useful for root cause analysis.
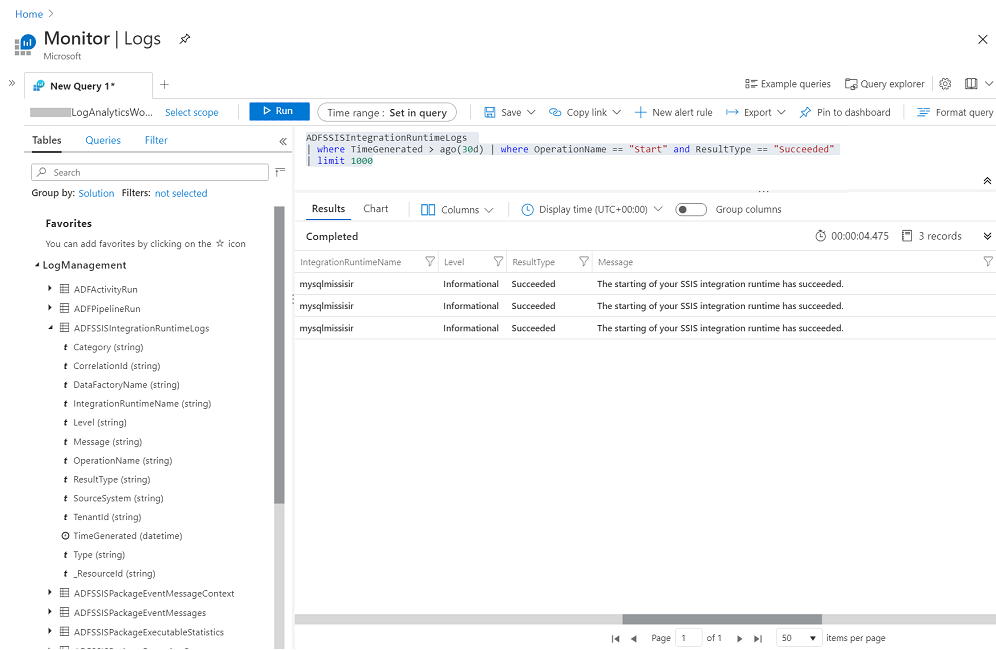
When you configure diagnostic settings and workspace for your ADF on Azure Monitor, you can select the relevant SSIS operational logs and send them to Log Analytics that's based on Azure Data Explorer. In there, they'll be made available for analysis using rich query language, presentation on Azure dashboard, and near-real time alerts.
The schemas and content of SSIS package execution logs in Azure Monitor and Log Analytics are similar to the schemas of SSISDB internal tables or views.
| Azure Monitor log categories | Log Analytics tables | SSISDB internal tables/views |
|---|---|---|
SSISIntegrationRuntimeLogs |
ADFSSISIntegrationRuntimeLogs |
|
SSISPackageEventMessageContext |
ADFSSISPackageEventMessageContext |
[internal].[event_message_context] |
SSISPackageEventMessages |
ADFSSISPackageEventMessages |
[internal].[event_messages] |
SSISPackageExecutableStatistics |
ADFSSISPackageExecutableStatistics |
[internal].[executable_statistics] |
SSISPackageExecutionComponentPhases |
ADFSSISPackageExecutionComponentPhases |
[internal].[execution_component_phases] |
SSISPackageExecutionDataStatistics |
ADFSSISPackageExecutionDataStatistics |
[internal].[execution_data_statistics] |
For more info on SSIS operational log attributes/properties, see Resource logs.
Your selected SSIS package execution logs are always sent to Log Analytics regardless of their invocation methods. For example, you can invoke package executions on Azure-enabled SSDT, via T-SQL on SSMS, SQL Server Agent, or other designated tools, and as triggered or debug runs of Execute SSIS Package activities in ADF pipelines.
When querying SSIS IR operation logs on Logs Analytics, you can use OperationName and ResultType properties that are set to Start/Stop/Maintenance/Heartbeat and Started/InProgress/Succeeded/Failed/Healthy/Unhealthy, respectively.
To query SSIS IR node status, you can set the OperationName property to Heartbeat. Each node normally sends one Heartbeat record per minute to Log Analytics with the ResultType property reflecting its status, which is Healthy when it's available for package executions and Unhealthy when it isn't. For example, if your SSIS IR has two available nodes, you'll always see two Heartbeat records with the ResultType property set to Healthy within any one-minute period.
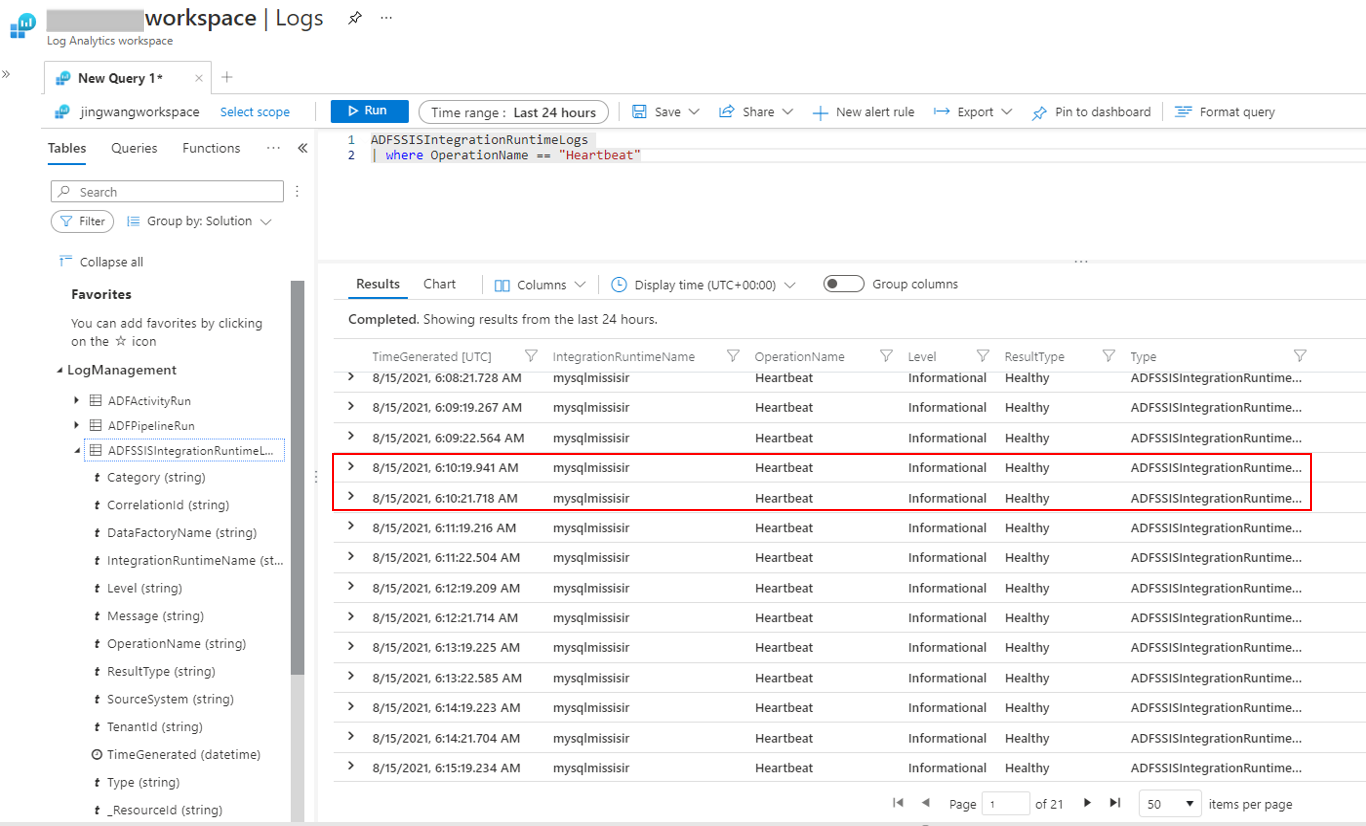
You can query the following patterns to detect the unavailability of your SSIS IR node(s):
- There are missing
Heartbeatrecords in many one-minute periods when your SSIS IR is still running. - There are
Heartbeatrecords with the ResultType property set toUnhealthyin many one-minute periods when your SSIS IR is still running.
You can turn the above queries into alerts and go to your SSIS IR monitoring page to confirm when you receive those alerts.
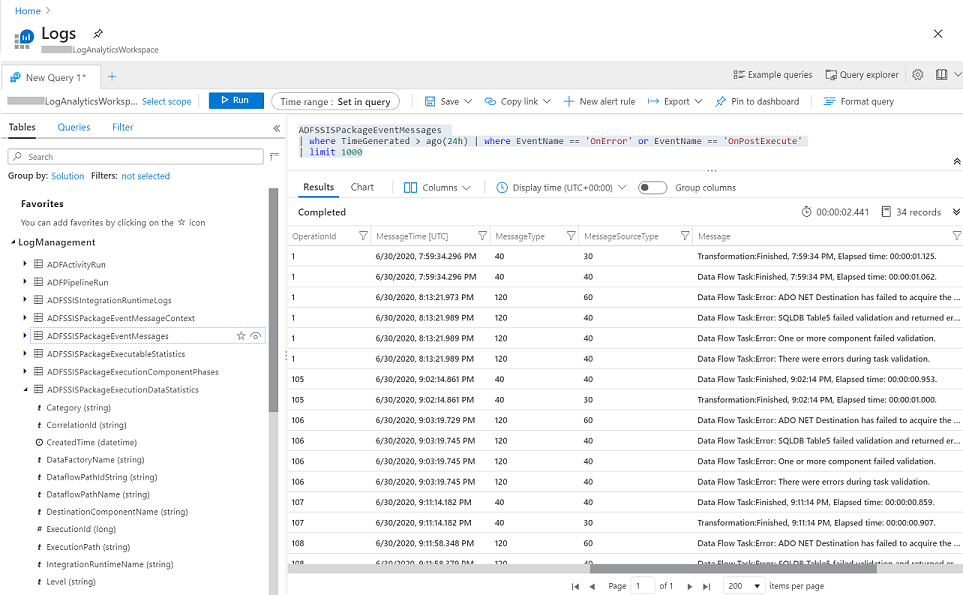
When querying SSIS package execution logs on Logs Analytics, you can join them using OperationId/ExecutionId/CorrelationId properties. OperationId/ExecutionId are always set to 1 for all operations/executions related to packages not stored in SSISDB/invoked via T-SQL.
Related content
Feedback
Coming soon: Throughout 2024 we will be phasing out GitHub Issues as the feedback mechanism for content and replacing it with a new feedback system. For more information see: https://aka.ms/ContentUserFeedback.
Submit and view feedback for