Dashboards in notebooks
This page describes how to create dashboards based on notebook cell outputs. Dashboards allow you to publish graphs and visualizations, and then share them in a presentation format with your organization.
Create or add to a dashboard
You create a dashboard by adding an item to it. There are two types of dashboards you can create from a notebook.
- Notebook dashboard: Notebook dashboards reformat your notebook into a presentation. You can share and schedule notebook dashboards as you would with any notebook.
- AI/BI dashboard: Databricks recommends AI/BI dashboards for creating and sharing dashboards across an organization. For more information about AI/BI dashboards, see Dashboards.
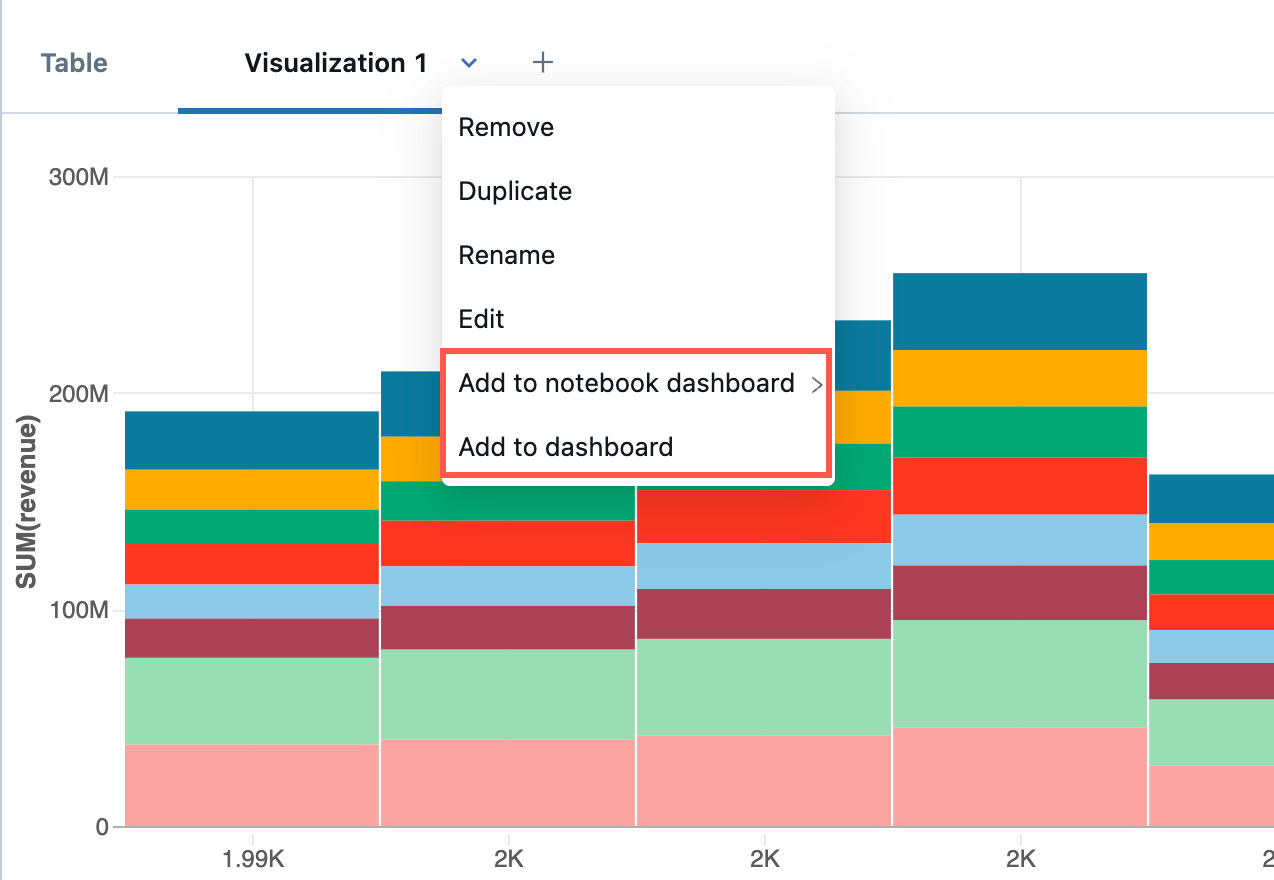
To add a visualization or output results table to a dashboard, click the down arrow next to the tab name. Then, choose the dashboard type you want to build.
Create or add to a notebook dashboard
To create a notebook dashboard, use the following steps:
- Select Add to notebook dashboard >.
- If you select Add to new notebook dashboard, the new dashboard is automatically displayed.
- To add the plot to an existing dashboard, click the name of the dashboard. A checkmark appears to indicate that the plot is now on that dashboard. The dashboard is not automatically displayed. To go to the dashboard, click
 to the right of the dashboard name.
Create or add to an AI/BI dashboard
To create an AI/BI dashboard, use the following steps:
- Select Add to dashboard.
- In the Add to dashboard dialog, select the Create a new dashboard or Add to existing dashboard radio button.
If you select Create new dashboard:
- An automatically generated dashboard title is provided in the Name field. Type a new name to rename the dashboard.
- Select the widgets you want to appear on the dashboard.
- Click Create.
If you select Add to existing dashboard:
- Use the drop-down menu in the Name field to select the dashboard for your visualization.
- Select the widgets that you want to include.
- Click Import.
You can configure and edit visualizations on your dashboard’s Canvas tab. You can access the queries associated with your visualizations in your dashboard’s Data tab. The remaining instruction in this article pertains to notebook dashboards. To learn how to manage and share your AI/BI dashboard, see Dashboards.
Control size and placement of items on a notebook dashboard
- To resize an item, click
 at the lower-right corner and move your cursor until the item is the size you want.
 - To move an item, click in the item and hold while you move your cursor.
- There are two layout options in the right panel, Stack and Float. Stack keeps the items neatly lined up on the dashboard. To move items around more freely, select Float.
- To add a name to a plot, move your cursor over the plot. A control panel
 appears in the upper-right corner.
- Select the Settings icon
 . The Configure Dashboard Element dialog appears.
 - In the dialog, click Show Title, enter a title for the plot, and click Save.
- Select the Settings icon
- To remove the item from the dashboard, move your cursor over the plot to display the control panel in the upper-right corner, and click
 .
.
Add a title to a notebook dashboard
In the box, enter the title. To change the title, enter the new title in the box.
Navigate between a notebook dashboard and a notebook
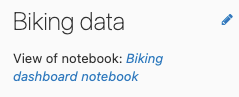
On the dashboard menu, click ![]() to the right of the dashboard name to go to the dashboard. To return to the notebook, click the notebook’s name underneath the title of the dashboard.
to the right of the dashboard name to go to the dashboard. To return to the notebook, click the notebook’s name underneath the title of the dashboard.
To go from a dashboard directly to the notebook cell that created a plot, move your cursor over the plot. A control panel appears in the upper-right corner of the cell. Click ![]() .
.
Present a notebook dashboard
To present a dashboard, click 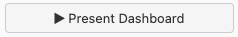 . To return to the interactive dashboard, click Exit in the upper-left corner.
Delete a notebook dashboard
To delete a dashboard, click 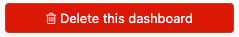 .
.
Create a scheduled job to refresh a notebook dashboard
To schedule a dashboard to refresh at a specified interval, click  to create a scheduled job for the notebook that generates the plots on the dashboard. For details about scheduled jobs, see Create and manage scheduled notebook jobs.