Get insights into catalog adoption from Microsoft Purview
As described in the insights concepts, the catalog adoption report is part of the "Health" section of the Data Estate Insights App. This report offers a one-stop shop experience for administrators to determine if and how the Microsoft Purview Data Catalog is being used. It helps answer questions like:
- What are my users searching for?
- How many people used the data catalog last month?
- What are the most used data assets?
Prerequisites
Before getting started with Microsoft Purview Data Estate Insights, make sure that you've completed the following steps:
- Set up a storage resource and populated the account with data.
- Set up and completed a scan your storage source. For more information to create and complete a scan, see the manage data sources in Microsoft Purview article.
- Permissions depending on your current experience:
- If using the classic Microsoft Purview Catalog, you need the data curator role or insight reader role.
- If using the new Microsoft Purview data catalog, you need data health reader permissions.
Understand your data estate and catalog health in Data Estate Insights
In Microsoft Purview Data Estate Insights, you can get an overview of all assets inventoried in the Data Map, and any key gaps that can be closed by governance stakeholders, for better governance of the data estate.
Open the Microsoft Purview portal.
If you're using the classic Microsoft Purview portal, select the Data estate insights
 menu item. If you're using the new Microsoft Purview portal open the Data catalog, select the Data estate insights drop down, and then select Reports.
Select Catalog Adoption.
View catalog adoption dashboard
The catalog adoption dashboard has several curated tiles and charts to identify:
- How many active users your data catalog had in the last month
- How many total searches were performed in the last month
- Which data catalog features are being used
- Most viewed assets
- Top searched keywords in your data catalog

Monthly active users
The monthly active users tile provides a count of users who have taken at least one action in the Microsoft Purview Data Catalog in the last 30 days. An action in the data catalog includes: searching for a term, browsing in the data catalog, and updating an asset in the data catalog.
This tile also includes an indicator of a percentage increase or decrease in users from the previous month.
Total searches
The total searches tile provides a count of all searches performed in the Microsoft Purview Data Catalog over the last 30 days. At the bottom it also includes an indicator of a percentage increase or decrease in the number of searches from the previous month.
Active users by feature category
The active users by feature category chart allows you to monitory user activity trends in your data catalog.
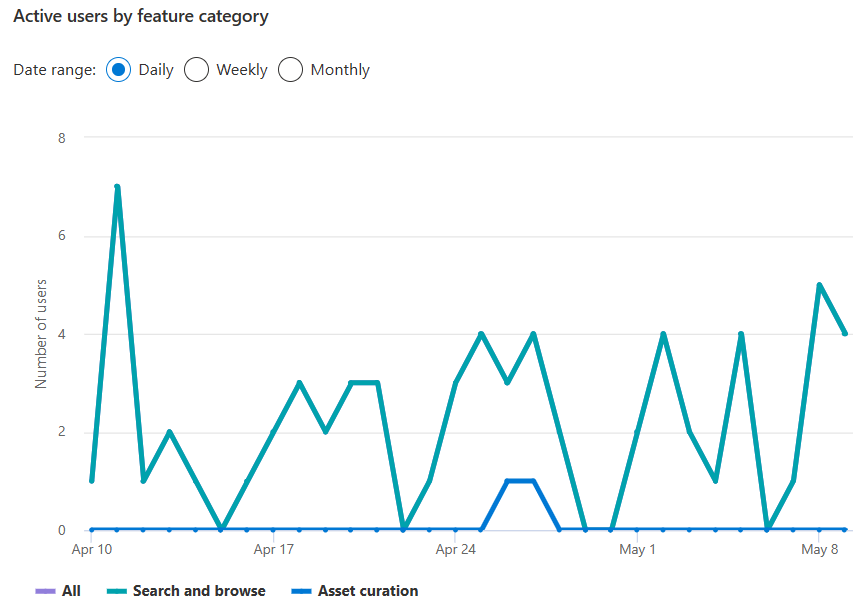
At the top of the chart, you can select your date range to view user activity on a daily, weekly, or monthly basis.
The table then shows the number of users in the date range performing one of these three categories of actions:
- Search and browse - the count of users who performed any search or browse action in the Microsoft Purview Data Catalog
- Asset curation - the count of users who performed at least any one of these actions on an asset:
- Added, removed, or updated a rating
- Added or removed a tag
- Added or removed a glossary term
- Added or removed a classification
- Edited an asset's name or description
- Added or removed a certification
- Added or removed a column level classification, glossary term, description, name, or data type
- Added or removed manual lineage
- Added or removed a contact
- All - the count of users who both performed search and browse and asset curation actions within the date range
Most viewed assets
The most viewed assets table shows the top assets in your data catalog, by sum of views in the last 30 days.
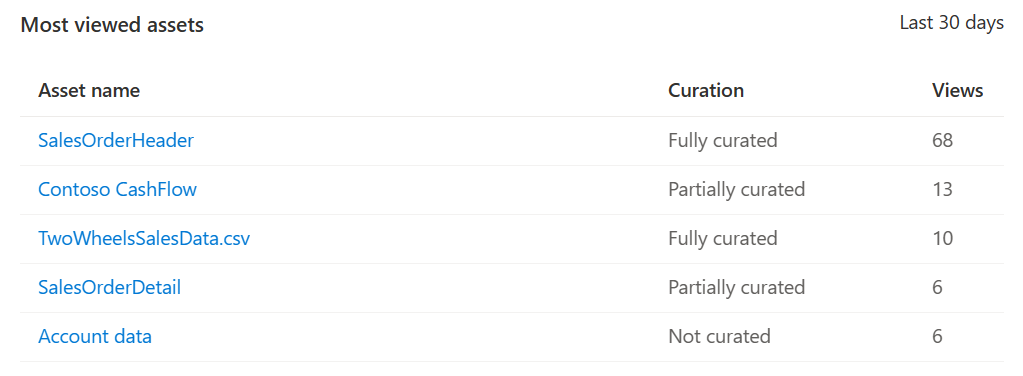
This table allows you to select through to your most viewed assets for more information, but the table also provides these other details:
- Curation status - There are three possible statuses: "Fully curated", "Partially curated" and "Not curated", based on certain attributes of assets being present. An asset is "Fully curated" if it has at least one classification tag, an assigned Data Owner and a description. If any of these attributes is missing, but not all, then the asset is categorized as "Partially curated" and if all of them are missing, then it's "Not curated". For more information about the curation status of your data assets, see the data stewardship dashboard.
- Views - count of the number of views the asset received in the last 30 days.
Top searched keywords
The top searched keywords table shows your top keywords both for searches that produced results, and searches that didn't. That way you can know what users are finding with the data catalog, and what they're still looking for.
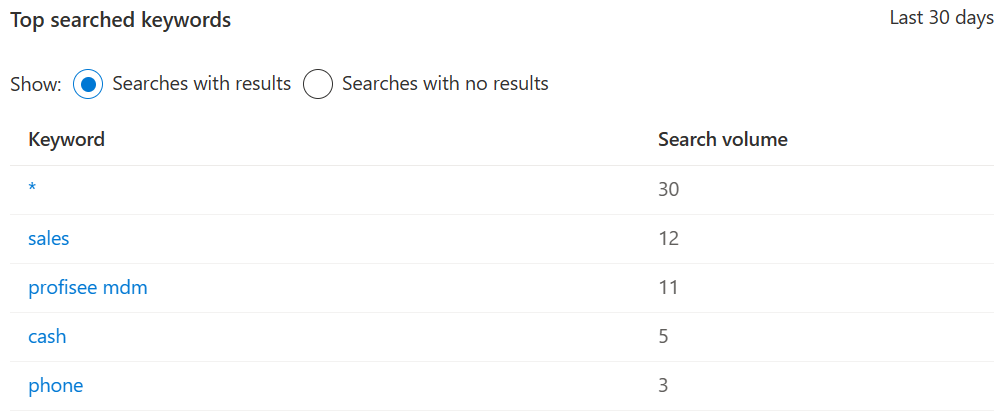
At the top of the table, you can select one of the two radio buttons to select whether to show keywords for searches with results, or searches without results.
You can select any of the keywords to run the search in the data catalog and see the results for yourself as well.
The table also provides search volume, which is the number of times that keyword was searched in the last 30 days.
Next steps
Learn more about Microsoft Purview Data Estate Insights through:
Feedback
Coming soon: Throughout 2024 we will be phasing out GitHub Issues as the feedback mechanism for content and replacing it with a new feedback system. For more information see: https://aka.ms/ContentUserFeedback.
Submit and view feedback for