Power BI Report Builder
APPLIES TO: ![]() Power BI Report Builder
Power BI Report Builder ![]() Power BI Desktop
Power BI Desktop
Power BI Report Builder is a tool for authoring paginated reports that you can publish to the Power BI service. Paginated reports are designed to be printed or shared. They're formatted to fit well on a page, and they display all the data in a table, even if the table spans multiple pages. When you design a paginated report, you're creating a report definition that specifies what data to retrieve, where to get it, and how to display it. When you run the report, the report processor takes the report definition you have specified, retrieves the data, and combines it with the report layout to generate the report. You preview your report in Report Builder. Then publish your report to the Power BI service. See What are paginated reports in Power BI? for more background.
Ready to start authoring? Install Power BI Report Builder from the Microsoft Download Center.
Prefer learning from videos? Check out the Video-based course: Power BI Paginated Reports in a Day.
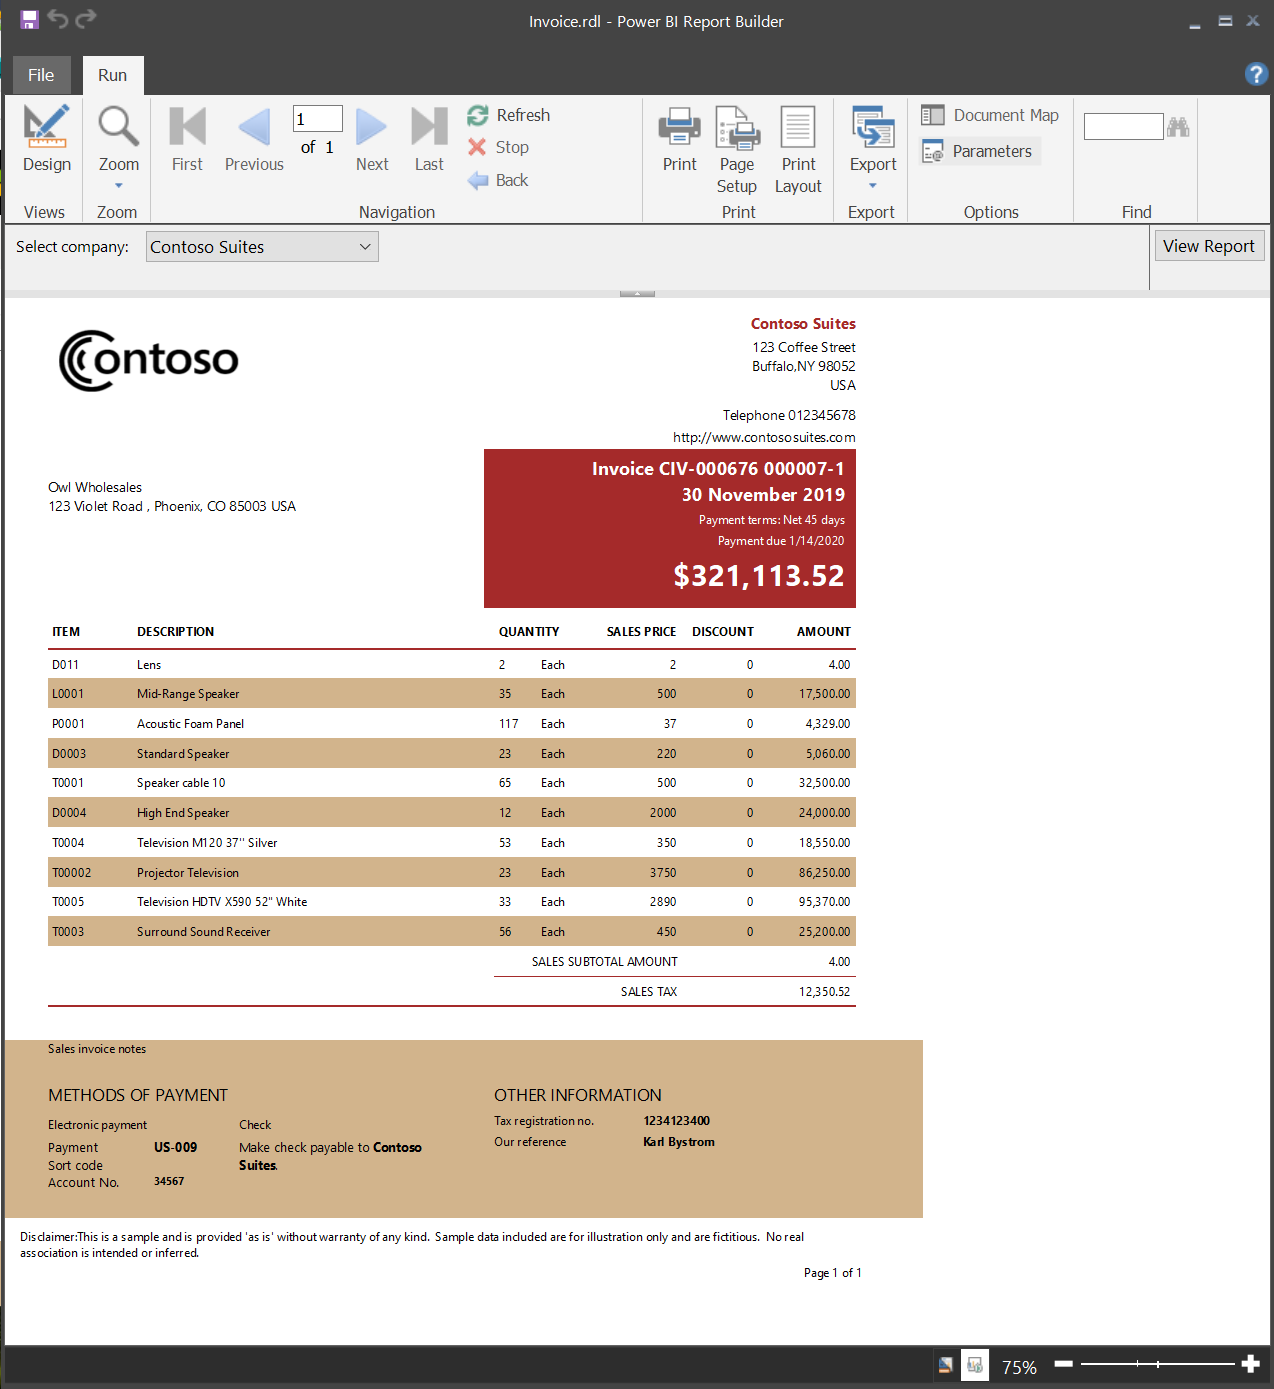
The following paginated report is a sample of an invoice. You can download it and other samples, such as letters, transcripts, and labels. Read more about sample Power BI paginated reports.
System requirements
See the System requirements section of the Power BI Report Builder download page on the Microsoft Download Center.
Prerequisites
License requirements for Power BI paginated reports (.rdl files) are the same as for Power BI reports (.pbix files).
- You don't need a license to download Power BI Report Builder from the Microsoft Download Center for free.
- With a free license, you can publish paginated reports to My Workspace in the Power BI service. For more information, see Feature availability for users with free licenses in the Power BI service.
- With a Power BI Pro license or a PPU license, you can publish paginated reports to other workspaces. You also need at least a contributor role in the workspace.
- You need Build permission for the dataset.
Start with the Table, Matrix, or Chart wizard
Create a data source connection, drag and drop fields to create a dataset query, select a layout and style, add accessibility row properties, and customize your report.
Start with the Map wizard
Create reports that display aggregated data against a geographic or geometric background. Map data can be spatial data from a Transact-SQL query or an Environmental Systems Research Institute, Inc. (ESRI) shapefile. You can also add a Microsoft Bing map tile background.
Design your report
Create paginated reports with table, matrix, chart, and free-form report layouts. Create table reports for column-based data, matrix reports (like cross-tab or PivotTable reports) for summarized data, chart reports for graphical data, and free-form reports for anything else. Reports can embed other reports and charts, together with lists, graphics, and controls for dynamic Web-based applications.
Report from a variety of data sources. You can create reports that use relational and multidimensional data from SQL Server and Analysis Services, Oracle, Power BI semantic models, and other databases.
Modify existing reports. By using Report Builder, you can customize and update reports that were created in SQL Server Data Tools (SSDT) Report Designer.
Modify your data. Filter, group, and sort data, or add formulas or expressions.
Add charts, gauges, sparklines, and indicators. Summarize data in a visual format, and present large volumes of aggregated information at a glance.
Add interactive features such as document maps, show/hide buttons, and drillthrough links to subreports and drillthrough reports. Use parameters and filters to filter data for customized views.
Embed or reference images and other resources, including external content.
Manage your report
Save the definition of the report to your computer or to the report server, where you can manage it and share it with others.
Choose a presentation format when you open the report, or after you open the report. You can select Web-oriented, page-oriented, and desktop application formats. Formats include MHTML, PDF, XML, CSV, Word, and Excel.
Set up subscriptions. After you publish the report to the Power BI service, you can configure your report to run at a specific time and send as an e-mail subscription.
Use deployment pipelines with paginated reports
In the Power BI service, you can use the deployment pipeline tool with paginated reports. Deployment pipelines let you develop and test your Power BI paginated reports before you release them to your users. The tool is a pipeline with three stages:
- Development
- Test
- Production
Read about how to get started with deployment pipelines in the Power BI service.
Considerations and limitations
You might not be able to configure Parameters as both "Multi-value" and "Allow null". "Multi value" and "Allow blank" is an allowed combination but Null is treated differently.
Power BI Report Builder in a virtualized environment
Power BI Report Builder is fully supported on Azure Virtual Desktop (formerly Windows Virtual Desktop) and Windows 365.
Running Power BI Report Builder as a virtualized application (for example, as a Citrix application) isn't supported.