Custom reporting and database schema reference for Office Telemetry Dashboard
Applies to: Office 2019, Office 2016
Important
- Office Telemetry Dashboard is no longer supported in Microsoft 365 Apps for enterprise (as of Version 2208), and is removed in Version 2301 (and later).
- For more information, see Removal of Office Telemetry Dashboard from Microsoft 365 Apps for enterprise.
The built-in worksheets in Office Telemetry Dashboard display lots of useful data, but sometimes you want more control over how the data is displayed. To do this, you can use the custom reporting feature in Office Telemetry Dashboard. This feature uses PivotTable reports to help give you a deeper view into how Office is being used in your organization. In this article, you can learn how to create custom reports, and you can find information about the database tables and fields that are used in custom reports.
Important
- Office Telemetry Dashboard is an on-premises tool that collects inventory, usage, and health data about the Office documents and solutions, such as add-ins, used in your organization. The data is primarily designed to help your organization with application compatibility testing.
- Data collected for Office Telemetry Dashboard is stored in a SQL Server database controlled by your organization and the data collected is not sent to Microsoft. For more information, see Data collected by the agent for Office Telemetry Dashboard.
- Data collected for Office Telemetry Dashboard is different than Office diagnostic data, which can be sent to Microsoft. For more information about Office diagnostic data, see Overview of privacy controls for Microsoft 365 Apps.
- Settings used to manage Office Telemetry Dashboard have no impact on Office diagnostic data and vice versa. For more information about managing Office diagnostic data, see Use policy settings to manage privacy controls for Microsoft 365 Apps.
Overview of custom reports in Office Telemetry Dashboard
The built-in worksheets in Office Telemetry Dashboard show you a relevant subset of the data that is collected by the agents. However, the built-in worksheets aren't customizable, and you might want to see a combined view of data that appears on different worksheets. This is where custom reporting can help you use PivotTable reports to view data in meaningful ways.
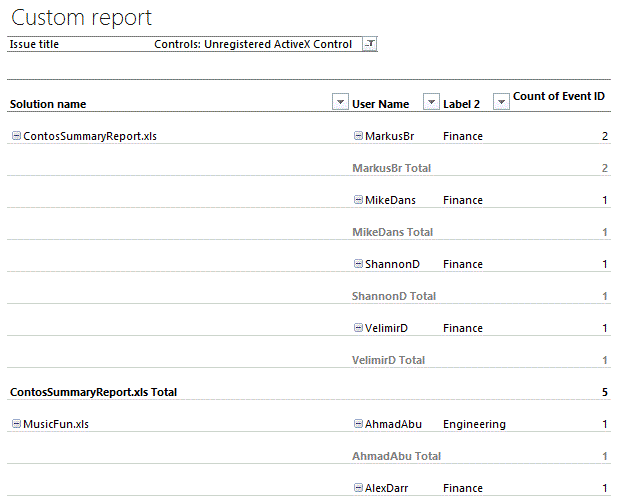
For example, the following screenshot shows a custom report that lists the unregistered ActiveX controls that are detected on monitored clients. You can see that we've added fields to display the solution name, user name, and business group (as configured for Label 2 when the agents were deployed). This report helps us identify the solutions that use unregistered ActiveX controls and who is using them. In contrast, the Documents worksheet lists these solutions but doesn't have a column to indicate whether unregistered ActiveX controls are detected. You have to view the Document sessions worksheet for each document to see whether ActiveX controls are being used.
Custom report that shows unregistered ActiveX solutions
Important
To use labels in custom reports, you have to configure them when you deploy the agents. If you haven't already done this, we recommend that you carefully plan labels that support the types of custom reporting that you'll do. For example, setting labels to identify business groups, locations, and job roles can help you find trends and issues for specific groups or types of users. Enabling and configuring the agent will help you configure labels (known as tags in the Group Policy settings and registry settings for the agent).
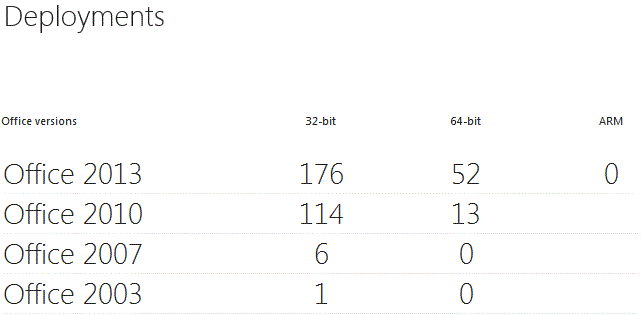
As another example, the following screenshot shows the list of Office client computers as displayed in the Deployments worksheet. This shows a high-level summary of Office deployments. But it doesn't give you a breakdown of how Office is deployed across business groups.
The Deployments worksheet
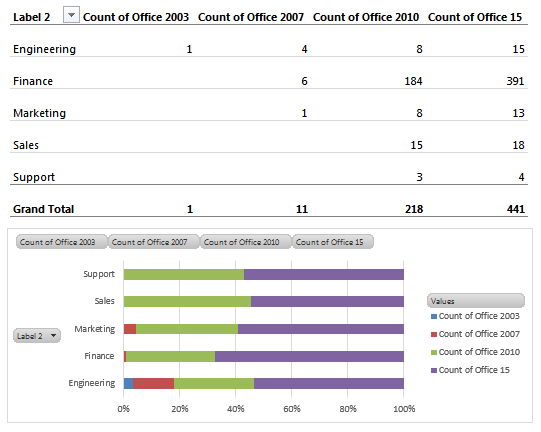
You can get a more detailed view of Office clients by using a custom report. In the following illustration, the Office clients are grouped by business groups (as configured for Label 2) so that you can see the breakdown of Office deployments across each group. You can also create a PivotChart to help show the data. This custom report uses a hidden table, System_details, that you have to manually add before you can add Office versions to your report. You can learn how to do this in Hidden tables in Office Telemetry Dashboard custom reports.
Custom report showing Office deployments by business group
Create custom reports in Office Telemetry Dashboard
You can create a single custom report on the Custom report worksheet. This automatically loads the default tables and creates a basic custom report that you can use as a starting point. Then, you can add and remove fields to design a report that meets your business needs. For performance reasons, not all tables are loaded automatically when you create a custom report. You can add tables by using the procedure in Hidden tables in Office Telemetry Dashboard custom reports. The most common reason to add hidden tables is to gain access to Office builds, which are available in the System_details table.
In this video demo, you can see custom reporting in action. We compare data that is shown in the Solutions worksheet to similar data that is shown in a custom report. This video will also help you learn how to add and move fields in a PivotTable report.
Custom reporting in Office Telemetry Dashboard
Although this video is for an earlier version of Office, the information also applies to newer versions of Office.
If you use large data sets in your custom reports, you might encounter the 2-GB memory limitation when you use the 32-bit version of Excel. There are a couple ways that you can work around this limitation:
Use the 64-bit version of Excel, which doesn't have the 2-GB memory limitation, but does have other drawbacks. See Choose between the 64-bit or 32-bit version of Office to learn more.
Change the reporting threshold in the database to control the amount of data pulled into PowerPivot for custom reports. Learn more about this setting in How to configure privacy and performance settings in Office Telemetry Dashboard.
To create a custom report, you have to first start Office Telemetry Dashboard. The following table describes how to start the dashboard in different versions of Windows.
To start Office Telemetry Dashboard
| If you have this operating system | Follow these steps to start Office Telemetry Dashboard |
|---|---|
| Windows 10, Windows 7, or Windows Server 2008 R2 | From the Start menu, choose All Programs, then Microsoft Office 2016 Tools, then Telemetry Dashboard for Office 2016. |
| Windows 8.1 | On the Start screen, type Telemetry Dashboard, and then choose it from the search results. |
| Windows Server 2012 or Windows Server 2012 R2 | Swipe in from the right edge to show the charm bar, and then choose Search to see all the apps that are installed on the computer. Next, choose Telemetry Dashboard for Office 2016. |
For Office 2019, look for Telemetry Dashboard for Office under Microsoft Office Tools.
Note
- Support for Windows 7 and Windows Server 2008 R2 ended on January 14, 2020.
- Support for Windows 8.1 ended on January 10, 2023.
To create a custom report
In Office Telemetry Dashboard, on the Getting Started worksheet, choose Connect to Database.
In the Data connection settings dialog box, type the names of the computer running SQL Server and the SQL database that you specified when you installed Office Telemetry Processor.
In the navigation pane, choose Custom report.
On the Custom report worksheet, choose Create custom report.
To help you get started, the following tables provide procedures for creating different kinds of custom reports.
Sample custom reports in Office Telemetry Dashboard
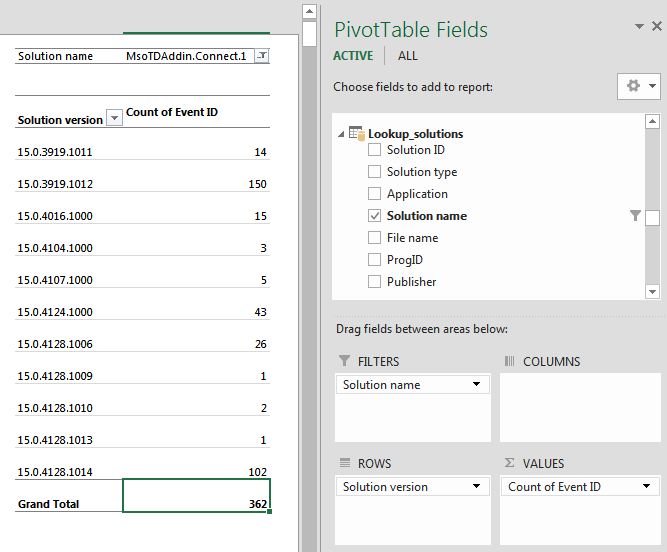
To create a custom report that shows solution stability, do the following:
- From the Lookup_solutions table, drag Solution name to the FILTERS well.
- After the Solution name field is added to the custom report, use the filter button (next to the Solution name) to choose the solution.
- From the Inventory table, drag Solution version to the ROWS well.
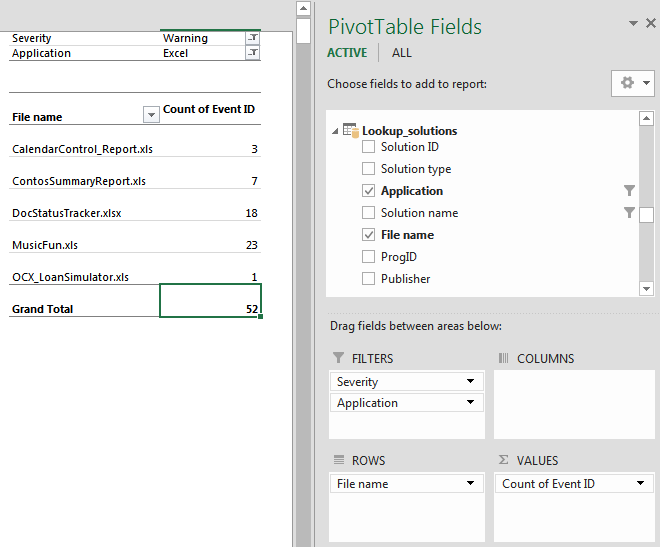
To create a custom report that shows Excel warnings, do the following:
- From the Lookup_issue_definitions table, drag Severity to the FILTERS well.
- After the Severity field is added to the custom report, use the filter button (next to Severity) to choose Warning.
- From the Lookup_solutions table, drag Application to the FILTERS well, and then adjust the filter to select Excel.
- From the Lookup_solutions table, drag File name to the ROWS well.
Default tables and fields in Office Telemetry Dashboard custom reports
The following tables describe the six tables and their related fields that are shown by default in the PivotTable Fields list when you create custom reports.
Default tables
| Table name | Description |
|---|---|
| Events | Contains issue events for the past three months. |
| Inventory | Contains unique instance data, such as load time and solution version, about the Office documents and solutions that are monitored. |
| Lookup_computers | Contains information about the computers that are monitored. This includes computer name, domain, hardware information, and Windows version. |
| Lookup_issue_definitions | Contains information about the issues that were detected, such as issue type, issue title, severity, and explanation. |
| Lookup_solutions | Contains information about solutions that were detected, such as solution type, name, and publisher. |
| Lookup_users | Contains information about the users who use monitored client computers, such as their user name, domain, and label settings. |
The following table lists the fields in the Events table.
Fields in the Events table
| Field name | Type | Description |
|---|---|---|
| Event ID | Number | The primary key for this table. |
| Issue ID | Number | Connects to the Lookup_issue_definitions table. You can view these definitions in the following articles: - Compatibility issues in Office - Troubleshooting Office files and custom solutions with the telemetry log (see Table 2) |
| Inventory ID | String | Connects to the Inventory table. |
| Solution ID | Number | Connects to the Lookup_solutions table. |
| User ID | Number | Connects to the Lookup_users table. |
| Computer ID | Number | Connects to the Lookup_computers table. |
| Event date | Date/time | Shows the date and time of the event. |
| Application version (detail) | String | Shows the version of the Office application that triggered the event. |
The following table lists the fields in the Inventory table.
Fields in the Inventory table
| Field name | Type | Description |
|---|---|---|
| Inventory ID | Strings | The primary key for this table. |
| Solution ID | Numbers | Connects to the Lookup_solutions table. |
| User ID | Numbers | Connects to the Lookup_users table. |
| Computer ID | Numbers | Connects to the Lookup_computers table. |
| Friendly name | Strings | Shows the friendly name of the solution. |
| Location | Strings | Shows the file location of the file. |
| Load time (seconds) | Numbers | Shows the load time of the solution in seconds. |
| Title | Strings | Shows the title of the document. |
| Author | Strings | Shows the author of the document. |
| CPU architecture | Strings | Shows the CPU architecture. |
| Solution version | Strings | Shows the solution version. |
| Load behavior | Numbers | Shows the load behavior of the COM add-ins as follows: 0 - Do not load automatically (Unloaded) 1 - Do not load automatically (Loaded) 2 - Load at startup (Unloaded) 3 - Load at startup (Loaded) 8 - Load on demand (Unloaded) 9 - Load on demand (Loaded) 16 - Load first time, and then load on demand (Loaded) |
| File size (bytes) | Numbers | Shows the file size in bytes. |
| Has VBA | Boolean | Shows 1 if the document has VBA. |
| Has OLE | Boolean | Shows 1 if the document has OLE objects. |
| Has external data connection | Boolean | Shows 1 if the document has an external data connection. |
| Has ActiveX control | Boolean | Shows 1 if the document has an ActiveX control. |
| Has assembly reference | Boolean | Shows 1 if the document has an assembly reference. |
| Has XML schema | Boolean | Shows 1 if the document has an XML schema. |
| Has XML expansion pack | Boolean | Shows 1 if the document has an XML expansion pack. |
| Last loaded | Date/time | Shows the last date and time that the solution was loaded. |
| Last scanned | Date/time | Shows the last date and time that the computer was scanned by the agent. |
The following table shows the fields in the Lookup_computers table.
Fields in the Lookup_computers table
| Field name | Type | Description |
|---|---|---|
| Computer ID | Number | The primary key for this table. |
| Computer name | String | Shows the computer name. |
| Computer domain | String | Shows the domain name that is registered for this computer. |
| Telemetry Agent version | String | Shows the agent version that uploads the data to the database. |
| Computer processor name | String | Shows the processor name of the computer. |
| Number of processors (logical) | Number | Shows the number of logical processors in the computer. |
| Number of processors (physical) | Number | Shows the number of physical processors in the computer. |
| System type | String | Shows the architecture type (32-bit or 64-bit) of the computer. |
| Computer installed memory | Number | Shows amount of memory (in megabytes) that is installed in this computer. |
| Display resolution | String | Shows this computer's screen resolution (for example, 1280 x 780). |
| Display resolution (width) | Number | Shows the screen resolution width. |
| Display resolution (height) | Number | Shows the screen resolution height. |
| Windows version | String | Shows the Windows version of the computer. |
| Windows version (detail) | String | Shows Windows version in detail. |
| Windows system locale | String | Shows the system locale setting for Windows. |
| Windows system display language | String | Shows system display language for Windows. |
| IE version | String | Shows the Internet Explorer version. |
| IE version (detail) | String | Shows the Internet Explorer version in detail. |
The following table shows the fields in the Lookup_solutions table.
Fields in the Lookup_solutions table
| Field name | Type | Description |
|---|---|---|
| Solution ID | Number | The primary key for this table. |
| Solution type | String | Shows the solution or document type. |
| Application | String | Shows the application that used this solution or document. |
| Solution name | String | Shows the solution name. |
| File name | String | Shows the solution or document file name. |
| ProgID | String | Shows the solution ProgID. |
| Publisher | String | Shows the solution or document publisher name. |
The following table shows the fields in the Lookup_users table.
Fields in the Lookup_users table
| Field name | Type | Description |
|---|---|---|
| User ID | Number | The primary key for this table. |
| User name | String | Shows the user name. |
| User domain | String | Shows the domain name for this user. |
| Label 1 | String | Shows the Label 1 setting. |
| Label 2 | String | Shows the Label 2 setting. |
| Label 3 | String | Shows the Label 3 setting. |
| Label 4 | String | Shows the Label 4 setting. |
The following table shows the fields in the Lookup_issue_definitions table.
Fields in the Lookup_issue_definitions table
| Field name | Type | Description |
|---|---|---|
| Issue ID | Number | The primary key for this table. |
| Severity | String | Shows the severity of issue. |
| Issue type | String | Shows the issue type. |
| Issue title | String | Shows the issue title. |
| Explanation | String | Shows the issue explanation. |
| More info | String | Shows the URL where you can get more information. |
Hidden tables in Office Telemetry Dashboard custom reports
Not all tables are loaded when you create a custom report. If you want to access more data for your custom report, you can load the Usage_summary, Issue_summary, and System_details tables. Follow these steps to add these hidden tables to Office Telemetry Dashboard.
To add hidden tables to Office Telemetry Dashboard
Follow the steps in Create custom reports in Office Telemetry Dashboard to start Office Telemetry Dashboard, connect to the database, and create a custom report.
After you create the custom report, select any area in the custom report. This makes the ANALYZE tab available on the ribbon.
On the ANALYZE tab (under PIVOTTABLE TOOLS) on the ribbon, in the Data group, select Change Data Source, and then select Connection Properties.
In the Workbook Connections for Custom report dialog box, select Telemetry Dashboard - Custom report, select Properties, and then select the Definition tab.
In the Command text box, add the following text (don't delete or overwrite the existing text): ,"Usage_summary", "Issue_summary", "System_details"
Choose OK, and on each dialog box, select Close.
In the PivotTable Fields list, Choose ALL, and then scroll down to see the newly added tables for Usage_summary, Issue_summary, and System_details.
Right-click each new table, and choose Show in Active Tab. The new tables are added to the Active list under PivotTable Fields in the right column for easier access.
The following tables list the hidden tables that you have to manually add to Office Telemetry Dashboard and describe the fields in the hidden tables.
Hidden tables in Office Telemetry Dashboard custom reports
| Table name | Comments |
|---|---|
| Usage_summary | Shows data for seven days, one month, and three months. You can use this table to create a relationship to the following tables to see more details: - Inventory - Lookup_computers - Lookup_solutions - Lookup_users |
| Issue_summary | Shows the issues that have occurred in the last seven days, one month, and three months. You can use this table to create a relationship to following tables to see more details: - Inventory - Lookup_computers - Lookup_issue_definitions - Lookup_solutions - Lookup_users |
| System_details | Shows user and computer information. |
The following table describes the fields in the Usage_summary table.
Fields in the Usage_summary table
| Field name | Type | Description |
|---|---|---|
| Inventory ID | String | Connects to the Inventory table to gain access to more details in the PivotTable report. |
| Solution ID | Number | Connects to the Lookup_solutions table to obtain more details in PivotTable report if there's no relationship between the Inventory and Lookup_solutions tables. |
| User ID | Number | Connects to the Lookup_users table to obtain more details in the PivotTable report if there's no relationship between the Inventory and Lookup_users tables. |
| Computer ID | Number | Connects to the Lookup_computers table to obtain more details in PivotTable report if there's no relationship between the Inventory and Lookup_computers tables. |
| Total session (last seven days) | Number | Shows the total number of sessions in the last seven days. |
| Total session (last one month) | Number | Shows the total number of sessions in the last one month. |
| Total session (last three months) | Number | Shows the total number of sessions in the last three months. |
| Failed session (last seven days) | Number | Shows the total number of sessions that had an issue in last the seven days. |
| Failed session (last one month) | Number | Shows the total number of sessions that had an issue in the last one month. |
| Failed session (last three months) | Number | Shows the total number of sessions that had an issue in the last three months. |
The following table describes the fields in the Issue_summary table.
Fields in the Issue_summary table
| Field name | Type | Description |
|---|---|---|
| Issue ID | Number | Connects to the Lookup_issue_definitions table to obtain more details in the PivotTable report. |
| Inventory ID | String | Connects to the Inventory table to obtain more details in the PivotTable report. |
| Solution ID | Number | Connects to the Lookup_solutions table to obtain more details in the PivotTable report if there's no relationship between the Inventory and Lookup_solutions tables. |
| User ID | Number | Connects to the Lookup_users table to obtain more details in the PivotTable report if there's no relationship between the Inventory and Lookup_users tables. |
| Computer ID | Number | Connects to the Lookup_computers table to obtain more details in the PivotTable report if there's no relationship between the Inventory and Lookup_computers tables. |
| Number of instances (last seven days) | Number | Shows the number of issue events in the last seven days. |
| Number of instances (last one month) | Number | Shows the number of issue events in the last one month. |
| Number of instances (last three months) | Number | Shows the number of issue events in the last three months. |
The following table describes the fields in the System_details table.
Fields in the System_details table
| Field name | Type | Description |
|---|---|---|
| Computer name | String | Shows the computer name. |
| Computer domain | String | Shows the domain name that is registered for this computer. |
| User name | String | Shows the user name. |
| User domain | String | Shows the domain name for this user. |
| Label 1 | String | Shows the Label 1 setting. |
| Label 2 | String | Shows the Label 2 setting. |
| Label 3 | String | Shows the Label 3 setting. |
| Label 4 | String | Shows the Label 4 setting. |
| Telemetry Agent version | String | Shows the version of agent that collected this data. |
| Telemetry Processor (file share) | String | Shows the file share for the processor that uploaded data to the database. |
| Telemetry Processor (computer) | String | Shows the computer name for the processor that uploaded data to the database. |
| Computer processor name | String | Shows the processor name of the computer. |
| Number of processors (logical) | Number | Shows the number of logical processors in the computer. |
| Number of processors (physical) | Number | Shows the number of physical processors in the computer. |
| System type | String | Shows the system type of the computer. |
| Computer installed memory | Number | Shows amount of memory (in megabytes) that is installed in this computer. |
| Display resolution | String | Shows this computer's screen resolution (for example, 1280 x 780). |
| Display resolution (width) | Number | Shows the screen resolution width. |
| Display resolution (height) | Number | Shows the screen resolution height. |
| Windows version | String | Shows the Windows version of the computer. |
| Windows version (detail) | String | Shows Windows version details. |
| Windows system locale | String | Shows the system locale setting for Windows. |
| Windows system display language | String | Shows the system display language setting for Windows. |
| IE version | String | Shows the Internet Explorer version. |
| IE version (details) | String | Shows the Internet Explorer version in detail. |
| Windows system local (user) | String | Shows the Windows system local setting (user setting). |
| Windows display language (user) | String | Shows the Windows system display language (user setting). |
| Last scanned | Date/time | Shows the agent scanned date/time. |
| Office 2003 | String | Shows Office 2003 version details, if it's installed. |
| Office 2007 | String | Shows Office 2007 version details, if it's installed. |
| Office 2010 | String | Shows Office 2010 version details, if it's installed. |
| Office 15 | String | Shows Office 2013 version details, if it's installed. |
| Office 16 | String | Shows Office 2019 or Office 2016 version details, if it's installed. |
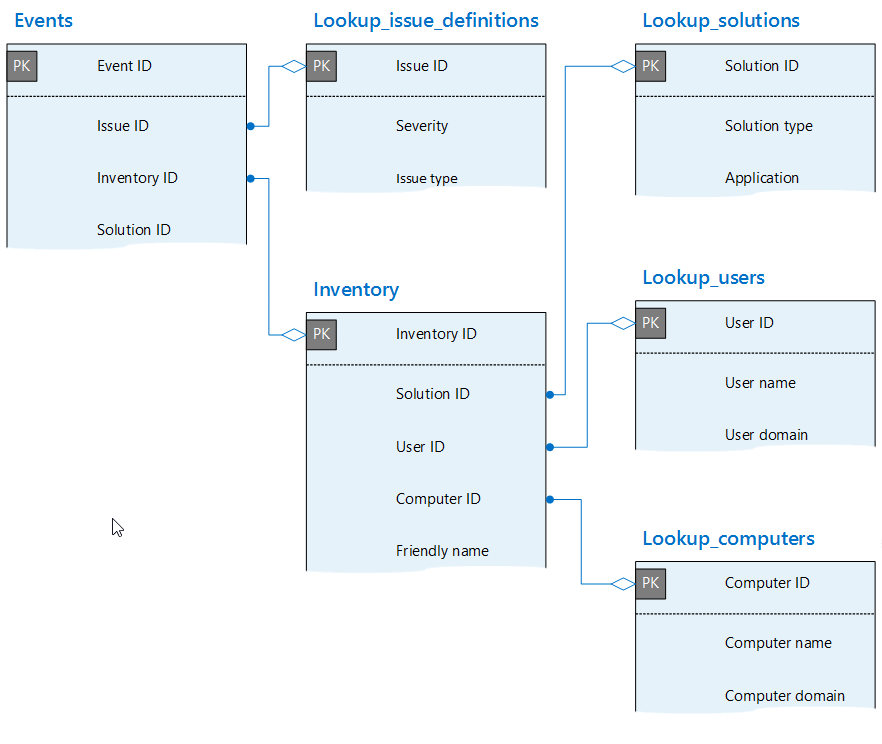
Default data relationships in Office Telemetry Dashboard custom reports
The following illustrations show the relationships between tables in the database.
Default relationships between tables in the database
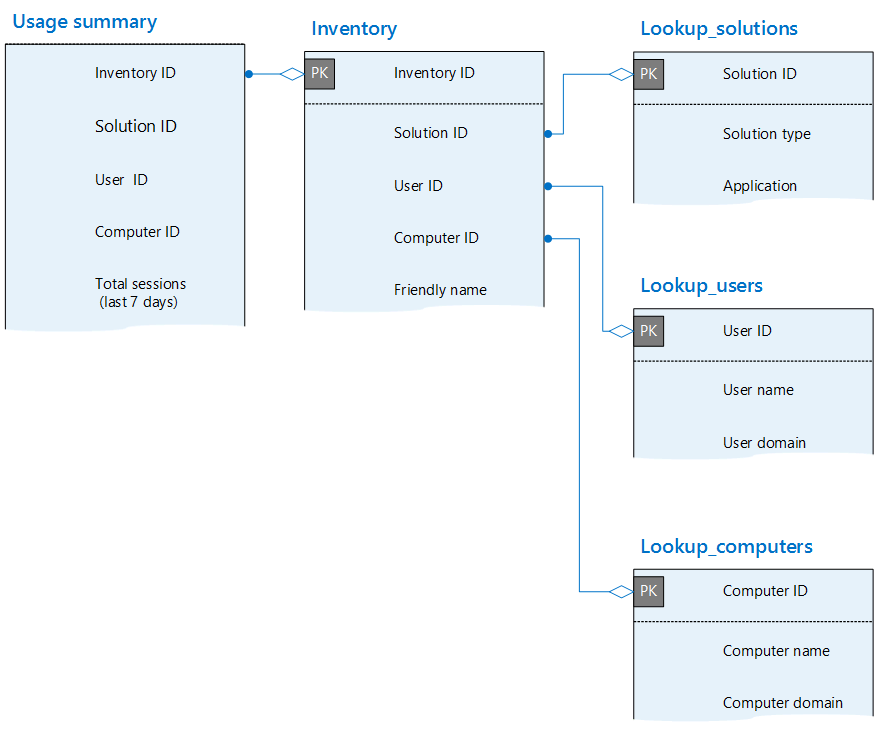
The Usage_summary table and its relationships
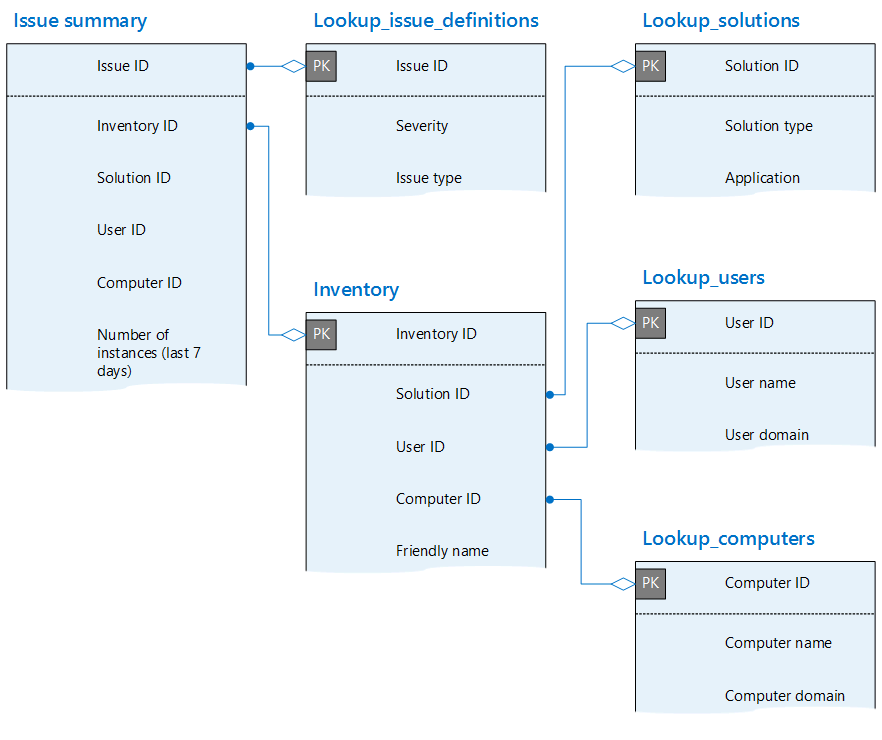
The Issue_summary table and its relationships
Related articles
Feedback
Coming soon: Throughout 2024 we will be phasing out GitHub Issues as the feedback mechanism for content and replacing it with a new feedback system. For more information see: https://aka.ms/ContentUserFeedback.
Submit and view feedback for